- Agents
- Essentials
- Getting Started
- Agent
- API
- APM Tracing
- Containers
- Dashboards
- Database Monitoring
- Datadog
- Datadog Site
- DevSecOps
- Incident Management
- Integrations
- Internal Developer Portal
- Logs
- Monitors
- Notebooks
- OpenTelemetry
- Profiler
- Search
- Session Replay
- Security
- Serverless for AWS Lambda
- Software Delivery
- Synthetic Monitoring and Testing
- Tags
- Workflow Automation
- Learning Center
- Support
- Glossary
- Standard Attributes
- Guides
- Agent
- Integrations
- Extend Datadog
- Authorization
- DogStatsD
- Custom Checks
- Integrations
- Build an Integration with Datadog
- Create an Agent-based Integration
- Create an API-based Integration
- Create a Log Pipeline
- Integration Assets Reference
- Build a Marketplace Offering
- Create an Integration Dashboard
- Create a Monitor Template
- Create a Cloud SIEM Detection Rule
- Install Agent Integration Developer Tool
- Service Checks
- Community
- Guides
- OpenTelemetry
- Administrator's Guide
- API
- Partners
- Datadog Mobile App
- DDSQL Reference
- CoScreen
- CoTerm
- Remote Configuration
- Cloudcraft (Standalone)
- In The App
- Dashboards
- Notebooks
- DDSQL Editor
- Reference Tables
- Sheets
- Monitors and Alerting
- Service Level Objectives
- Metrics
- Watchdog
- Bits AI
- Internal Developer Portal
- Error Tracking
- Change Tracking
- Event Management
- Incident Response
- Actions & Remediations
- Infrastructure
- Cloudcraft
- Resource Catalog
- Universal Service Monitoring
- End User Device Monitoring
- Hosts
- Containers
- Processes
- Serverless
- Network Monitoring
- Storage Management
- Cloud Cost
- Application Performance
- APM
- Continuous Profiler
- Database Monitoring
- Agent Integration Overhead
- Setup Architectures
- Setting Up Postgres
- Setting Up MySQL
- Setting Up SQL Server
- Setting Up Oracle
- Setting Up Amazon DocumentDB
- Setting Up MongoDB
- Setting Up ClickHouse
- Connecting DBM and Traces
- Data Collected
- Exploring Database Hosts
- Exploring Query Metrics
- Exploring Query Samples
- Exploring Database Schemas
- Exploring Recommendations
- Troubleshooting
- Guides
- Data Streams Monitoring
- Data Observability
- Digital Experience
- Real User Monitoring
- Synthetic Testing and Monitoring
- Continuous Testing
- Experiments
- Product Analytics
- Session Replay
- Software Delivery
- CI Visibility
- CD Visibility
- Deployment Gates
- Test Optimization
- Code Coverage
- PR Gates
- DORA Metrics
- Feature Flags
- Developer Integrations
- Security
- Security Overview
- Cloud SIEM
- Code Security
- Cloud Security
- App and API Protection
- AI Guard
- Workload Protection
- Sensitive Data Scanner
- AI Observability
- Log Management
- Observability Pipelines
- Configuration
- Sources
- Processors
- Destinations
- Packs
- Akamai CDN
- Amazon CloudFront
- Amazon VPC Flow Logs
- AWS Application Load Balancer Logs
- AWS CloudTrail
- AWS Elastic Load Balancer Logs
- AWS Network Load Balancer Logs
- Cisco ASA
- Cloudflare
- F5
- Fastly
- Fortinet Firewall
- HAProxy Ingress
- Istio Proxy
- Juniper SRX Firewall Traffic Logs
- Netskope
- NGINX
- Okta
- Palo Alto Firewall
- Windows XML
- ZScaler ZIA DNS
- Zscaler ZIA Firewall
- Zscaler ZIA Tunnel
- Zscaler ZIA Web Logs
- Search Syntax
- Scaling and Performance
- Monitoring and Troubleshooting
- Guides and Resources
- Log Management
- CloudPrem
- Administration
Device Topology Map
Overview
The Network Device Topology Map uses Cloudcraft diagrams to provide an interactive visual representation of your network’s physical connections. The map automatically discovers and displays devices, their interfaces, and the relationships between them. This visualization helps you identify issues in your network devices, understand their upstream and downstream impacts, troubleshoot connectivity problems, and gain insights into how traffic flows through your infrastructure.
Setup
The Datadog Agent version 7.52 and later automatically collects topology data. No additional installation is necessary.
Prerequisites
- Devices have LLDP (Link Layer Discovery Protocol) and/or CDP (Cisco Discovery Protocol) enabled with SNMP. Use the same protocol on connected devices so that they can discover each other. LLDP is generally preferred as it is a more common option.
- Datadog Agent version 7.52 or later is installed.
Navigation options
In the Network Topology Map, the following navigation options are available:
Group by
Under Group By, use tags such as location and vendor to select how you want to visualize your devices:
Filter devices
Select the + Filter dropdown to refine which devices are displayed on the Device Topology Map.
Note: The Filter Devices setting determines which devices appear on the Device Topology Map for all queries, including those that filter by a device facet in the search bar.
Resources
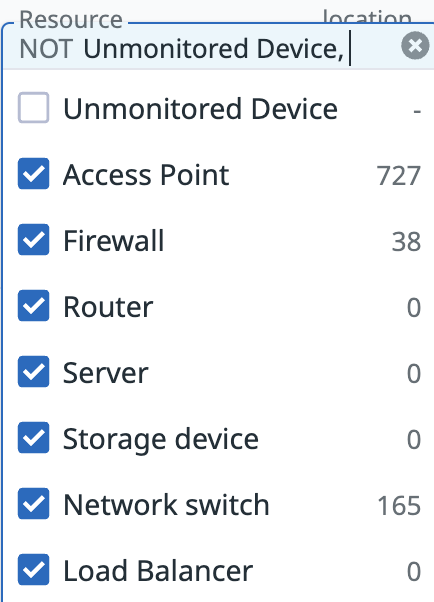
Use the Resource dropdown to filter the diagram by specific device types, such as Firewalls, Access Points, and Routers.
By default, the Unmonitored Device option is unchecked, which hides devices that are not directly monitored by Network Device Monitoring but are discovered through LLDP/CDP from adjacent monitored devices. Check this option to display these unmonitored devices on the diagram.
Investigating devices
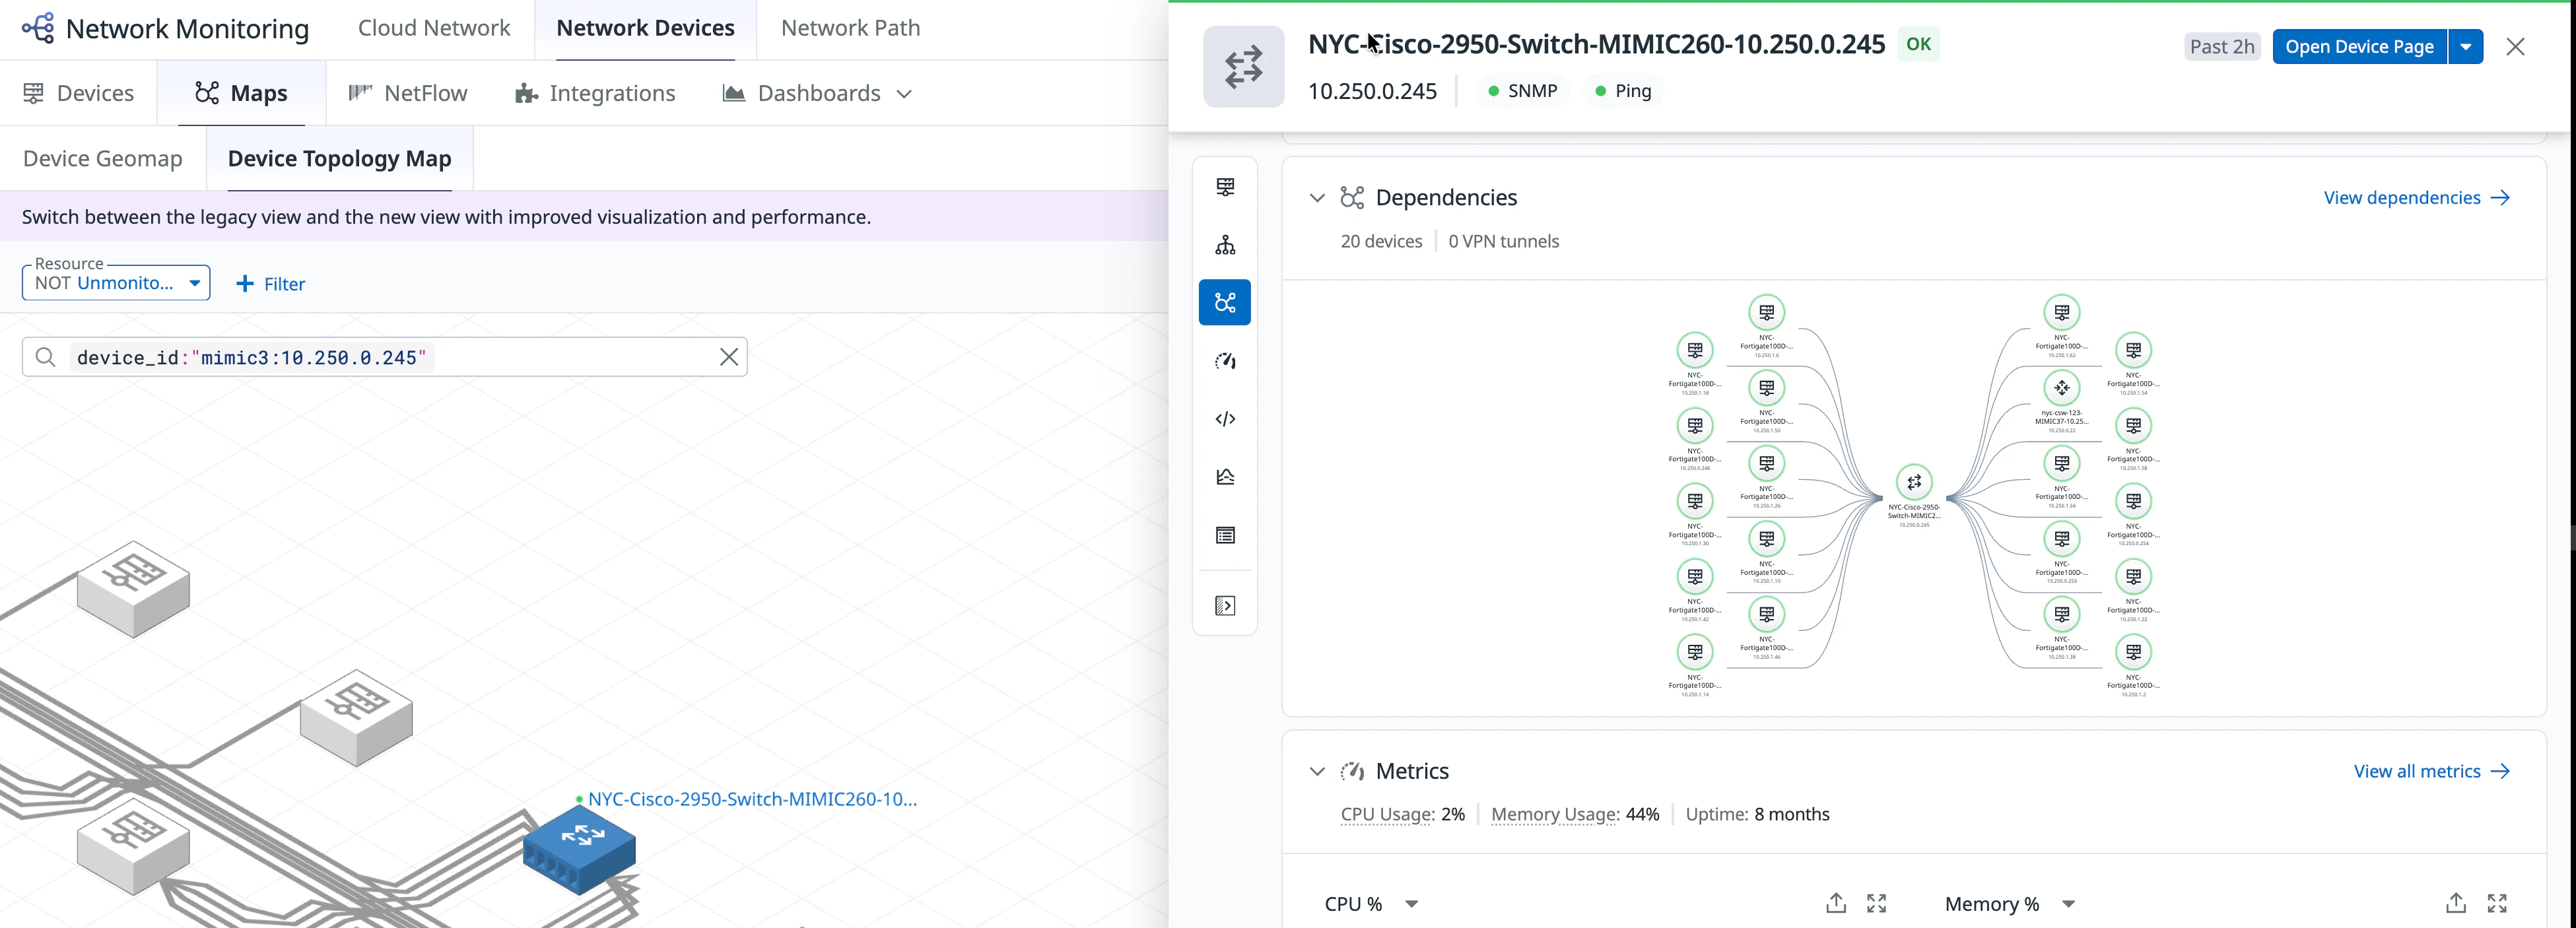
In addition to showing an overview of your network’s physical connections, the Device Topology Map lets you investigate individual devices to understand their connections, flows, and overall status. Hover over a device to see its status and key metrics, or click a device to open the NDM device view with details such as its IP address, tags, throughput, CPU, and memory.
While investigating a device, click the Open Device Page dropdown in the top right of the device view to navigate to NetFlow Monitoring or other related pages for deeper investigation.
Dependencies
The Dependencies section in the NDM device view shows the number of physically connected devices and VPN tunnels at a glance, along with a visual graph of neighboring devices.
Click View dependencies to open the full device page. On the Dependencies tab, use the Physical or VPN filters to switch between physical connections and VPN tunnels (VPN dependencies require VPN Monitoring to be configured). The physical view displays a topology graph alongside a table of connected devices showing their status, device name, IP address, monitors, local interface, and remote interface.
Metrics
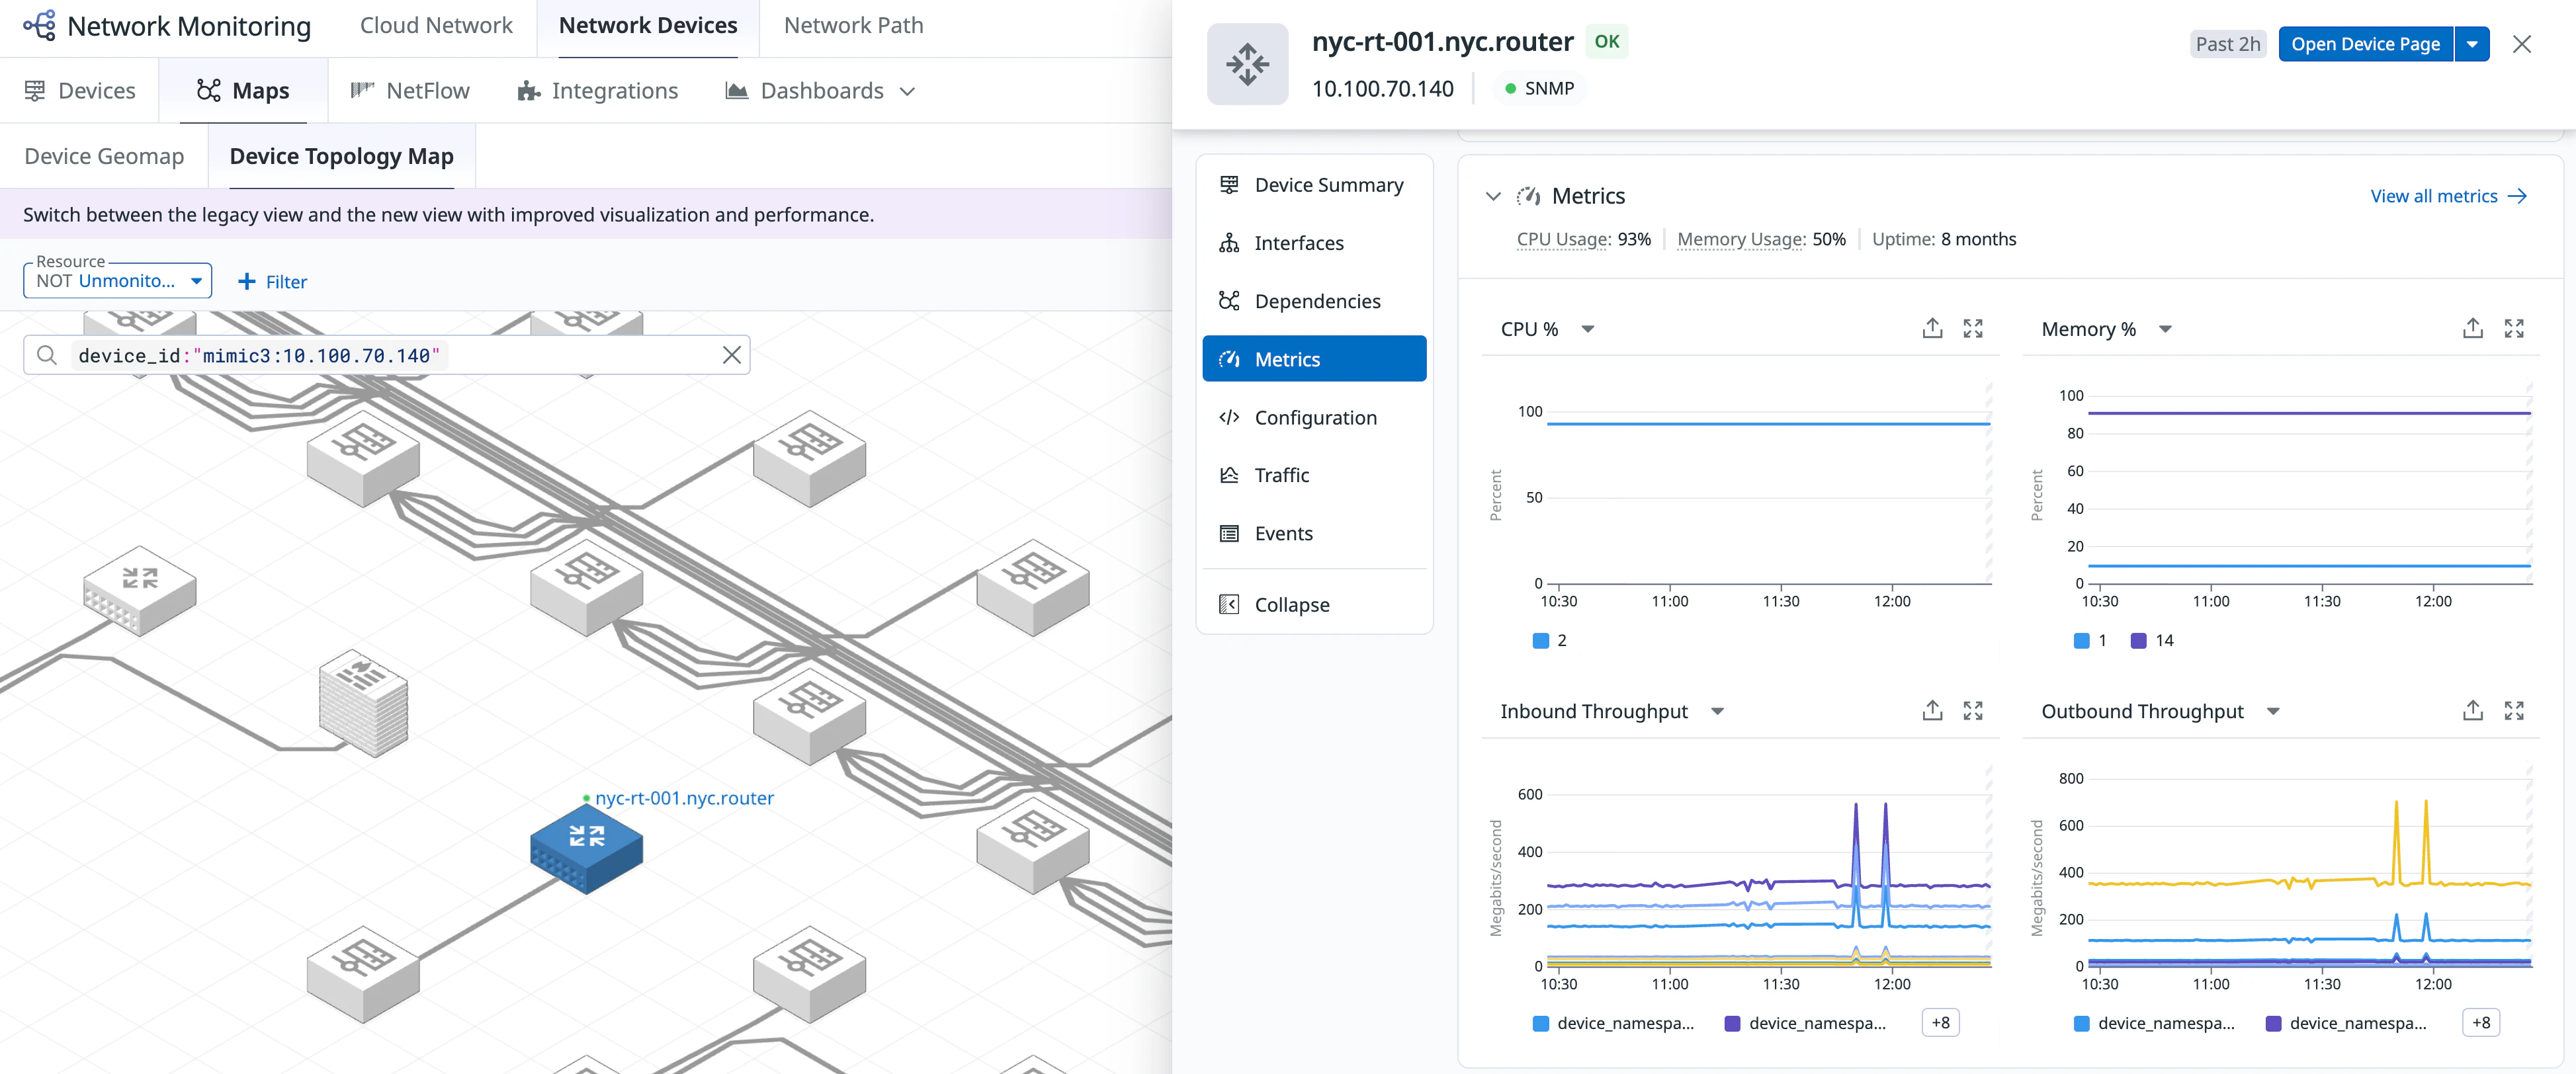
Click the Metrics tab in the NDM device view to see key metrics for the device, including CPU usage, memory usage, and throughput. Summary stats are displayed at the top, and each metric is shown as a graph over time. Click View all metrics to explore the full list of collected metrics.
Traffic
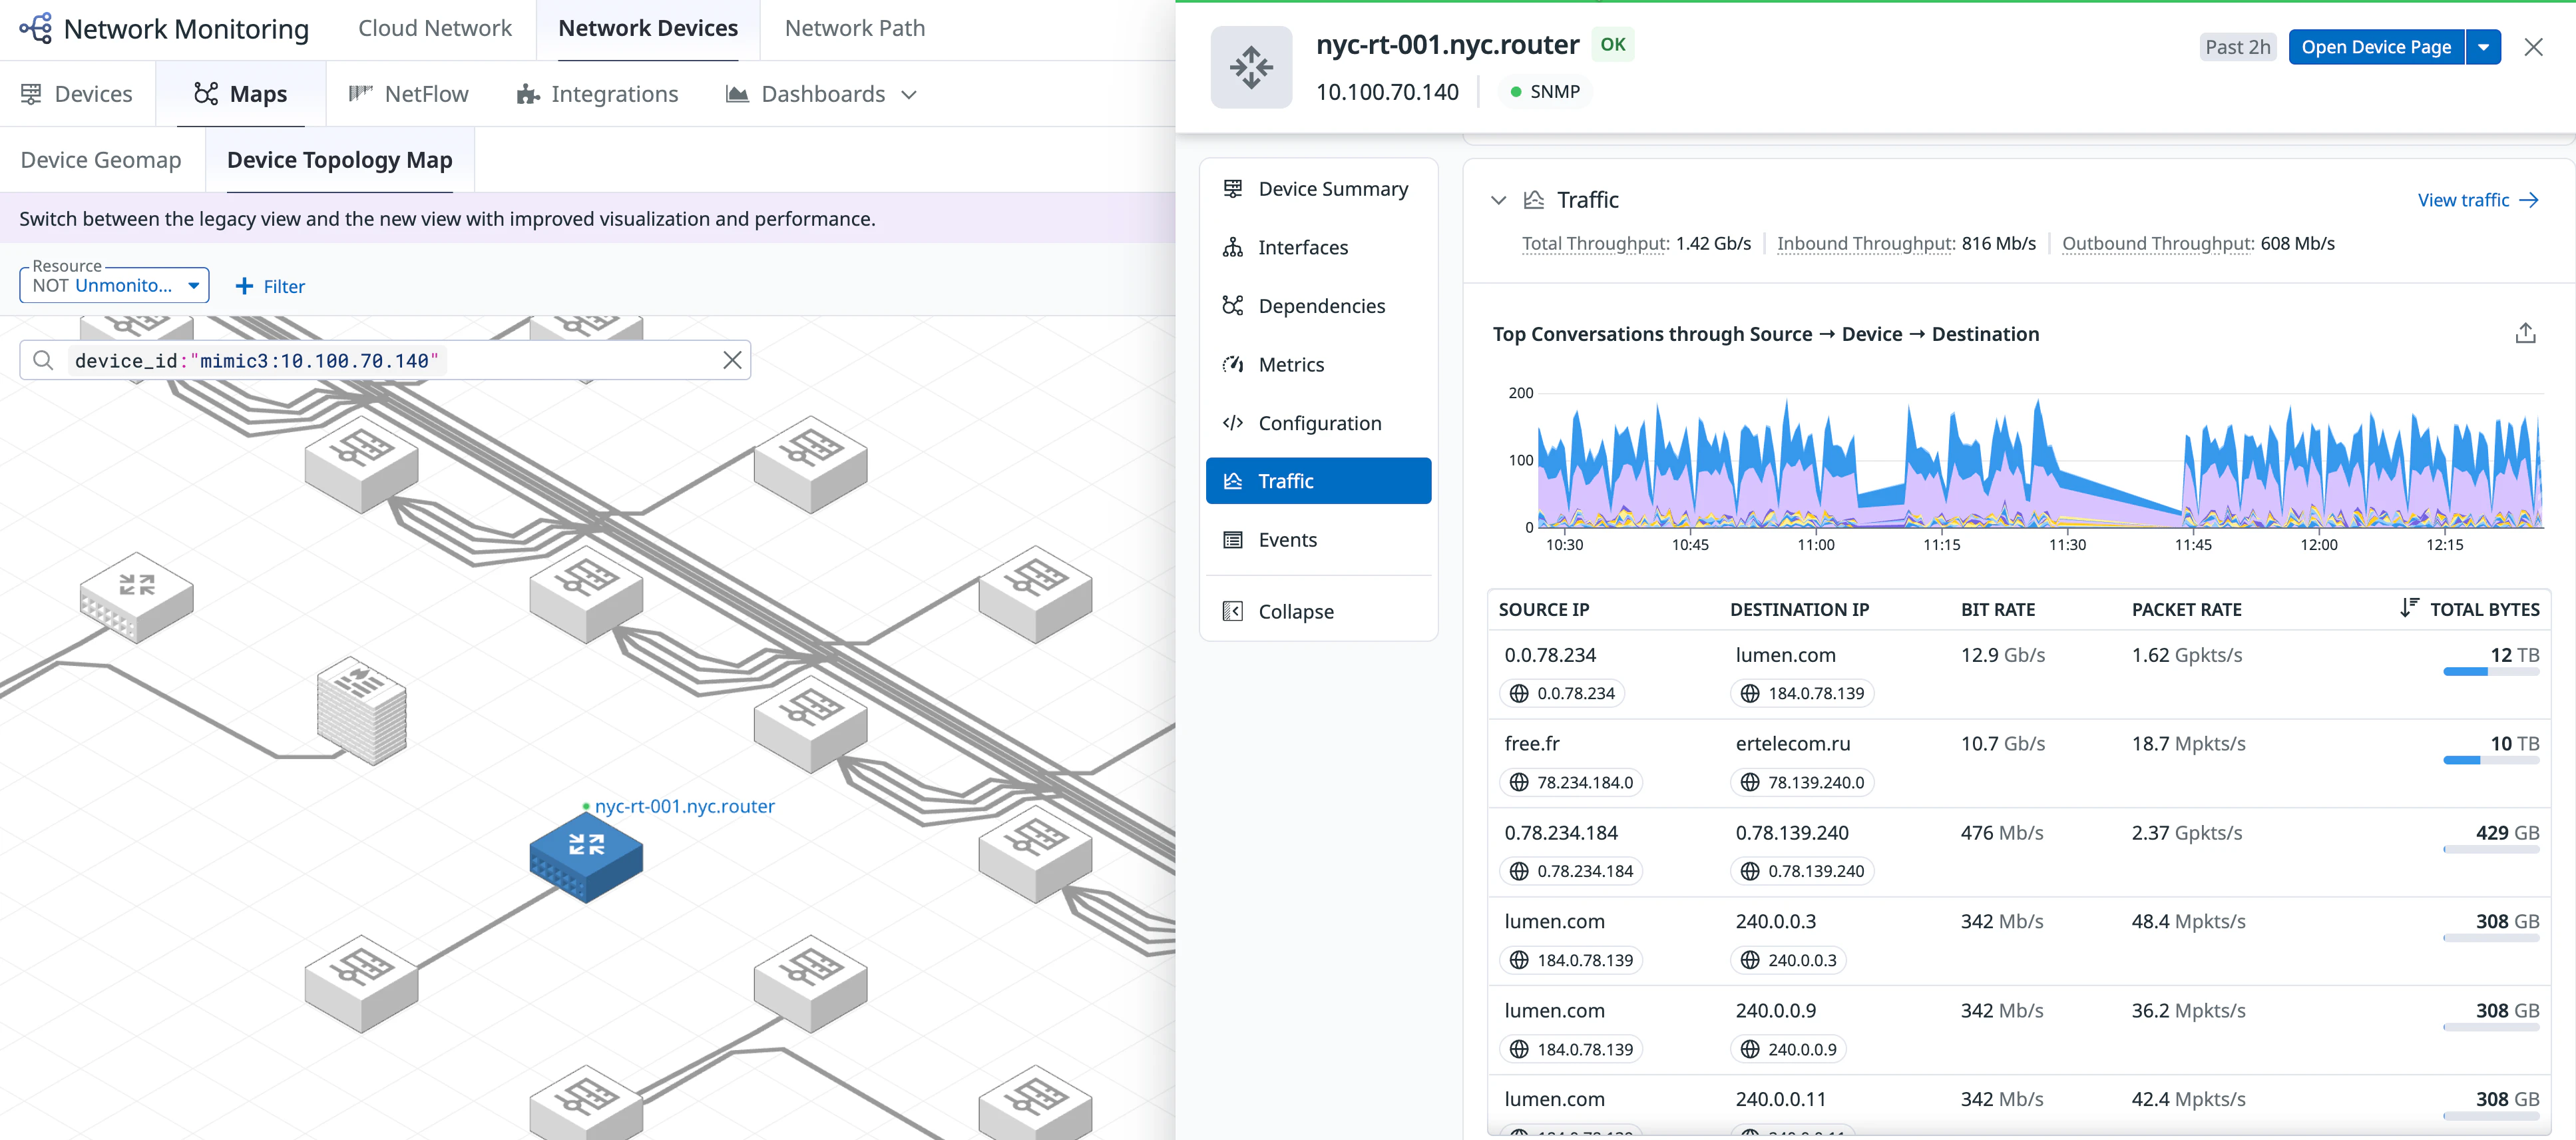
Click the Traffic tab to view total, inbound, and outbound throughput for the device. A traffic graph shows activity over time, and the Top Conversations table lists the highest-volume source-to-destination flows with bit rate, packet rate, and total bytes. Click View traffic to investigate further on the device summary page, and in NetFlow Monitoring.
Events
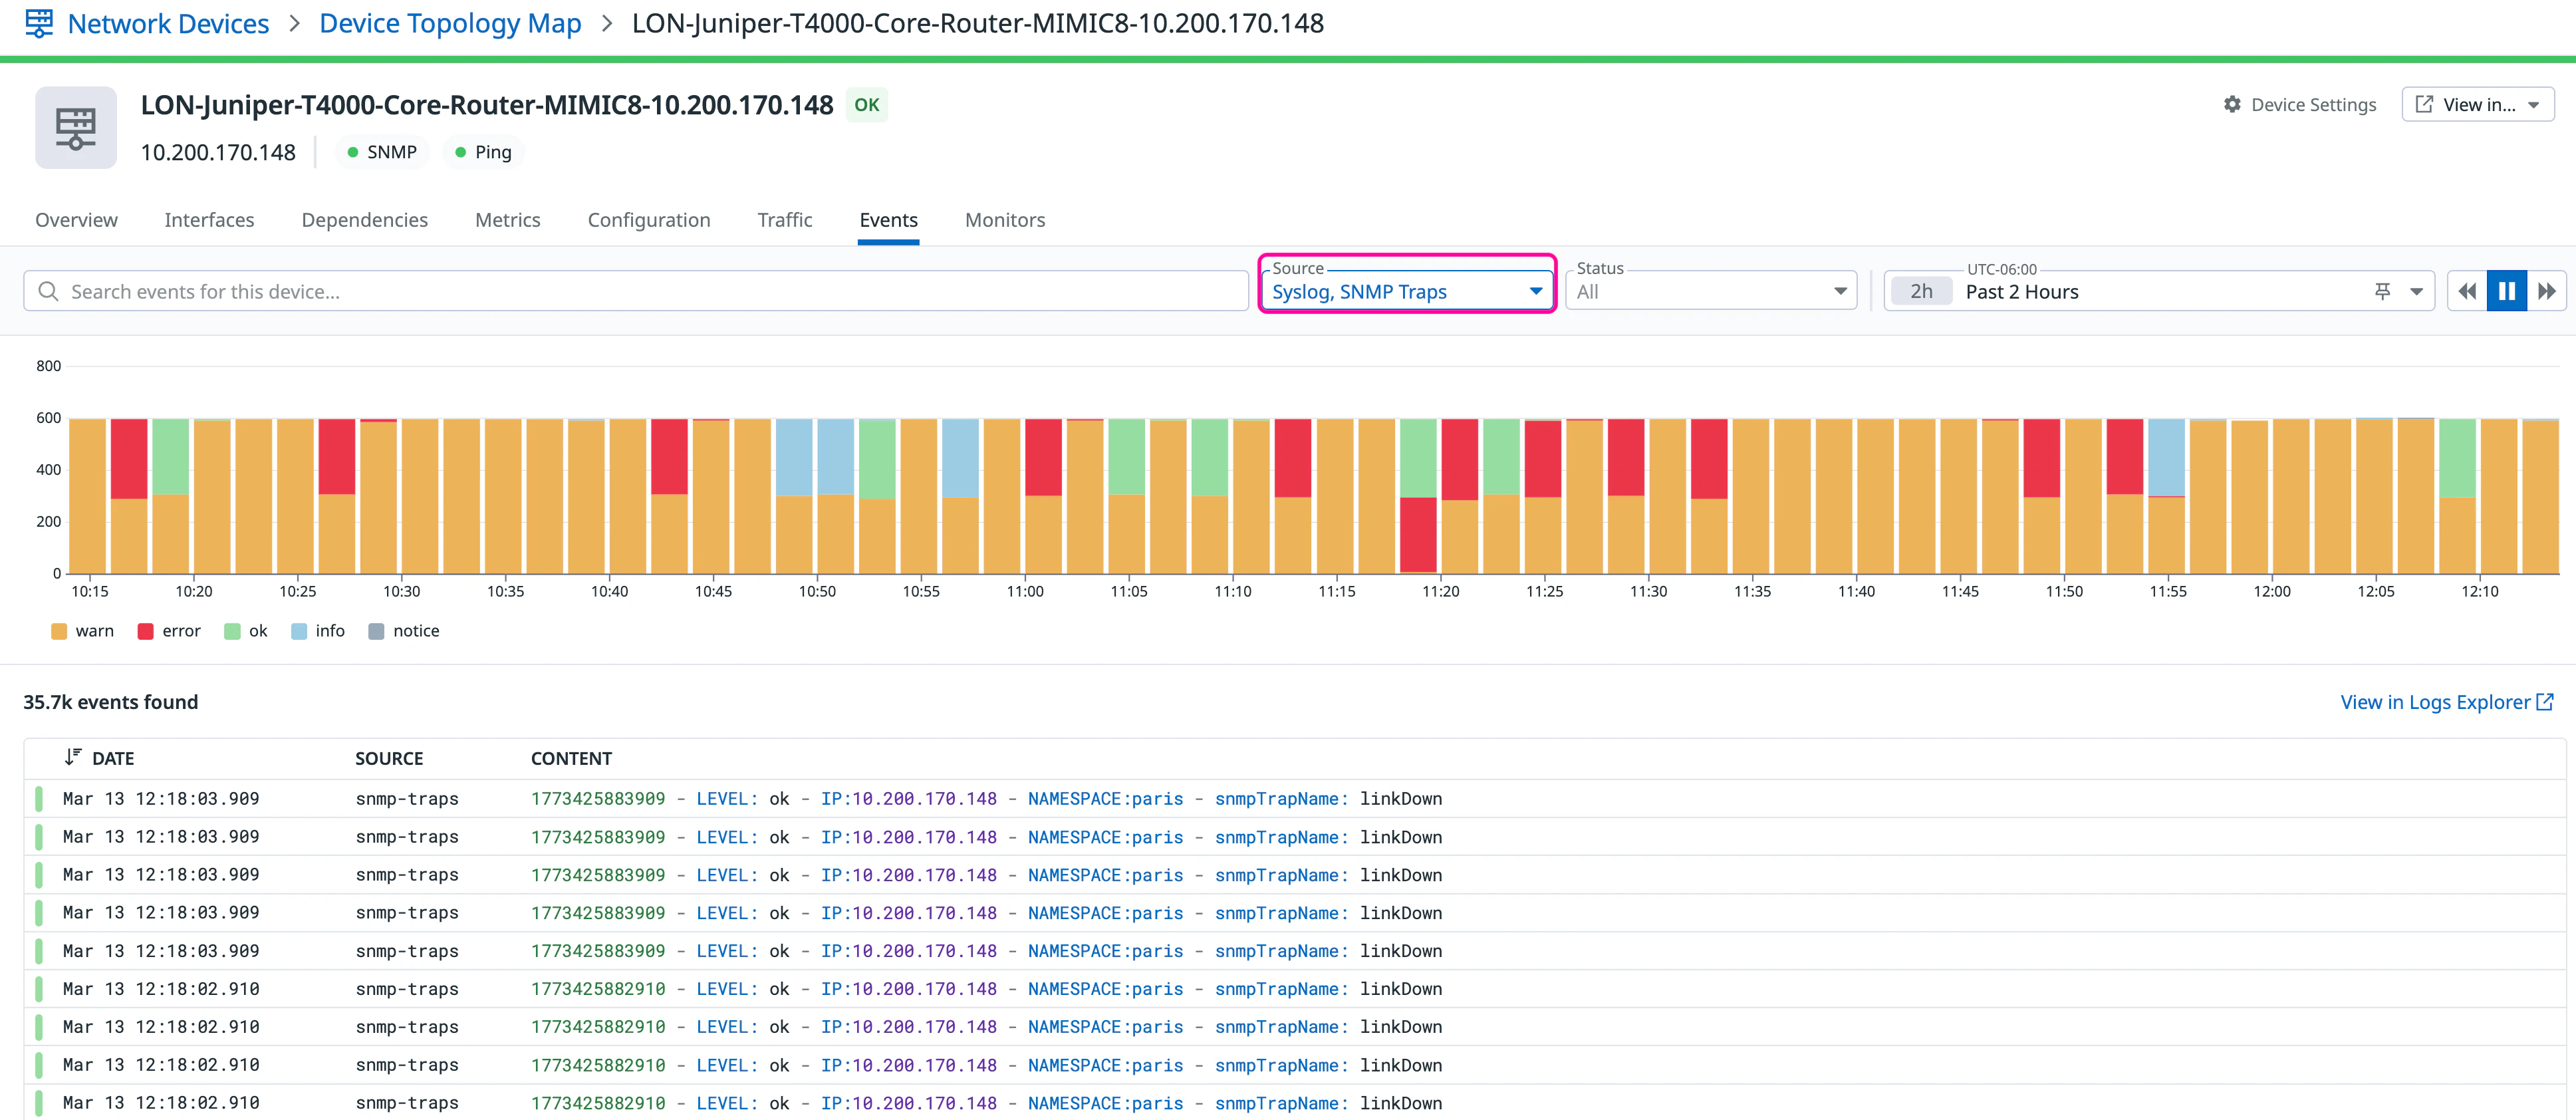
Click the Events tab to view Syslog messages and SNMP traps in a single, combined view. Use filters to narrow results by event type. Spikes in event volume are visually highlighted, helping you identify and investigate errors.
View flow details
To explore a device’s traffic sources, destinations, and volume, click the Open Device Page dropdown and select NetFlow Monitoring. The data is automatically filtered by the device’s @device.ip. For more information, see NetFlow Monitoring.
Device settings
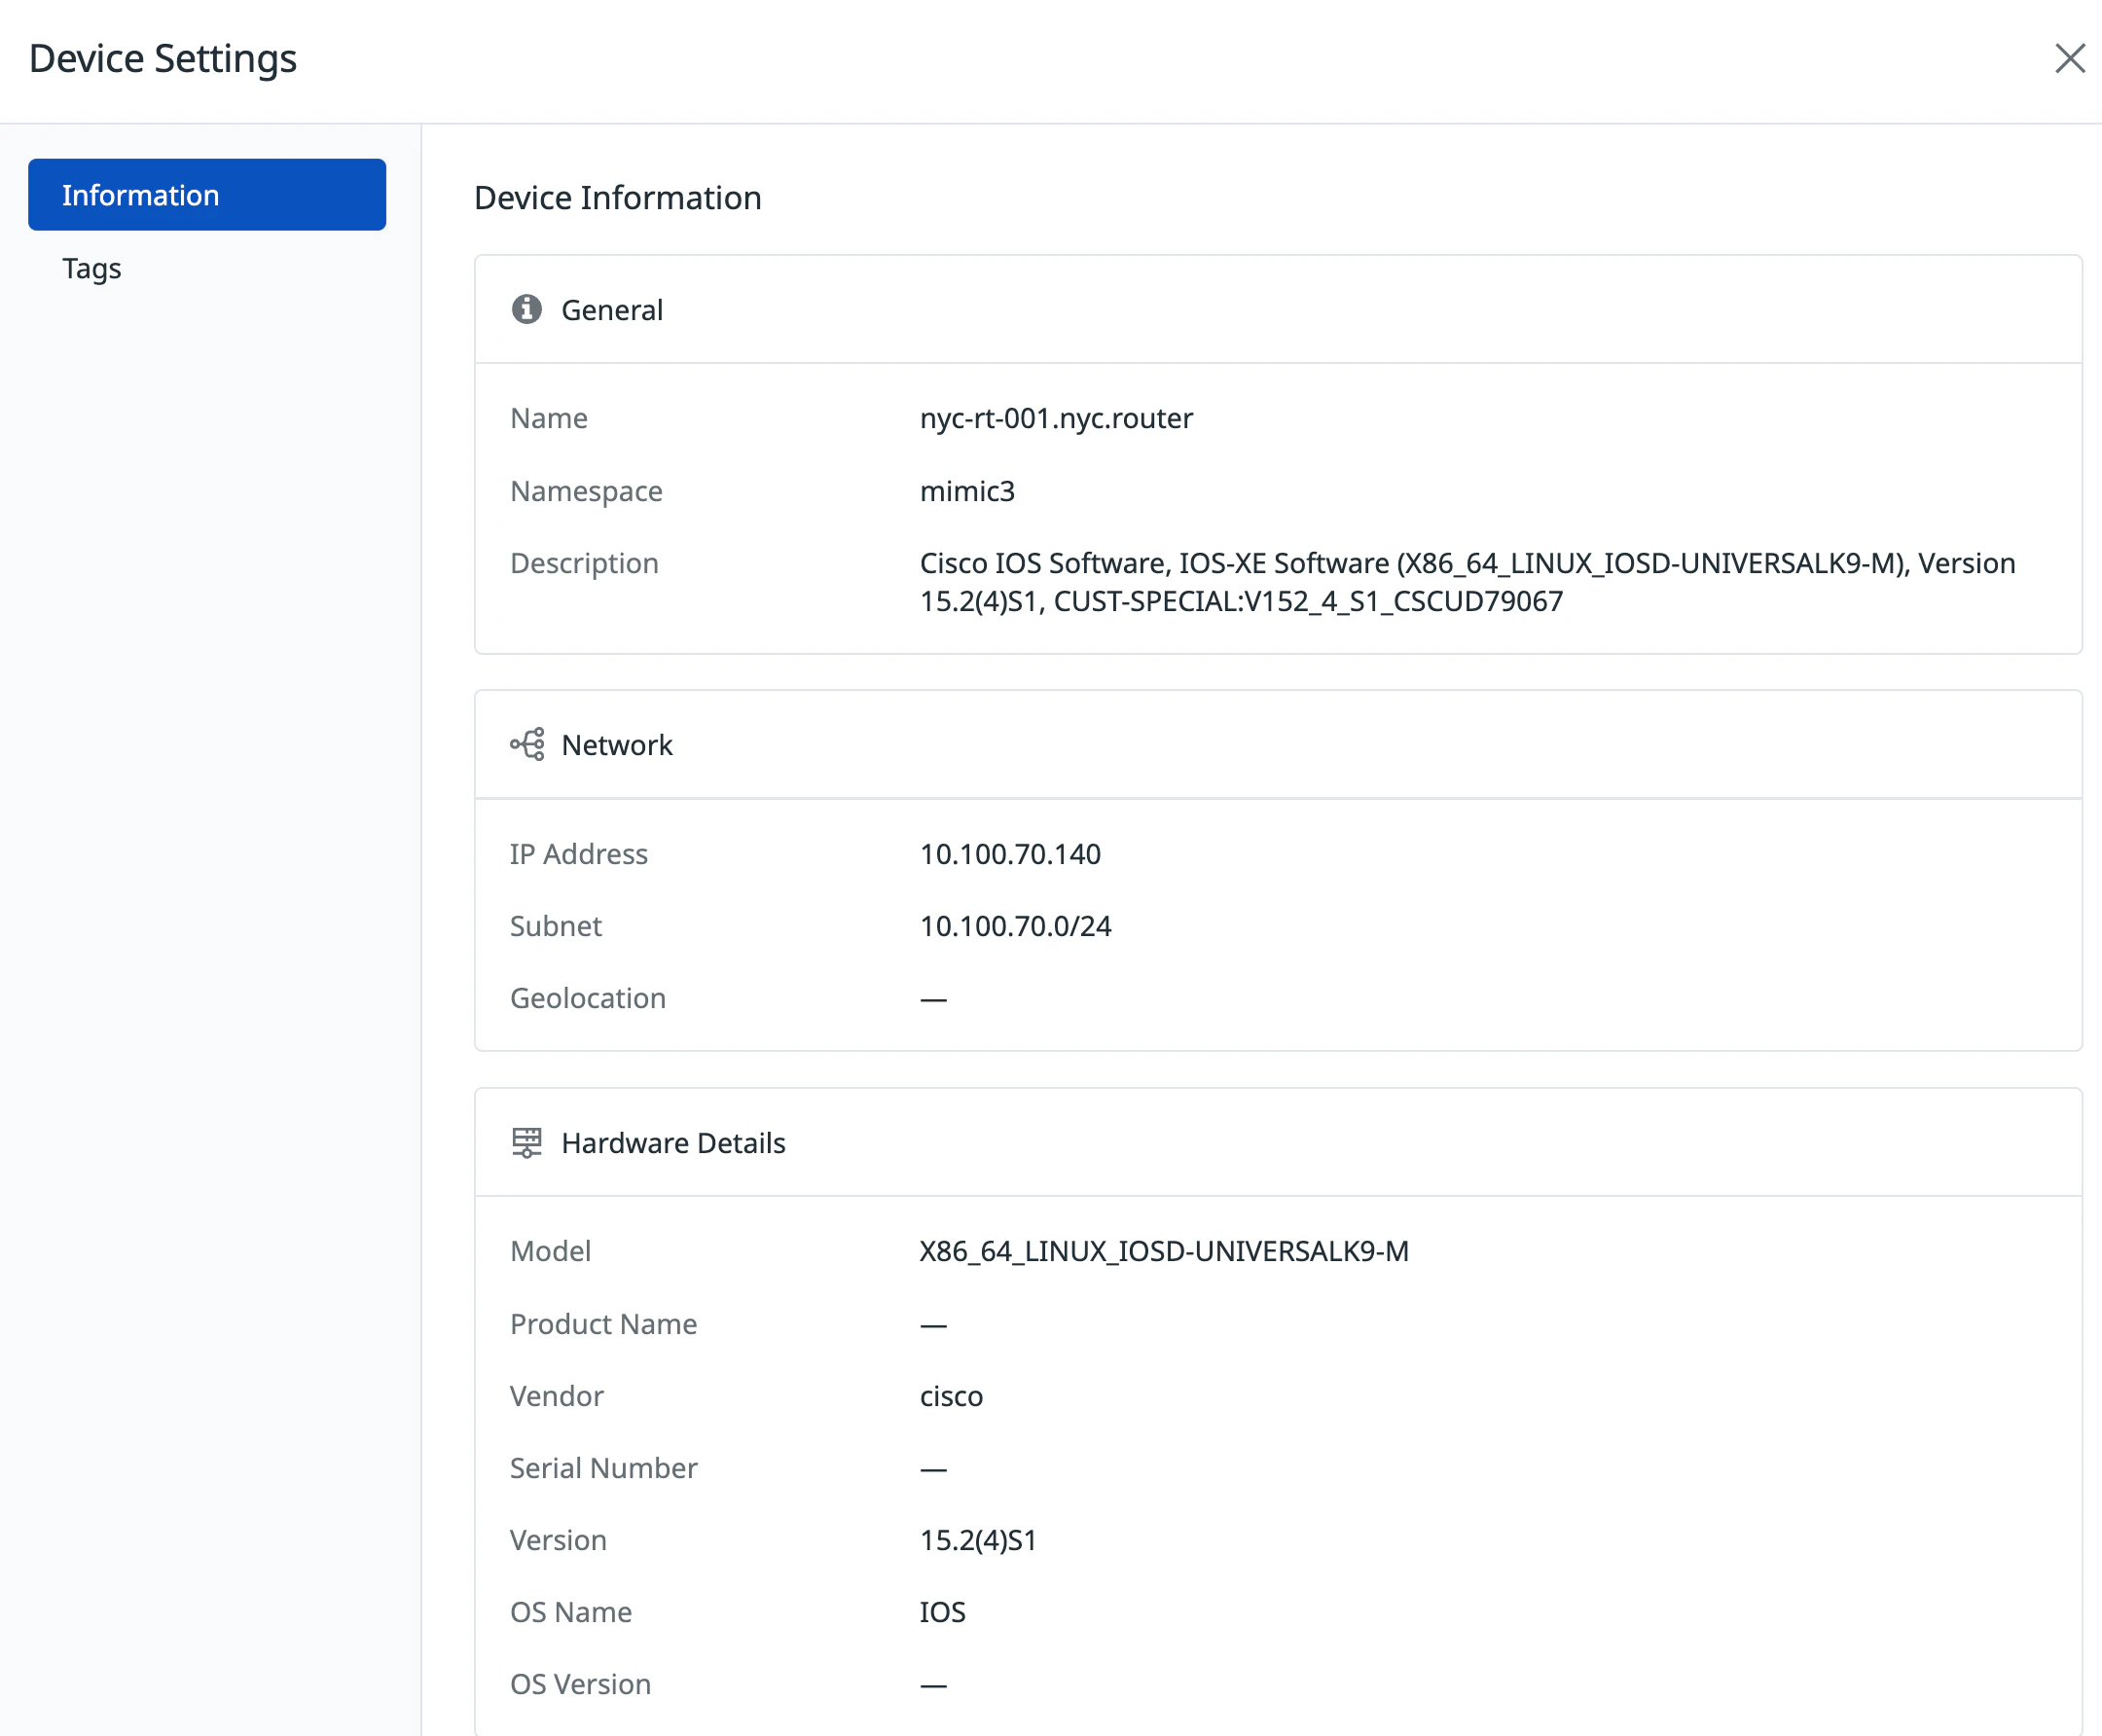
Click the Device Settings icon in the NDM device view to open the Device Settings panel. The Information tab displays general details (name, namespace, and description), network details (IP address, subnet, and geolocation), and hardware details (model, vendor, OS, and version). The Tags tab lets you view and manage tags associated with the device.
Link details
Click on a link between devices to explore connection details including traffic volume, bandwidth utilization, errors, and discards, with options to view the data in Device Overview or NetFlow Monitoring.
Icon legend
SNMP devices are matched to a representative icon based on their device type in each device node, as defined in their device profiles.
| Icon | Description |
|---|---|
| Access Point | |
| Firewall | |
| Router | |
| Server | |
| Switch | |
| Device |
Troubleshooting
If you experience issues using the Network Topology Map, use the following troubleshooting guidelines. If you need further assistance, contact Datadog support.
Empty map message
There are no devices because NDM is not configured.
No connections found / No connected devices to show
- Turn the Unmonitored Device selection on to show the unmonitored devices.
- Use categorization tag to help understand your map view with information hierarchy.
Missing devices/connections
The Device Topology Map data is based on LLDP (Link Layer Discovery Protocol) and CDP (Cisco Discovery Protocol) information collected with SNMP. If your map is missing devices and/or connections, verify the following:
- Datadog Agent version 7.52 or later is installed.
- Devices have LLDP and/or CDP enabled with SNMP.
Verify that your devices are exposing LLDP and CDP data with the following commands:
For LLDP data:
sudo -u dd-agent datadog-agent snmp walk <DEVICE_IP> 1.0.8802
For CDP data
sudo -u dd-agent datadog-agent snmp walk <DEVICE_IP> 1.3.6.1.4.1.9.9.23
Missing connections or links
If your device is exposing topology data with LLDP or CDP but some of the connections are missing, verify that the Unmonitored Device selection is off.
Unmonitored devices showing on map
The Device Topology Map shows all devices discovered with LLDP or CDP. These can be new devices that are not already monitored with SNMP or existing devices that were not resolved to the equivalent monitored device. You can use the Unmonitored Device selection to hide these nodes.
Device duplicated on map
The Device Topology Map shows all devices discovered with LLDP and/or CDP. In some cases, these devices are already monitored with SNMP but can not be resolved to the equivalent monitored device. In this case, the device is shown twice: one node representing the monitored device and one node representing the LLDP/CDP discovered device. Use the Unmonitored Device selection to hide the unmonitored nodes.
Borderless or black nodes on the map
The borderless or black nodes on the Device Topology Map can represent devices discovered with LLDP or CDP that are not configured to be monitored with NDM, or devices discovered with LLDP or CDP that can not be resolved to the equivalent monitored device.
Device resolution
The Device Topology Map provides an overview of the devices monitored with NDM and their physical connections. The topology links data is based on LLDP (Link Layer Discovery Protocol) or CDP (Cisco Discovery Protocol) information collected with SNMP. The connections discovered with LLDP or CDP can correspond to devices already monitored with SNMP. The device resolution consists in matching the discovered device to the monitored device.
Device resolution failures
The device resolution can fail if the device is not monitored with NDM, or the LLDP or CDP data is insufficient to match the discovered device to the monitored device.
Next steps
NDM provides multiple visualization tools to monitor your infrastructure:
- Device Geomap: View the geographic distribution of devices across locations to identify regional issues and coverage gaps.
- Device Overview: Access detailed metrics and performance data for individual devices.
- NetFlow Monitoring: Analyze traffic flows and bandwidth utilization across your network.
Further Reading
Additional helpful documentation, links, and articles:


