- Essentials
- Getting Started
- Agent
- API
- APM Tracing
- Containers
- Dashboards
- Database Monitoring
- Datadog
- Datadog Site
- DevSecOps
- Incident Management
- Integrations
- Internal Developer Portal
- Logs
- Monitors
- Notebooks
- OpenTelemetry
- Profiler
- Search
- Session Replay
- Security
- Serverless for AWS Lambda
- Software Delivery
- Synthetic Monitoring and Testing
- Tags
- Workflow Automation
- Learning Center
- Support
- Glossary
- Standard Attributes
- Guides
- Agent
- Integrations
- Developers
- Authorization
- DogStatsD
- Custom Checks
- Integrations
- Build an Integration with Datadog
- Create an Agent-based Integration
- Create an API-based Integration
- Create a Log Pipeline
- Integration Assets Reference
- Build a Marketplace Offering
- Create an Integration Dashboard
- Create a Monitor Template
- Create a Cloud SIEM Detection Rule
- Install Agent Integration Developer Tool
- Service Checks
- IDE Plugins
- Community
- Guides
- OpenTelemetry
- Administrator's Guide
- API
- Partners
- Datadog Mobile App
- DDSQL Reference
- CoScreen
- CoTerm
- Remote Configuration
- Cloudcraft (Standalone)
- In The App
- Dashboards
- Notebooks
- DDSQL Editor
- Reference Tables
- Sheets
- Monitors and Alerting
- Service Level Objectives
- Metrics
- Watchdog
- Bits AI
- Internal Developer Portal
- Error Tracking
- Change Tracking
- Event Management
- Incident Response
- Actions & Remediations
- Infrastructure
- Cloudcraft
- Resource Catalog
- Universal Service Monitoring
- End User Device Monitoring
- Hosts
- Containers
- Processes
- Serverless
- Network Monitoring
- Storage Management
- Cloud Cost
- Application Performance
- APM
- Continuous Profiler
- Database Monitoring
- Agent Integration Overhead
- Setup Architectures
- Setting Up Postgres
- Setting Up MySQL
- Setting Up SQL Server
- Setting Up Oracle
- Setting Up Amazon DocumentDB
- Setting Up MongoDB
- Connecting DBM and Traces
- Data Collected
- Exploring Database Hosts
- Exploring Query Metrics
- Exploring Query Samples
- Exploring Database Schemas
- Exploring Recommendations
- Troubleshooting
- Guides
- Data Streams Monitoring
- Data Observability
- Digital Experience
- Real User Monitoring
- Synthetic Testing and Monitoring
- Continuous Testing
- Product Analytics
- Session Replay
- Software Delivery
- CI Visibility
- CD Visibility
- Deployment Gates
- Test Optimization
- Code Coverage
- PR Gates
- DORA Metrics
- Feature Flags
- Security
- Security Overview
- Cloud SIEM
- Code Security
- Cloud Security
- App and API Protection
- AI Guard
- Workload Protection
- Sensitive Data Scanner
- AI Observability
- Log Management
- Observability Pipelines
- Configuration
- Sources
- Processors
- Destinations
- Packs
- Akamai CDN
- Amazon CloudFront
- Amazon VPC Flow Logs
- AWS Application Load Balancer Logs
- AWS CloudTrail
- AWS Elastic Load Balancer Logs
- AWS Network Load Balancer Logs
- Cisco ASA
- Cloudflare
- F5
- Fastly
- Fortinet Firewall
- HAProxy Ingress
- Istio Proxy
- Juniper SRX Firewall Traffic Logs
- Netskope
- NGINX
- Okta
- Palo Alto Firewall
- Windows XML
- ZScaler ZIA DNS
- Zscaler ZIA Firewall
- Zscaler ZIA Tunnel
- Zscaler ZIA Web Logs
- Search Syntax
- Scaling and Performance
- Monitoring and Troubleshooting
- Guides and Resources
- Log Management
- CloudPrem
- Administration
Monitor-based SLOs
Overview
To build an SLO from new or existing Datadog monitors, create a monitor-based SLO. Using a monitor-based SLO, you can calculate the Service Level Indicator (SLI) by dividing the amount of time your system exhibits good behavior by the total time.
Time Slice SLOs are another way to create SLOs with a time-based SLI calculation. With Time Slice SLOs, you can create an uptime SLO without going through a monitor, so you don’t have to create and maintain both a monitor and an SLO.
Prerequisites
To create a monitor-based SLO, you need an existing Datadog monitor. To set up a new monitor, go to the monitor creation page.
Datadog monitor-based SLOs support the following monitor types:
- Metric Monitor Types (Metric, Integration, APM Metric, Anomaly, Forecast, Outlier)
- Synthetic
- Service Checks
Setup
On the SLO status page, click + New SLO. Then, select By Monitor Uptime.
Define queries
In the search box, start typing the name of a monitor. A list of matching monitors appears. Click on a monitor name to add it to the source list.
Notes:
- If you’re using a single multi alert monitor in an SLO, you can optionally select “Calculate on selected groups” and pick up to 20 groups.
- If you’re adding multiple monitors to your SLO, group selection is not supported. You can add up to 20 monitors.
Set your SLO targets
Select a target percentage, time window, and optional warning level.
The target percentage specifies the portion of time the underlying monitor(s) of the SLO should not be in the ALERT state. The time window specifies the rolling period the SLO runs its calculation.
Depending on the value of the SLI, the Datadog UI displays the SLO status in a different color:
- While the SLI remains above the target, the UI displays the SLO status in green.
- When the SLI falls below the target, the UI displays the SLO status in red.
- If you included a warning level, and the SLI falls below the warning, but above the target level, the UI displays the SLO status in yellow.
The time window you choose changes the available precision for your monitor-based SLOs:
- 7-day and 30-day time windows allow up to two decimal places.
- 90-day time windows allow up to three decimal places.
In the details UI for the SLO, Datadog displays two decimal places for SLOs configured with 7-day and 30-day time windows and three decimal places for SLOs configured with 90-day time windows.
The following example demonstrates why Datadog displays a limited number of decimal places for SLO calculations. A 99.999% target for a 7-day or 30-day time window results in an error budget of 6 seconds or 26 seconds, respectively. Monitors evaluate every minute, so the granularity of a monitor-based SLO is also 1 minute. Therefore, one alert would fully consume and overspend the 6 second or 26 second error budget in the previous example. In practice, teams cannot satisfy such small error budgets.
If you need finer granularity than the once a minute monitor evaluation, consider using metric-based SLOs instead.
Add name and tags
Choose a name and extended description for your SLO. Select any tags you would like to associate with your SLO. Select Create or Create & Set Alert to save your new SLO.
Status calculation
Datadog calculates the overall SLO status as the uptime percentage across all monitors or monitor groups, unless specific groups have been selected:
- If specific groups have been selected (up to 20), the SLO status is calculated with only those groups. The UI displays all selected groups.
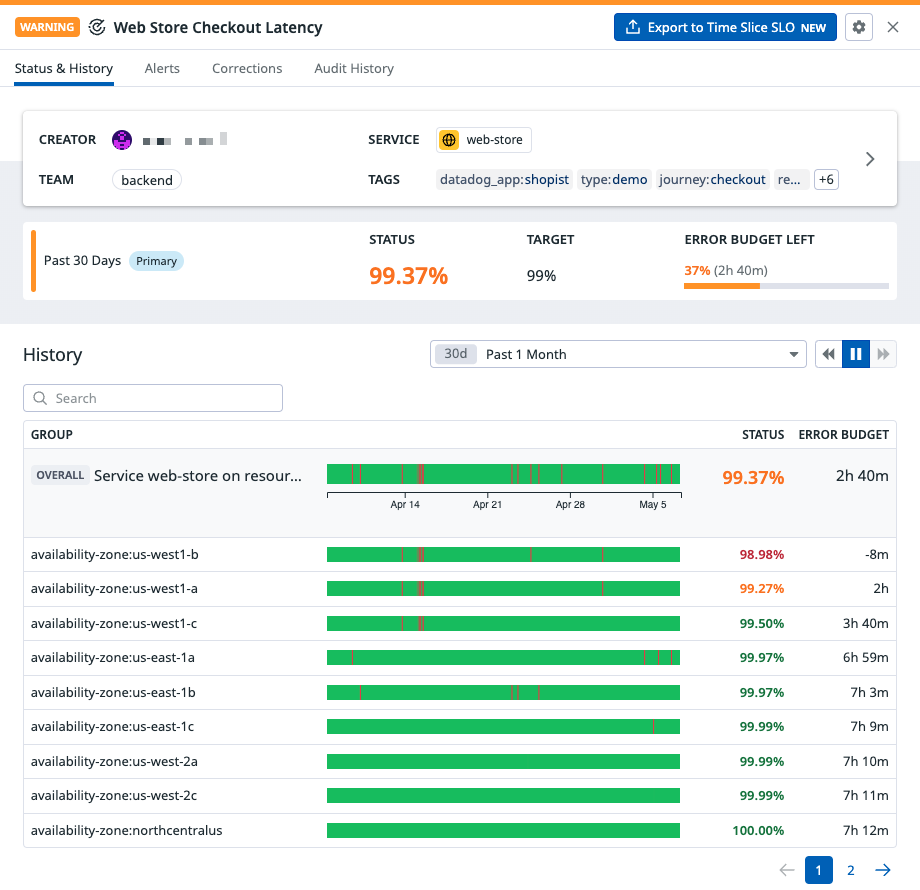
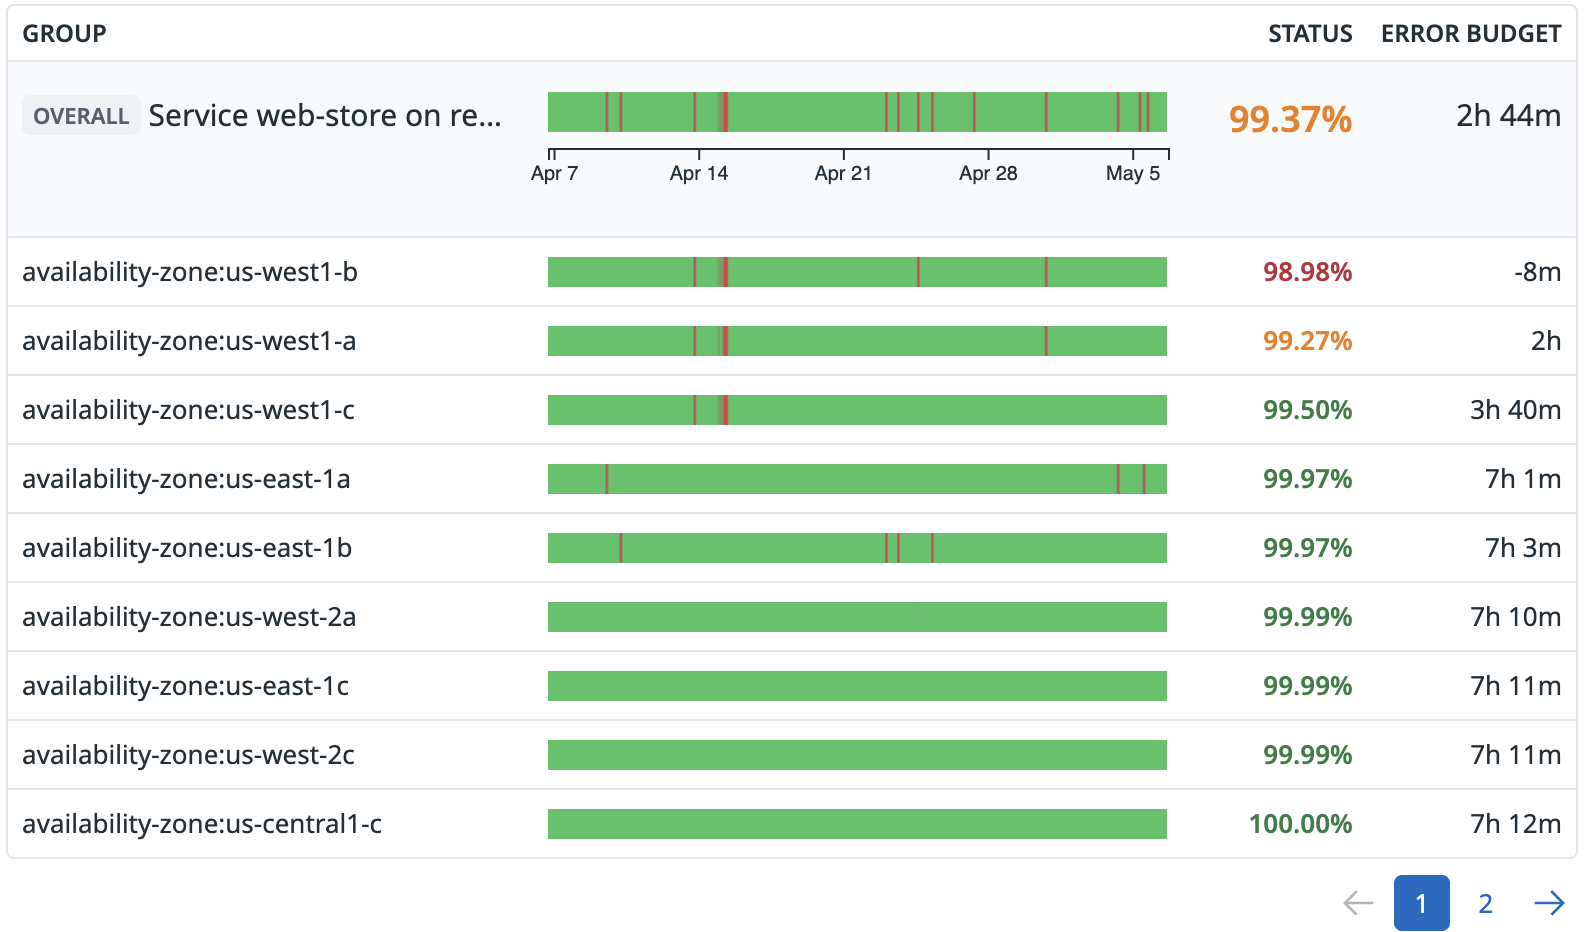
- If no specific groups are selected, the SLO status is calculated across all groups. The UI displays all underlying groups of the SLO.
Note: For monitor-based SLOs with groups, all groups can be displayed for any SLOs containing up to 5,000 groups. For SLOs containing more than 5,000 groups, the SLO is calculated based on all groups but no groups are displayed in the UI.
Monitor-based SLOs treat the WARN state as OK. The definition of an SLO requires a binary distinction between good and bad behavior. SLO calculations treat WARN as good behavior since WARN is not severe enough to indicate bad behavior.
Consider the following example for a monitor-based SLO containing 3 monitors. The calculation for a monitor-based SLO based on a single multi alert monitor would look similar.
| Monitor | t1 | t2 | t3 | t4 | t5 | t6 | t7 | t8 | t9 | t10 | Status |
|---|---|---|---|---|---|---|---|---|---|---|---|
| Monitor 1 | OK | OK | OK | OK | ALERT | OK | OK | OK | OK | OK | 90% |
| Monitor 2 | OK | OK | OK | OK | OK | OK | OK | OK | ALERT | OK | 90% |
| Monitor 3 | OK | OK | ALERT | OK | ALERT | OK | OK | OK | OK | OK | 80% |
| Overall Status | OK | OK | ALERT | OK | ALERT | OK | OK | OK | ALERT | OK | 70% |
In this example, the overall status is lower than the average of the individual statuses.
Muting a monitor does not affect the SLO calculation. To exclude time periods from an SLO calculation, use the SLO status corrections feature.
Exceptions for synthetic tests
In certain cases, there is an exception to the status calculation for monitor-based SLOs that are comprised of one grouped Synthetic test. Synthetic tests have optional special alerting conditions that change the behavior of when the test enters the ALERT state and consequently impact the overall uptime:
- Wait until the groups are failing for a specified number of minutes (default: 0)
- Wait until a specified number of the groups are failing (default: 1)
- Retry a specified number of times before a location’s test is considered a failure (default: 0)
If you change any of these conditions to something other than their defaults, the overall status for a monitor-based SLO using one Synthetic test could appear better than the aggregated statuses of the Synthetic test’s individual groups.
For more information on Synthetic test alerting conditions, see Synthetic Monitoring.
Missing data
Metric monitors
When you create a metric monitor, you choose how the monitor will handle missing data. This configuration affects how a monitor-based SLO calculation interprets missing data:
| Monitor configuration | SLO calculation of missing data |
|---|---|
Evaluate as zero | Depends on the monitor alert threshold For instance, a threshold of > 10 would result in Uptime (since the Monitor status would be OK), while a threshold of < 10 would result in Downtime. |
Show last known status | Keep last state of SLO |
Show NO DATA | Uptime |
Show NO DATA and notify | Downtime |
Show OK | Uptime |
Other monitor types
When you create a service check monitor, you choose whether it sends an alert when data is missing. This configuration affects how a monitor-based SLO calculation interprets missing data. For monitors configured to ignore missing data, time periods with missing data are treated as OK (uptime) by the SLO. For monitors configured to alert on missing data, time periods with missing data are treated as ALERT (downtime) by the SLO.
If you pause a Synthetic test, the SLO removes the time period with missing data from its calculation. In the UI, these time periods are marked light gray on the SLO status bar.
Further Reading
Additional helpful documentation, links, and articles:


