Overview
Service check monitors include any service check not reported by one of the more than 850 integrations included with the Agent. Service checks can be sent to Datadog using a custom Agent check, DogStatsD, or the API. For more information, see the Service Check Overview.
Monitor creation
To create a service check monitor in Datadog, use the main navigation: Monitors –> New Monitor –> Service Check.
Pick a service check
Choose a service check from the dropdown menu.
Pick monitor scope
Select the scope to monitor by choosing host names, tags, or choose All Monitored Hosts. If you need to exclude certain hosts, use the second field to list names or tags.
- The include field uses
AND logic. All listed hostnames and tags must be present on a host for it to be included. - The exclude field uses
OR logic. Any host with a listed hostname or tag is excluded.
Set alert conditions
In this section, choose between a Check Alert or Cluster Alert:
A check alert tracks consecutive statuses submitted per check grouping and compares it to your thresholds.
Set up the check alert:
Trigger a separate alert for each <GROUP> reporting your check.
- Check grouping is specified either from a list of known groupings or by you. For service check monitors, the per-check grouping is unknown, so you must specify it.
Trigger the alert after selected consecutive failures: <NUMBER>
- Choose how many consecutive runs with the
CRITICAL status trigger a notification. For example, to be notified immediately when your check fails, trigger the monitor alert on 1 critical status.
Select Do not notify or Notify for Unknown status.
- If
Notify is selected, a state transition to UNKNOWN triggers a notification. In the monitor status page, the status bar of a group in UNKNOWN state uses NODATA grey. The overall status of the monitor stays in OK.
Resolve the alert after selected consecutive successes: <NUMBER>.
- Choose how many consecutive runs with the
OK status resolve the alert. For example, to ensure an issue is fixed, resolve the monitor on 4 OK statuses.
A cluster alert calculates the percent of checks in a given status and compares it to your thresholds.
Each check tagged with a distinct combination of tags is considered to be a distinct check in the cluster. Only the status of the last check of each combination of tags is taken into account in the cluster percentage calculation.
For example, a cluster check monitor grouped by environment can alert if more that 70% of the checks on any of the environments submit a CRITICAL status, and warn if more that 70% of the checks on any of the environments submit a WARN status.
To set up a cluster alert:
Decide whether or not to group your checks according to a tag. Ungrouped calculates the status percentage across all sources. Grouped calculates the status percentage on a per-group basis.
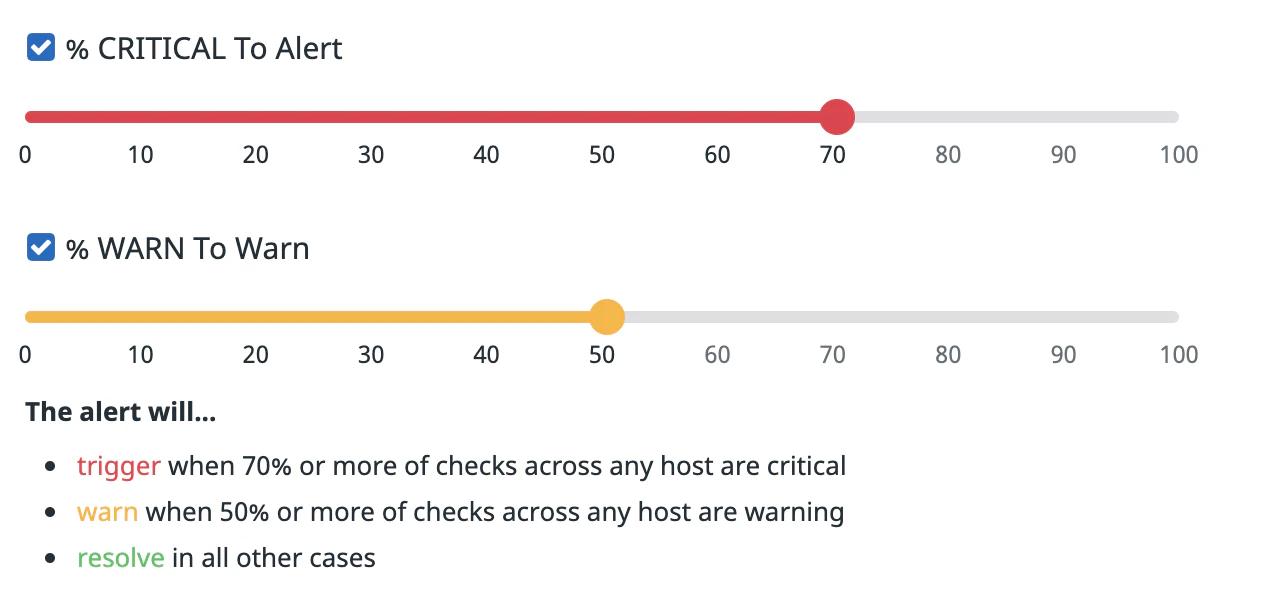
Select the percentage for alert and warn thresholds. Only one setting (alert or warn) is required.
Advanced alert conditions
See the Monitor configuration documentation for information on No data, Auto resolve, and New group delay options.
Notifications
For detailed instructions on the Configure notifications and automations section, see the Notifications page.
Further Reading
Additional helpful documentation, links, and articles: