- Essentials
- Getting Started
- Agent
- API
- APM Tracing
- Containers
- Dashboards
- Database Monitoring
- Datadog
- Datadog Site
- DevSecOps
- Incident Management
- Integrations
- Internal Developer Portal
- Logs
- Monitors
- Notebooks
- OpenTelemetry
- Profiler
- Search
- Session Replay
- Security
- Serverless for AWS Lambda
- Software Delivery
- Synthetic Monitoring and Testing
- Tags
- Workflow Automation
- Learning Center
- Support
- Glossary
- Standard Attributes
- Guides
- Agent
- Integrations
- Developers
- Authorization
- DogStatsD
- Custom Checks
- Integrations
- Build an Integration with Datadog
- Create an Agent-based Integration
- Create an API-based Integration
- Create a Log Pipeline
- Integration Assets Reference
- Build a Marketplace Offering
- Create an Integration Dashboard
- Create a Monitor Template
- Create a Cloud SIEM Detection Rule
- Install Agent Integration Developer Tool
- Service Checks
- IDE Plugins
- Community
- Guides
- OpenTelemetry
- Administrator's Guide
- API
- Partners
- Datadog Mobile App
- DDSQL Reference
- CoScreen
- CoTerm
- Remote Configuration
- Cloudcraft (Standalone)
- In The App
- Dashboards
- Notebooks
- DDSQL Editor
- Reference Tables
- Sheets
- Monitors and Alerting
- Service Level Objectives
- Metrics
- Watchdog
- Bits AI
- Internal Developer Portal
- Error Tracking
- Change Tracking
- Event Management
- Incident Response
- Actions & Remediations
- Infrastructure
- Cloudcraft
- Resource Catalog
- Universal Service Monitoring
- End User Device Monitoring
- Hosts
- Containers
- Processes
- Serverless
- Network Monitoring
- Storage Management
- Cloud Cost
- Application Performance
- APM
- Continuous Profiler
- Database Monitoring
- Agent Integration Overhead
- Setup Architectures
- Setting Up Postgres
- Setting Up MySQL
- Setting Up SQL Server
- Setting Up Oracle
- Setting Up Amazon DocumentDB
- Setting Up MongoDB
- Connecting DBM and Traces
- Data Collected
- Exploring Database Hosts
- Exploring Query Metrics
- Exploring Query Samples
- Exploring Database Schemas
- Exploring Recommendations
- Troubleshooting
- Guides
- Data Streams Monitoring
- Data Observability
- Digital Experience
- Real User Monitoring
- Synthetic Testing and Monitoring
- Continuous Testing
- Product Analytics
- Session Replay
- Software Delivery
- CI Visibility
- CD Visibility
- Deployment Gates
- Test Optimization
- Code Coverage
- PR Gates
- DORA Metrics
- Feature Flags
- Security
- Security Overview
- Cloud SIEM
- Code Security
- Cloud Security
- App and API Protection
- AI Guard
- Workload Protection
- Sensitive Data Scanner
- AI Observability
- Log Management
- Observability Pipelines
- Configuration
- Sources
- Processors
- Destinations
- Packs
- Akamai CDN
- Amazon CloudFront
- Amazon VPC Flow Logs
- AWS Application Load Balancer Logs
- AWS CloudTrail
- AWS Elastic Load Balancer Logs
- AWS Network Load Balancer Logs
- Cisco ASA
- Cloudflare
- F5
- Fastly
- Fortinet Firewall
- HAProxy Ingress
- Istio Proxy
- Juniper SRX Firewall Traffic Logs
- Netskope
- NGINX
- Okta
- Palo Alto Firewall
- Windows XML
- ZScaler ZIA DNS
- Zscaler ZIA Firewall
- Zscaler ZIA Tunnel
- Zscaler ZIA Web Logs
- Search Syntax
- Scaling and Performance
- Monitoring and Troubleshooting
- Guides and Resources
- Log Management
- CloudPrem
- Administration
Volume
Overview
Cloud-based applications generate massive amounts of data, which can be overwhelming for your organization as it scales. Observability costs become a significant budget item but core observability teams lack visibility into what is truly valuable to each individual engineering team. Individual teams are less incentivized to be proactive in helping manage this growth because they have limited insights into the costs of the metrics and tags they’re submitting.
Datadog’s Metrics Volume Management page provides comprehensive visibility and intelligent insights for which metrics you should focus your cost-optimization efforts. When used with Metrics without Limits™, Metrics Volume allows for flexible configuration of metrics ingestion and indexing to reduce costs without sacrificing accuracy.
With the Metrics Volume Management page you can access the following in real-time:
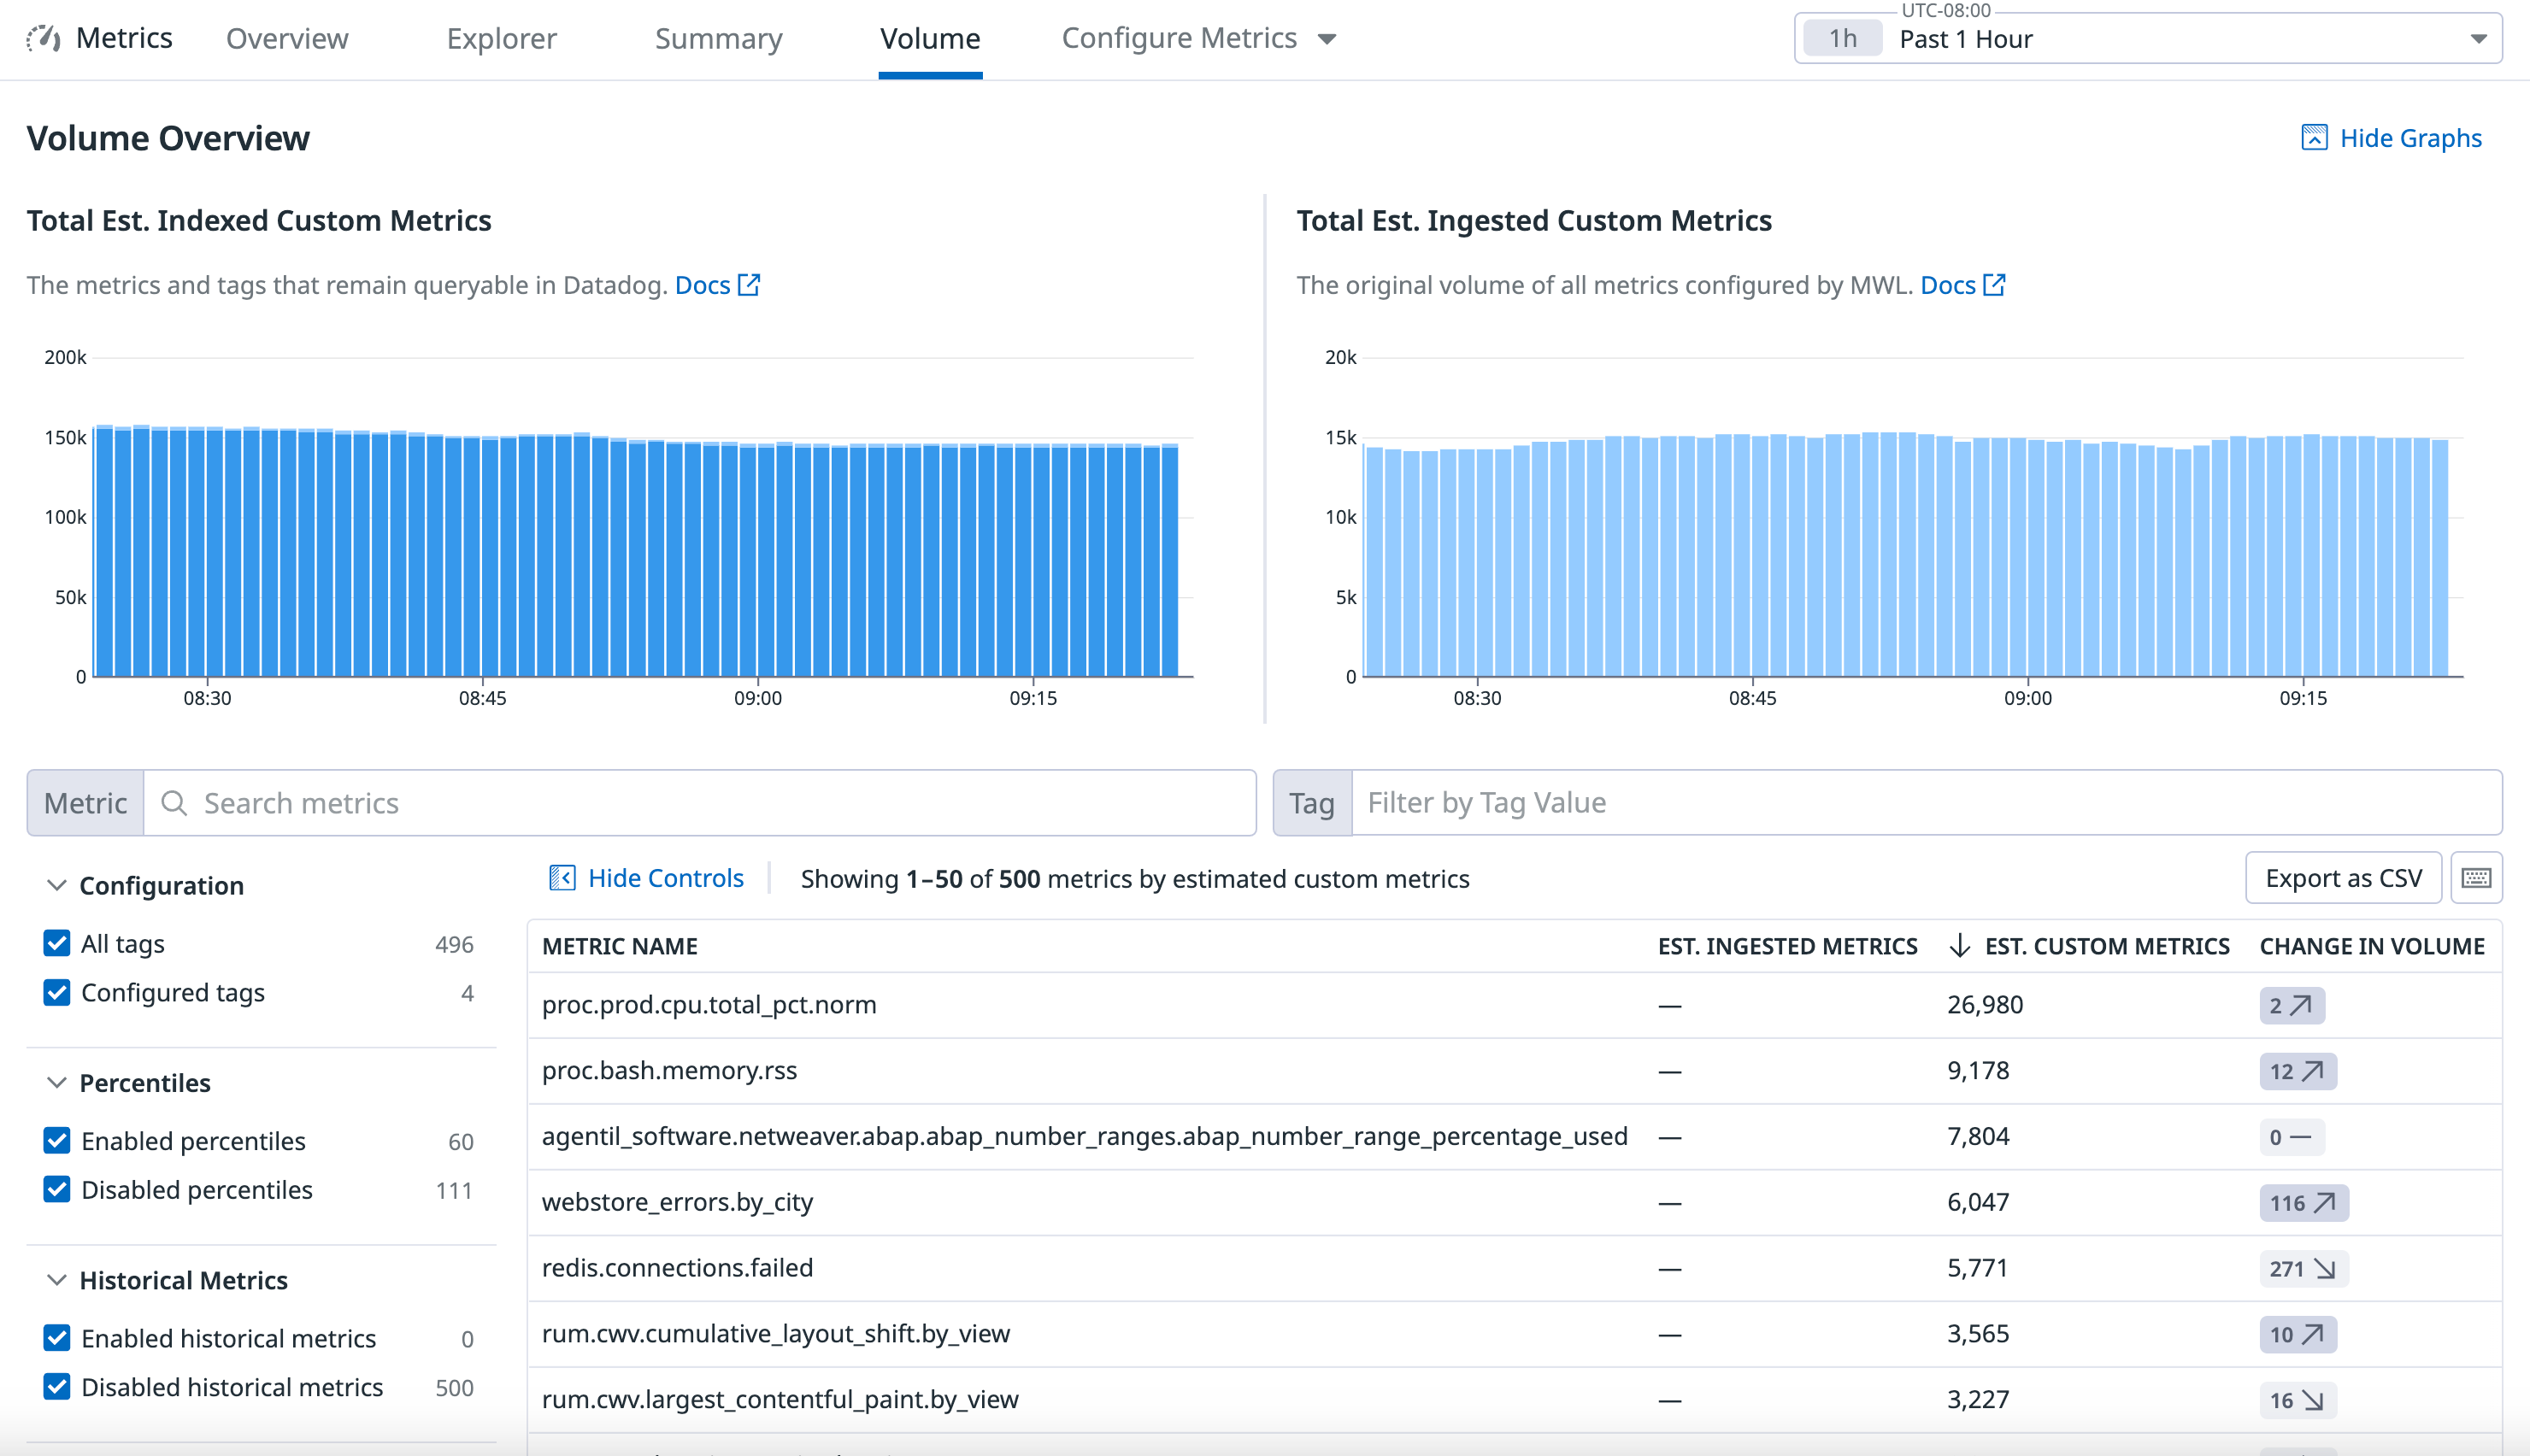
- What is my overall account’s realtime estimated Indexed Custom Metrics usage?
- What is my overall account’s realtime estimated Ingested Custom Metrics usage?
- What are the Top 500 largest Metrics without Limits configured metric names by Ingested Custom Metrics volume?
- What are the Top 500 largest metric names by Indexed Custom Metrics volume?
- What are the Top 500 spiking cardinality metric names?
- Which team owns these Top 500 metric names and is responsible for optimizing?
- Which metrics are actually valuable (or not) to my organization?
Real-time visibility and monitoring on your organization’s Custom Metrics usage
Datadog provides you real-time estimated usage metrics OOTB so you can understand and alert on your usage in real-time. You can see a breakdown of:
- Your account’s indexed custom metrics volume in real-time (and how much of that indexed volume hasn’t been optimized with Metrics without Limits™ yet)
- Your account’s ingested custom metrics (emitted from metrics that have been configured with Metrics without Limits™) in real-time
Search, filter, and sort
Use the search, filter, and sort features to understand:
- Which team owns what metric names?
- Which metric names your team should focus on optimizing?
- Which metrics have the highest cardinality, and which metric names are spiking (have the highest increase in volume)?
- Which top metrics aren’t being queried on assets?
The Metric and Tag search bars provide a set of actions to filter the list of metrics. Enter keywords to search metric names. Type in any tag key value pair in the Filter by Tag Value box to filter the list by a specific team, application, or service.
Facets can also filter your metrics by:
- Configuration: Metrics with tag configurations
- Percentiles: Distribution metrics enabled by percentiles/advanced query capabilities
- Historical Metrics: Metrics that have historical metrics ingestion enabled
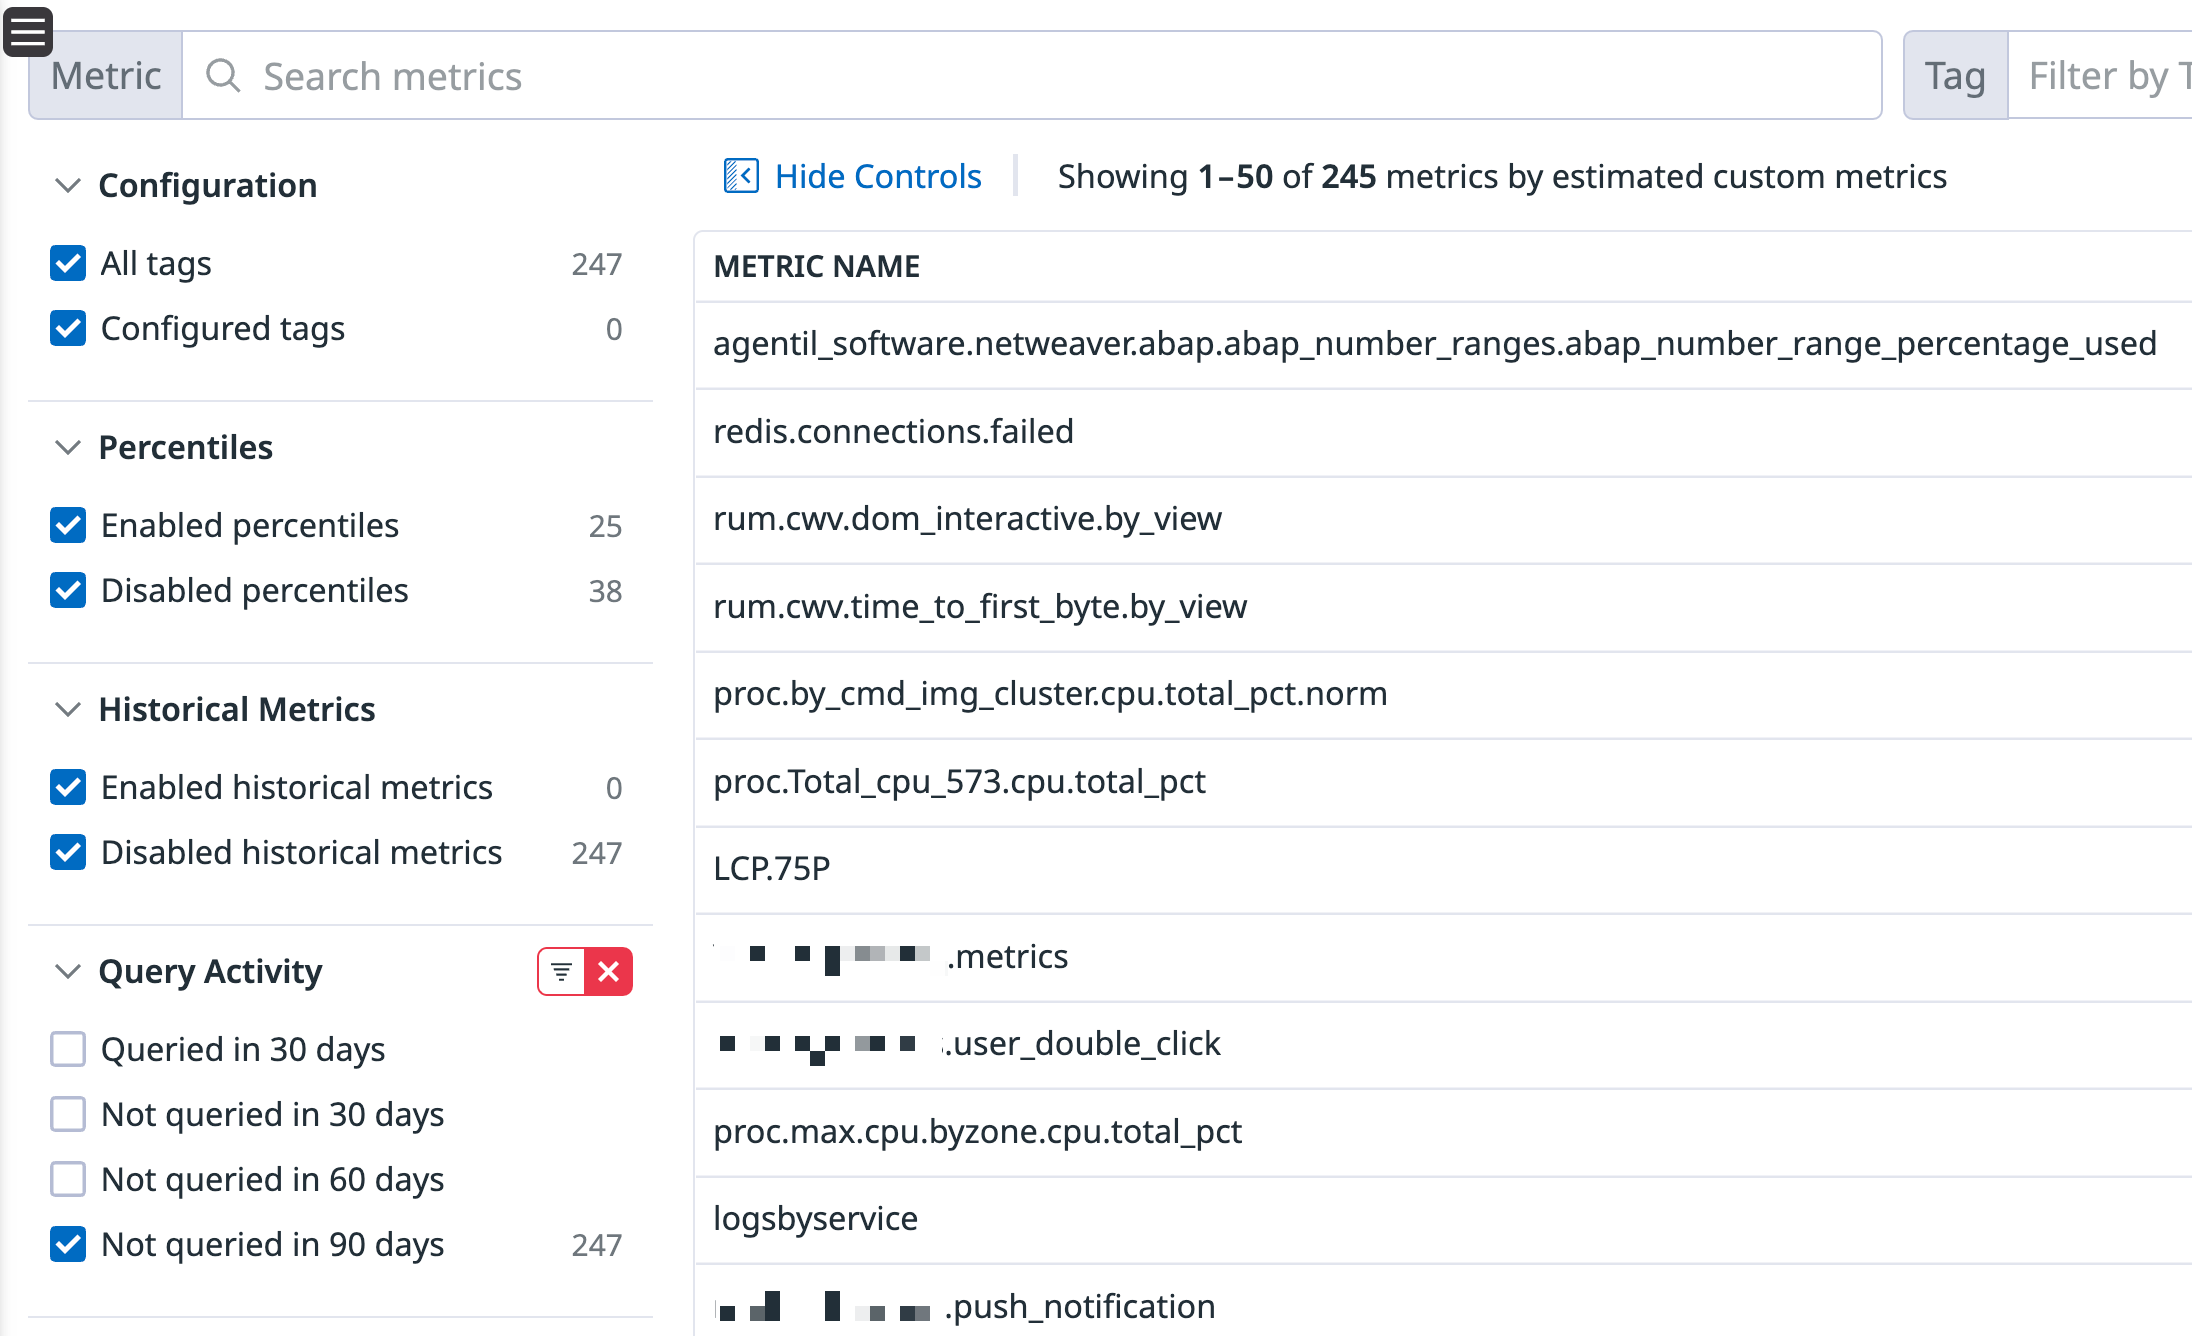
- Query Activity: Metrics not actively queried in Datadog or by the API in the past 30, 60, or 90 days
- Metric Type: Differentiate between distribution and non-distribution metrics (counts, gauges, rates)
- Distribution Metric Origin: The product from which the metric originated (for example, metrics generated from Logs or APM Spans)
The Volume page displays a list of your metrics reported to Datadog sorted by estimated custom metrics or by the change in volume. To sort metrics by either of these options, click on the column header of the metric table.
| Column | Description |
|---|---|
| Top 500 Metric Names by Estimated Real-time Cardinality | Identify the top 500 metric names by cardinality (aka custom metrics volume). |
| Top 500 Metric Names by Change in Volume | Discover the top 500 metric names that have the greatest variance in their cardinality. These metrics may have anomalously (potentially unintentionally) spiked in the time frame of your choosing. If you receive an alert on your account’s estimated real-time custom metrics usage, you can use this view to investigate the metric spike. |
Compare a metric’s cardinality (volume) over time
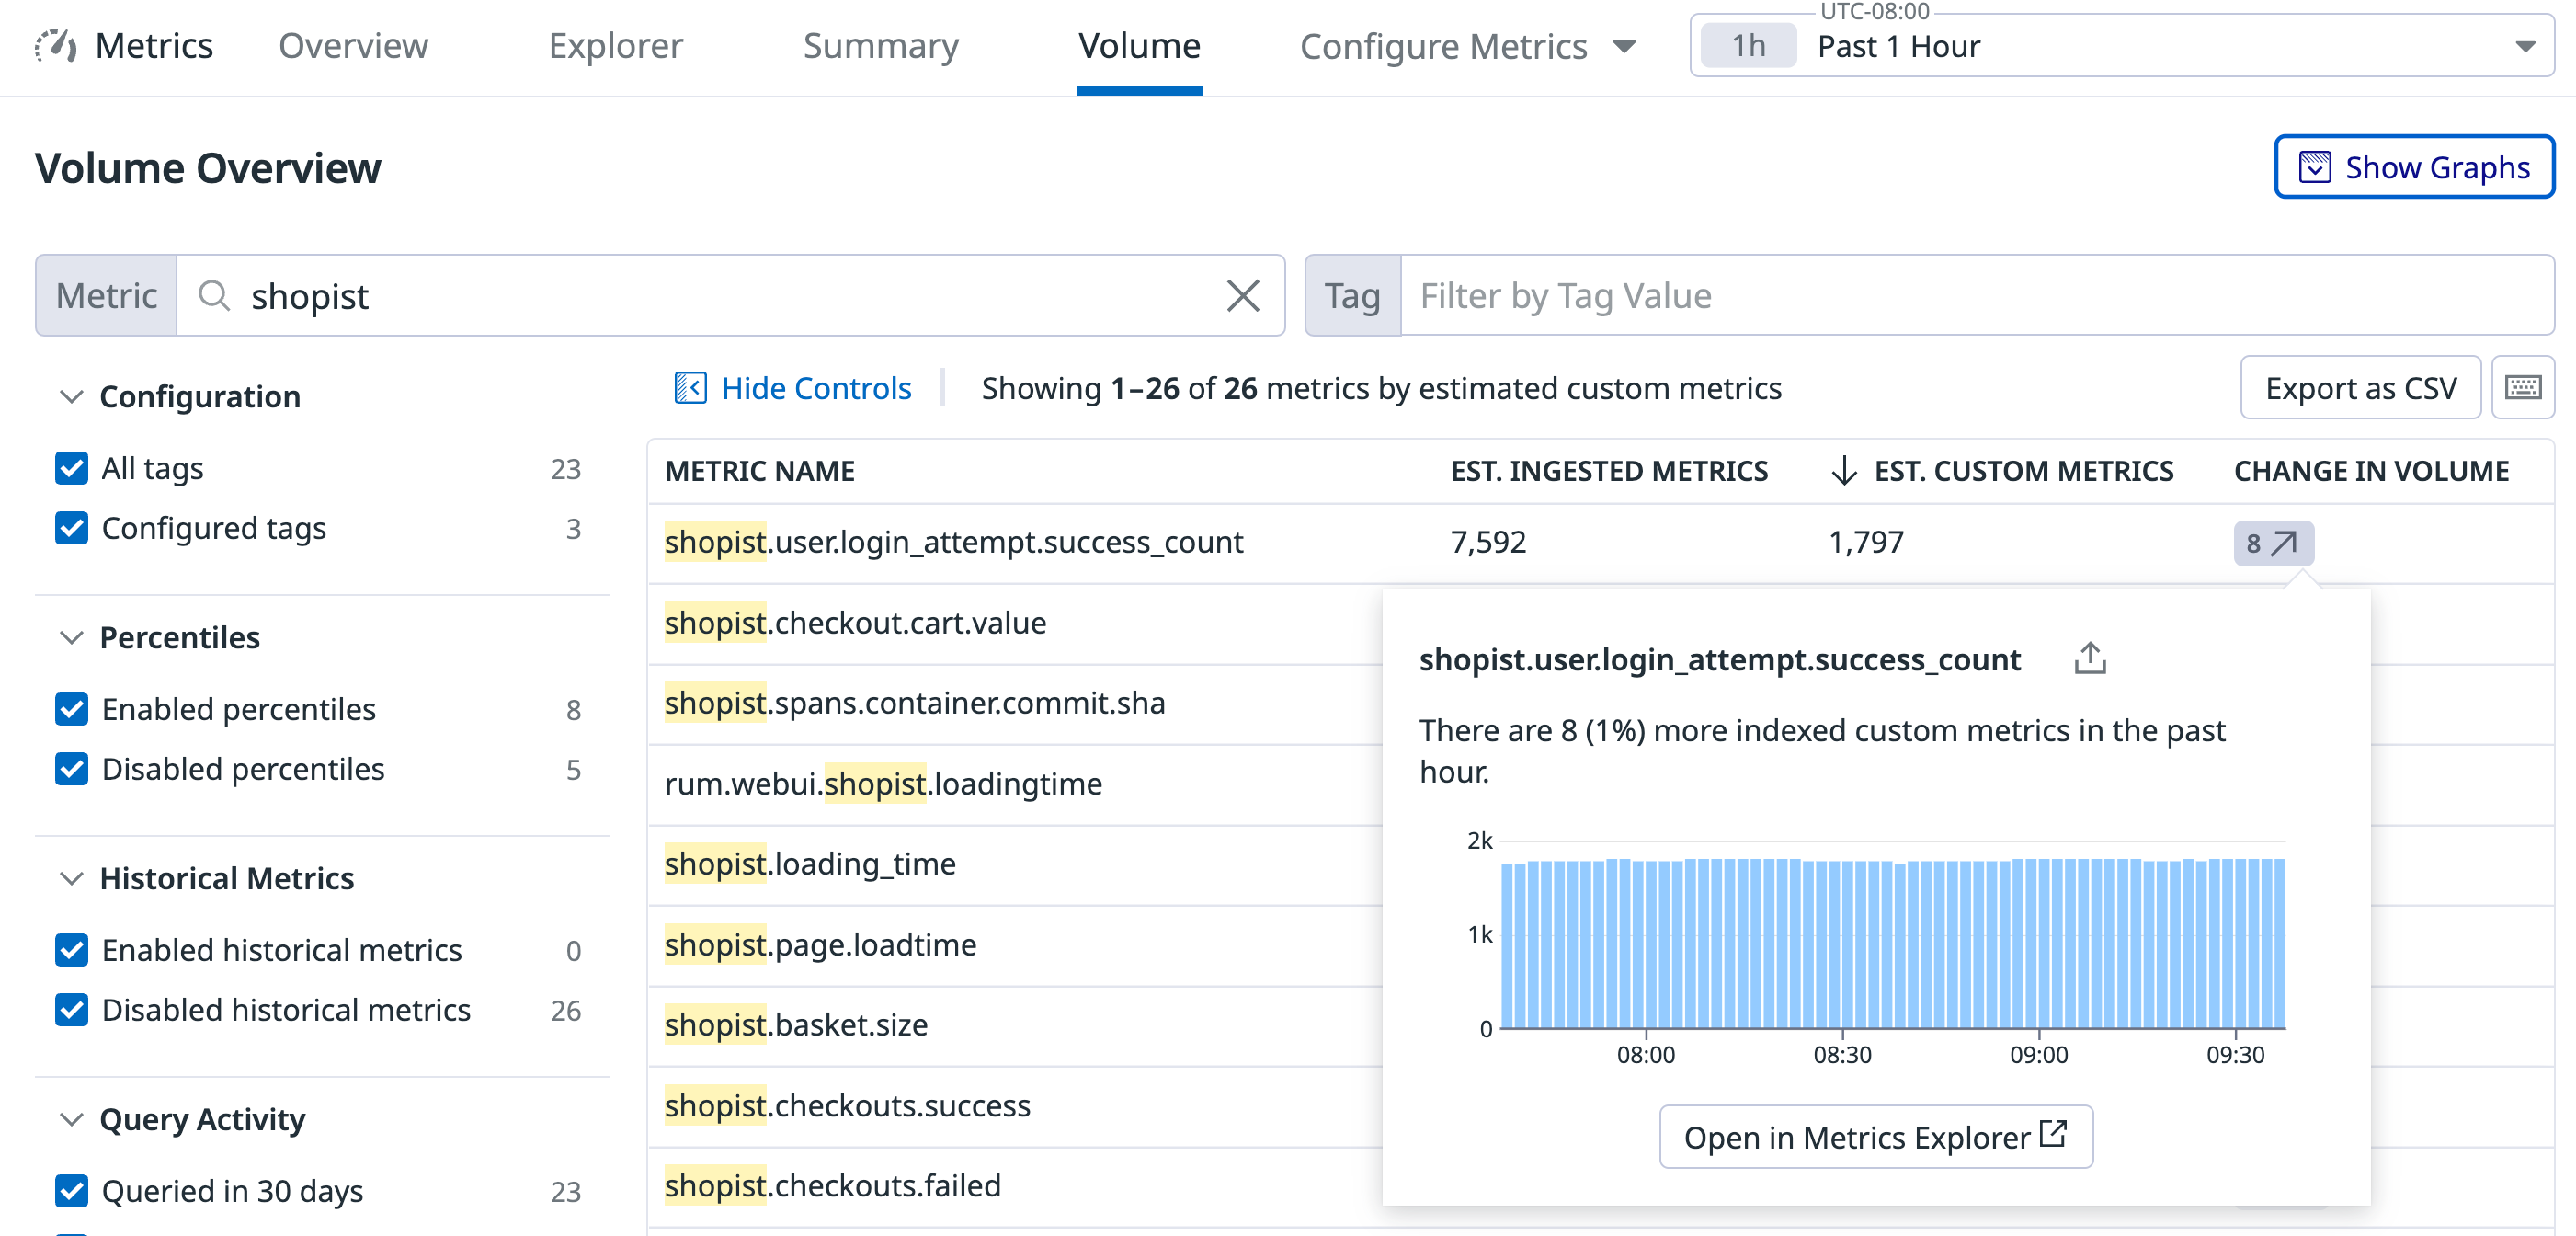
When identifying the top 500 metric names by change in volume, you can hover over the number to compare a metric name’s number of indexed custom metrics (its cardinality) over time. As a reminder, a single metric name can emit multiple indexed custom metrics. To learn more, see Custom Metrics Billing.
To compare your spiking metric’s cardinality over time:
- Select a time frame in the top right hand corner (the recommended time frame is Past 1 Day or Past 4 Weeks).
- Select the metric name that you want to view the cardinality over time, and in the same row click on the value under the Change in Volume column. This opens up a modal showing a graph comparing your metric’s cardinality over time and the percentage increase in its spike.
- (Optional) Create a Change monitor for
% changeto alert on this spiking metric. For more information, see the Change Alert Monitor documentation.
Identify less valuable, unqueried metrics
To start reducing custom metrics costs, start with your largest metric names that aren’t actively queried. Datadog’s intelligent query insights analyze your queries and surfaces your unqueried metrics over the past 30, 60, or 90 days. This analysis is constantly running in the background ensuring that your unqueried metrics are always up-to-date.
To find the metrics not actively queried, click the time frame of interest in the Query Activity Facet box. The list is filtered to show only unused metric names across dashboards, notebooks, monitors, SLOs, Metrics Explorer, and the API.
How to reduce metric volume and cost
After you identify unqueried metrics, you can eliminate the volume and cost of these metric names by using Metrics without Limits™ without a single line of code. By using Metrics without Limits, you ensure that you pay only for the metrics that you use by eliminating timeseries that are never or rarely leveraged. Use Metrics without Limits™ on your unqueried metric names to reduce custom metrics volume.
To configure multiple unqueried metrics at once
- Click the Configure Metrics dropdown and select Manage Tags to open the Metrics without Limits™ Tag configuration modal.
- Specify the metric namespace of the unqueried metrics you’d like to apply a bulk tag configuration to.
- Select Include tags… and set an empty allowlist of tags.
You have full control over the cardinality of your metrics without the need to change your applications nor the requirement of a remote-write setup. Below is an example of how eliminating timeseries that are rarely used can significantly reduce your custom metrics volumes and costs.
In this example, the tag configuration modal shows a metric with a current volume of 7,139 indexed custom metrics. After you select Include tags… with an allowlist of the tags queried in the past 30 days, the modal shows an estimated new volume of 3. You can reduce the number of indexed custom metrics by 7,136.
Analyze metrics’ utility and relative value in Datadog
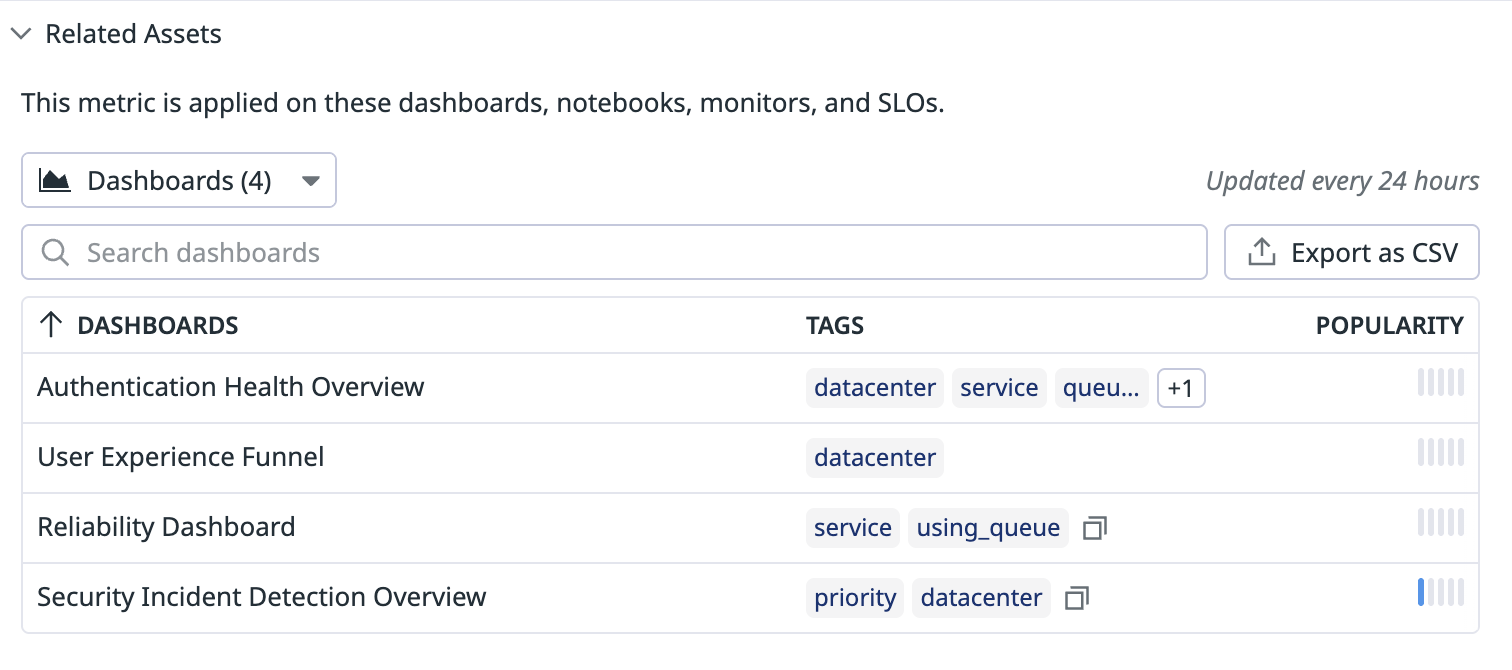
Metrics without Limits™ allows you to find metrics that are underused in Datadog with the Metrics Related Assets feature. A metrics related asset refers to any dashboard, notebook, monitor, or SLO that queries a particular metric. Datadog’s intelligent query insights surface the popularity and quantity of these related assets so you can evaluate metric utility within your organization. The Tags column shows exactly which tags are powering each asset, helping you preserve critical visibility while making data-driven decisions when configuring your metrics.
To view a metric’s related assets:
- Click on the metric name to open its details side panel.
- Scroll down to the section of the side panel titled Related Assets.
- Click the dropdown button to view the type of related asset you are interested in (dashboards, monitors, notebooks, SLOs). You can use the search bar to validate specific assets.
Identify tags driving up your metric’s volume
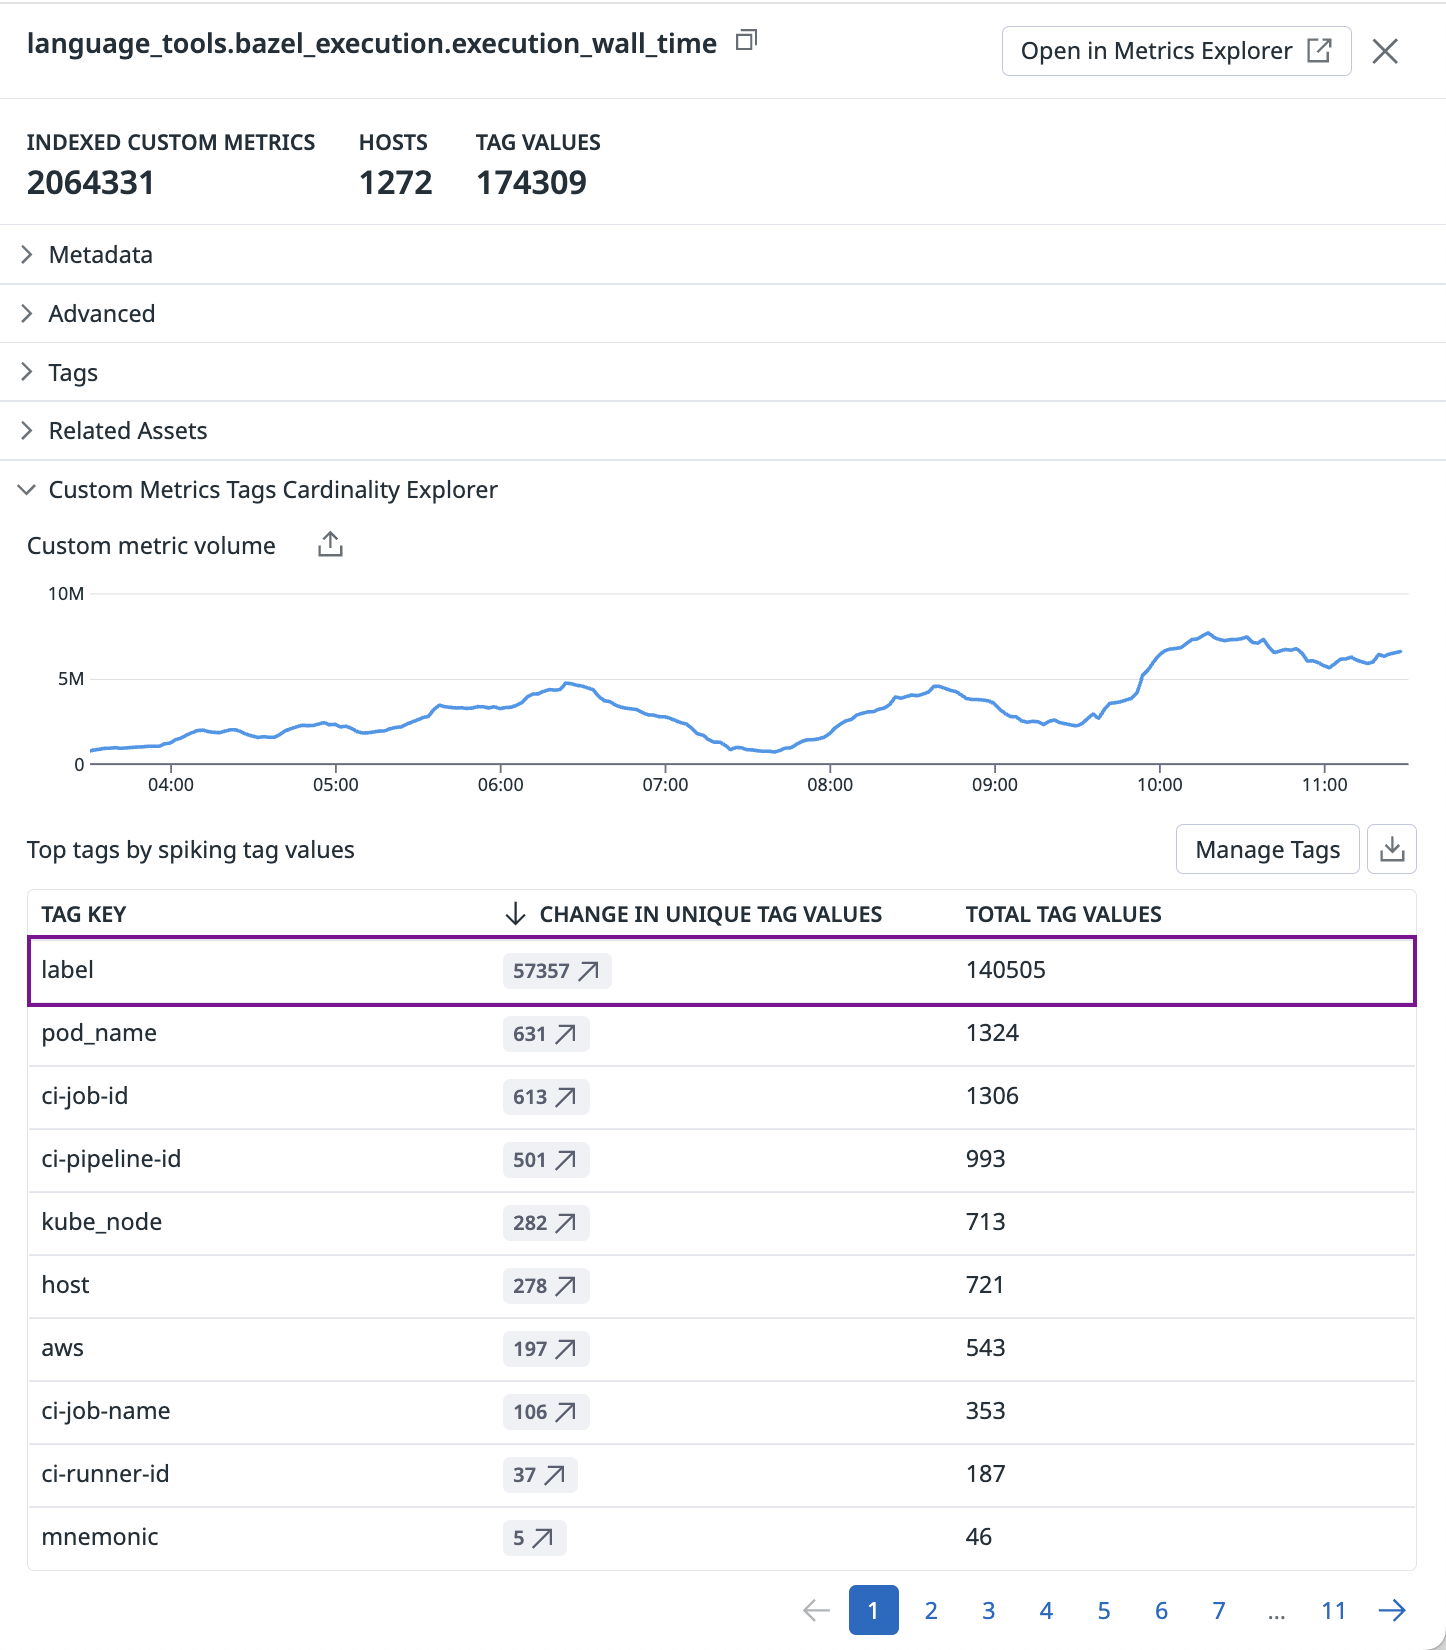
To determine why a particular metric name is emitting a large number of custom metrics, or spiking, use the Custom Metrics Tags Cardinality Explorer. This helps you pinpoint the tag keys driving the spike, which you can immediately exclude using Metrics without Limits™ for cost savings.
Further reading
Additional helpful documentation, links, and articles:
