- Essentials
- Getting Started
- Agent
- API
- APM Tracing
- Containers
- Dashboards
- Database Monitoring
- Datadog
- Datadog Site
- DevSecOps
- Incident Management
- Integrations
- Internal Developer Portal
- Logs
- Monitors
- Notebooks
- OpenTelemetry
- Profiler
- Search
- Session Replay
- Security
- Serverless for AWS Lambda
- Software Delivery
- Synthetic Monitoring and Testing
- Tags
- Workflow Automation
- Learning Center
- Support
- Glossary
- Standard Attributes
- Guides
- Agent
- Integrations
- Developers
- Authorization
- DogStatsD
- Custom Checks
- Integrations
- Build an Integration with Datadog
- Create an Agent-based Integration
- Create an API-based Integration
- Create a Log Pipeline
- Integration Assets Reference
- Build a Marketplace Offering
- Create an Integration Dashboard
- Create a Monitor Template
- Create a Cloud SIEM Detection Rule
- Install Agent Integration Developer Tool
- Service Checks
- IDE Plugins
- Community
- Guides
- OpenTelemetry
- Administrator's Guide
- API
- Partners
- Datadog Mobile App
- DDSQL Reference
- CoScreen
- CoTerm
- Remote Configuration
- Cloudcraft (Standalone)
- In The App
- Dashboards
- Notebooks
- DDSQL Editor
- Reference Tables
- Sheets
- Monitors and Alerting
- Service Level Objectives
- Metrics
- Watchdog
- Bits AI
- Internal Developer Portal
- Error Tracking
- Change Tracking
- Event Management
- Incident Response
- Actions & Remediations
- Infrastructure
- Cloudcraft
- Resource Catalog
- Universal Service Monitoring
- End User Device Monitoring
- Hosts
- Containers
- Processes
- Serverless
- Network Monitoring
- Storage Management
- Cloud Cost
- Application Performance
- APM
- Continuous Profiler
- Database Monitoring
- Agent Integration Overhead
- Setup Architectures
- Setting Up Postgres
- Setting Up MySQL
- Setting Up SQL Server
- Setting Up Oracle
- Setting Up Amazon DocumentDB
- Setting Up MongoDB
- Connecting DBM and Traces
- Data Collected
- Exploring Database Hosts
- Exploring Query Metrics
- Exploring Query Samples
- Exploring Database Schemas
- Exploring Recommendations
- Troubleshooting
- Guides
- Data Streams Monitoring
- Data Observability
- Digital Experience
- Real User Monitoring
- Synthetic Testing and Monitoring
- Continuous Testing
- Product Analytics
- Session Replay
- Software Delivery
- CI Visibility
- CD Visibility
- Deployment Gates
- Test Optimization
- Code Coverage
- PR Gates
- DORA Metrics
- Feature Flags
- Security
- Security Overview
- Cloud SIEM
- Code Security
- Cloud Security
- App and API Protection
- AI Guard
- Workload Protection
- Sensitive Data Scanner
- AI Observability
- Log Management
- Observability Pipelines
- Configuration
- Sources
- Processors
- Destinations
- Packs
- Akamai CDN
- Amazon CloudFront
- Amazon VPC Flow Logs
- AWS Application Load Balancer Logs
- AWS CloudTrail
- AWS Elastic Load Balancer Logs
- AWS Network Load Balancer Logs
- Cisco ASA
- Cloudflare
- F5
- Fastly
- Fortinet Firewall
- HAProxy Ingress
- Istio Proxy
- Juniper SRX Firewall Traffic Logs
- Netskope
- NGINX
- Okta
- Palo Alto Firewall
- Windows XML
- ZScaler ZIA DNS
- Zscaler ZIA Firewall
- Zscaler ZIA Tunnel
- Zscaler ZIA Web Logs
- Search Syntax
- Scaling and Performance
- Monitoring and Troubleshooting
- Guides and Resources
- Log Management
- CloudPrem
- Administration
Monitor Flex Compute Usage
Overview
Monitor the usage of Flex compute through various graphs on the Flex Logs Controls page. Make informed decisions using data on cost-performance tradeoffs and balance operational success with financial efficiency.
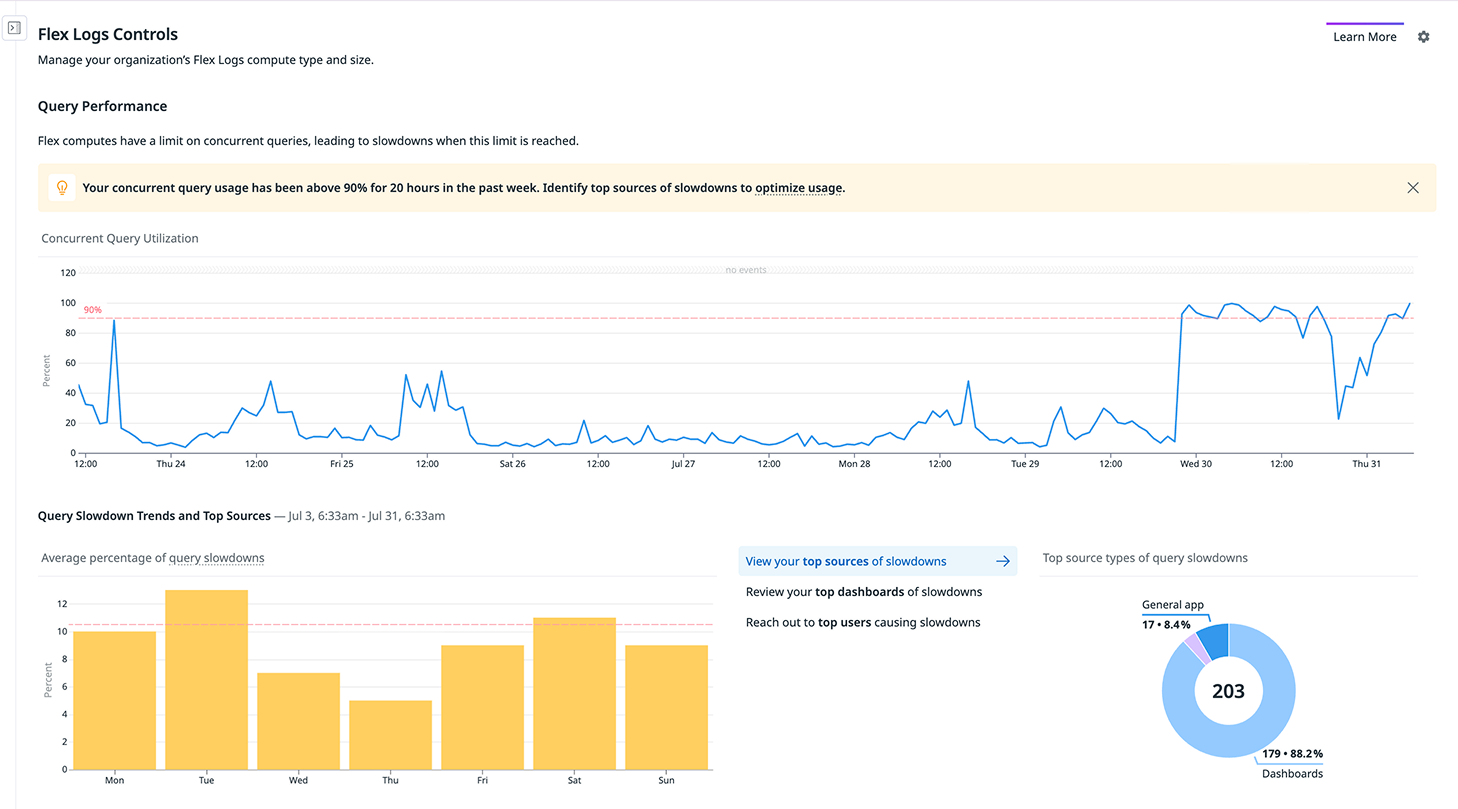
Monitoring query performance
Flex compute is limited by two factors:
- The number of concurrent queries
- The maximum number of logs that can be scanned per query
Query slowdowns occur when the concurrent query limit is reached, and a query is retrying to find an available slot to run in. If an available slot is not found, the query will not run. Datadog displays an error message advising you to retry your query at a later time.
Available metrics
- Concurrent query utilization: Shows the number of queries running at the same time and the available headroom. If usage reaches the maximum capacity, additional queries are throttled until a slot is available.
- Slowdowns by day of the week: Provides an overview of the percentage of query slowdowns by day, helping identify patterns in compute demand.
- Top sources of slowdowns: Breaks down whether delays originate from the Log Explorer, dashboards, or API queries, making it easier to target areas for optimization.
- Drilldowns: Click on a dashboard or user to open directly to the dashboard or the user history of Flex queries in Audit Trail. Note: Only Logs List queries are audited. This does not include queries used for visualizations, such as timeseries or top list.
Optimization recommendations
Use this information to optimize your usage.
- Reach out to outlier users to:
- Discuss their querying needs
- Understand if there are logs they query frequently that should be stored in Standard Indexing instead
- Improve dashboards experiencing slowdowns by:
- Pausing the auto-refresh of dashboards
- Evaluating if logs used to power widgets can be converted into metrics to reduce the heavy Flex compute usage. For example, if dashboard widgets are only looking at a few “error” or “success” instances, but the logs themselves contain low information density, consider turning these logs into a metric
- Organizing dashboard widgets into groups, and keeping the groups collapsed until needed. Widgets in a collapsed group do not load when the dashboard is opened
- Consider upgrading your Flex compute size to increase the concurrent query limit if you notice sustained query slowdowns.
- Scope to the index you are querying. If the logs you are querying belong to a specific index, scoping to that index can speed up your search.
To learn more about compute sizes, see the Flex Logs documentation.
Further reading
Additional helpful documentation, links, and articles:


