- Essentials
- Getting Started
- Agent
- API
- APM Tracing
- Containers
- Dashboards
- Database Monitoring
- Datadog
- Datadog Site
- DevSecOps
- Incident Management
- Integrations
- Internal Developer Portal
- Logs
- Monitors
- Notebooks
- OpenTelemetry
- Profiler
- Search
- Session Replay
- Security
- Serverless for AWS Lambda
- Software Delivery
- Synthetic Monitoring and Testing
- Tags
- Workflow Automation
- Learning Center
- Support
- Glossary
- Standard Attributes
- Guides
- Agent
- Integrations
- Developers
- Authorization
- DogStatsD
- Custom Checks
- Integrations
- Build an Integration with Datadog
- Create an Agent-based Integration
- Create an API-based Integration
- Create a Log Pipeline
- Integration Assets Reference
- Build a Marketplace Offering
- Create an Integration Dashboard
- Create a Monitor Template
- Create a Cloud SIEM Detection Rule
- Install Agent Integration Developer Tool
- Service Checks
- IDE Plugins
- Community
- Guides
- OpenTelemetry
- Administrator's Guide
- API
- Partners
- Datadog Mobile App
- DDSQL Reference
- CoScreen
- CoTerm
- Remote Configuration
- Cloudcraft (Standalone)
- In The App
- Dashboards
- Notebooks
- DDSQL Editor
- Reference Tables
- Sheets
- Monitors and Alerting
- Service Level Objectives
- Metrics
- Watchdog
- Bits AI
- Internal Developer Portal
- Error Tracking
- Change Tracking
- Event Management
- Incident Response
- Actions & Remediations
- Infrastructure
- Cloudcraft
- Resource Catalog
- Universal Service Monitoring
- End User Device Monitoring
- Hosts
- Containers
- Processes
- Serverless
- Network Monitoring
- Storage Management
- Cloud Cost
- Application Performance
- APM
- Continuous Profiler
- Database Monitoring
- Agent Integration Overhead
- Setup Architectures
- Setting Up Postgres
- Setting Up MySQL
- Setting Up SQL Server
- Setting Up Oracle
- Setting Up Amazon DocumentDB
- Setting Up MongoDB
- Connecting DBM and Traces
- Data Collected
- Exploring Database Hosts
- Exploring Query Metrics
- Exploring Query Samples
- Exploring Database Schemas
- Exploring Recommendations
- Troubleshooting
- Guides
- Data Streams Monitoring
- Data Observability
- Digital Experience
- Real User Monitoring
- Synthetic Testing and Monitoring
- Continuous Testing
- Product Analytics
- Session Replay
- Software Delivery
- CI Visibility
- CD Visibility
- Deployment Gates
- Test Optimization
- Code Coverage
- PR Gates
- DORA Metrics
- Feature Flags
- Security
- Security Overview
- Cloud SIEM
- Code Security
- Cloud Security
- App and API Protection
- Workload Protection
- Sensitive Data Scanner
- AI Observability
- Log Management
- Administration
Monitoring
This product is not supported for your selected Datadog site. ().
Overview
Explore and analyze your LLM applications in production with tools for querying, visualizing, correlating, and investigating data across traces, clusters, and other resources.
Monitor performance, debug issues, evaluate quality, and secure your LLM-powered systems with unified visibility across traces, metrics, and online evaluations.
Real-time performance monitoring
Monitor your LLM application’s operational health with built-in metrics and dashboards:
- Request volume and latency: Track requests per second, response times, and performance bottlenecks across different models, operations, and endpoints.
- Error tracking: Monitor HTTP errors, model timeouts, and failed requests with detailed error context.
- Token consumption: Track prompt tokens, cached tokens, completion tokens, and total usage to optimize costs.
- Model usage analytics: Monitor which models are being called, their frequency, and performance characteristics.
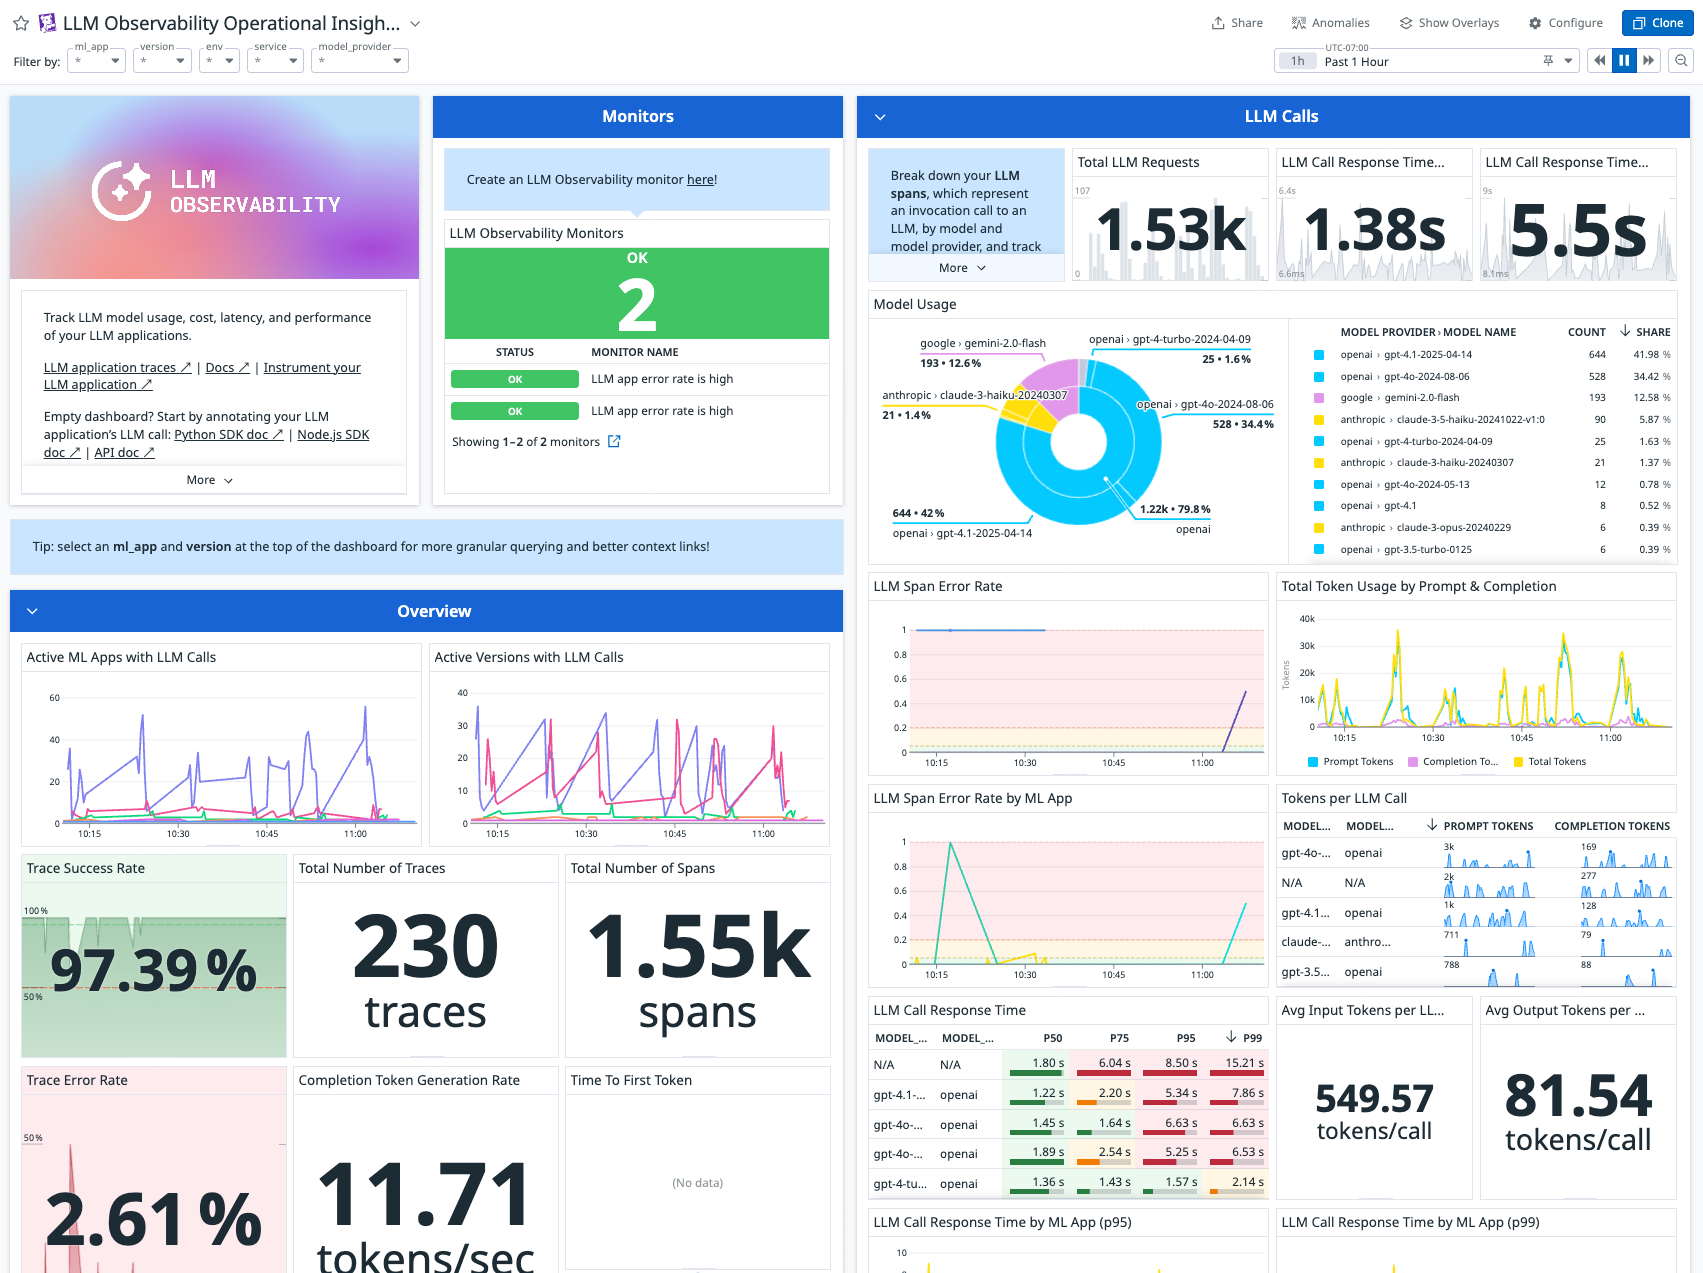
The out-of-the-box LLM Observability Operational Insights dashboard provides consolidated views of trace-level and span-level metrics, error rates, latency breakdowns, token consumption trends, and triggered monitors.
Production debugging and troubleshooting
Debug complex LLM workflows with detailed execution visibility:
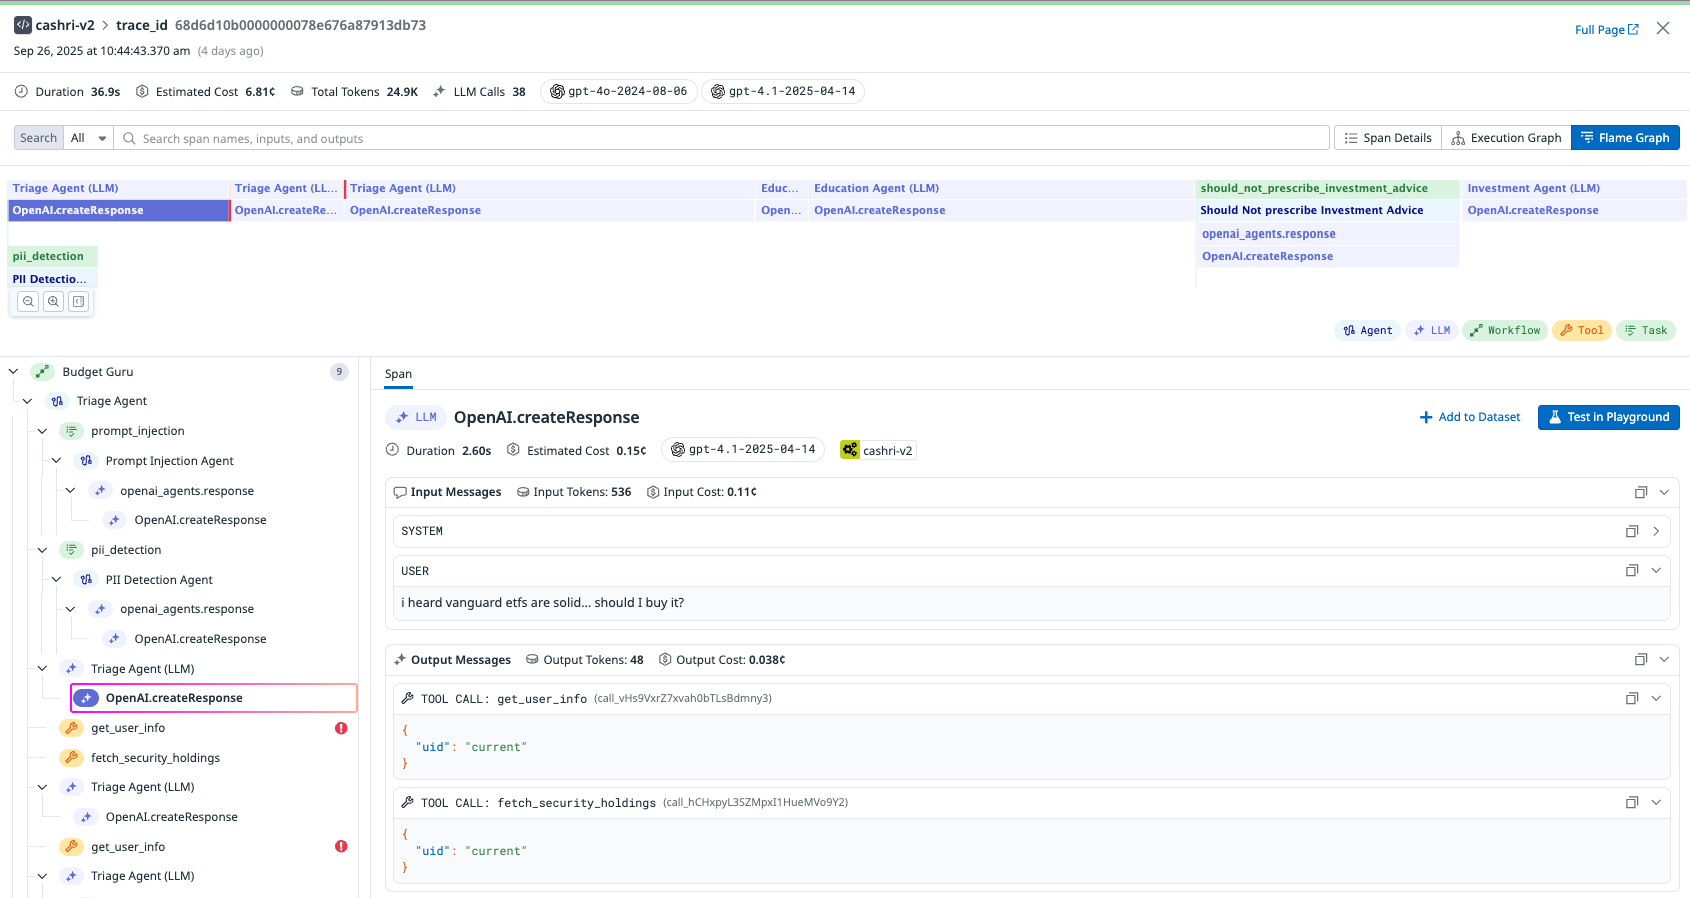
- End-to-end trace analysis: Visualize complete request flows from user input through model calls, tool calls, and response generation.
- Span-level debugging: Examine individual operations within chains, including preprocessing steps, model calls, and post-processing logic.
- Identify root cause of errors: Pinpoint failure points in multi-step chains, workflows, or agentic operations with detailed error context and timing information.
- Performance bottleneck identification: Find slow operations and optimize based on latency breakdowns across workflow components.
Quality and safety evaluations
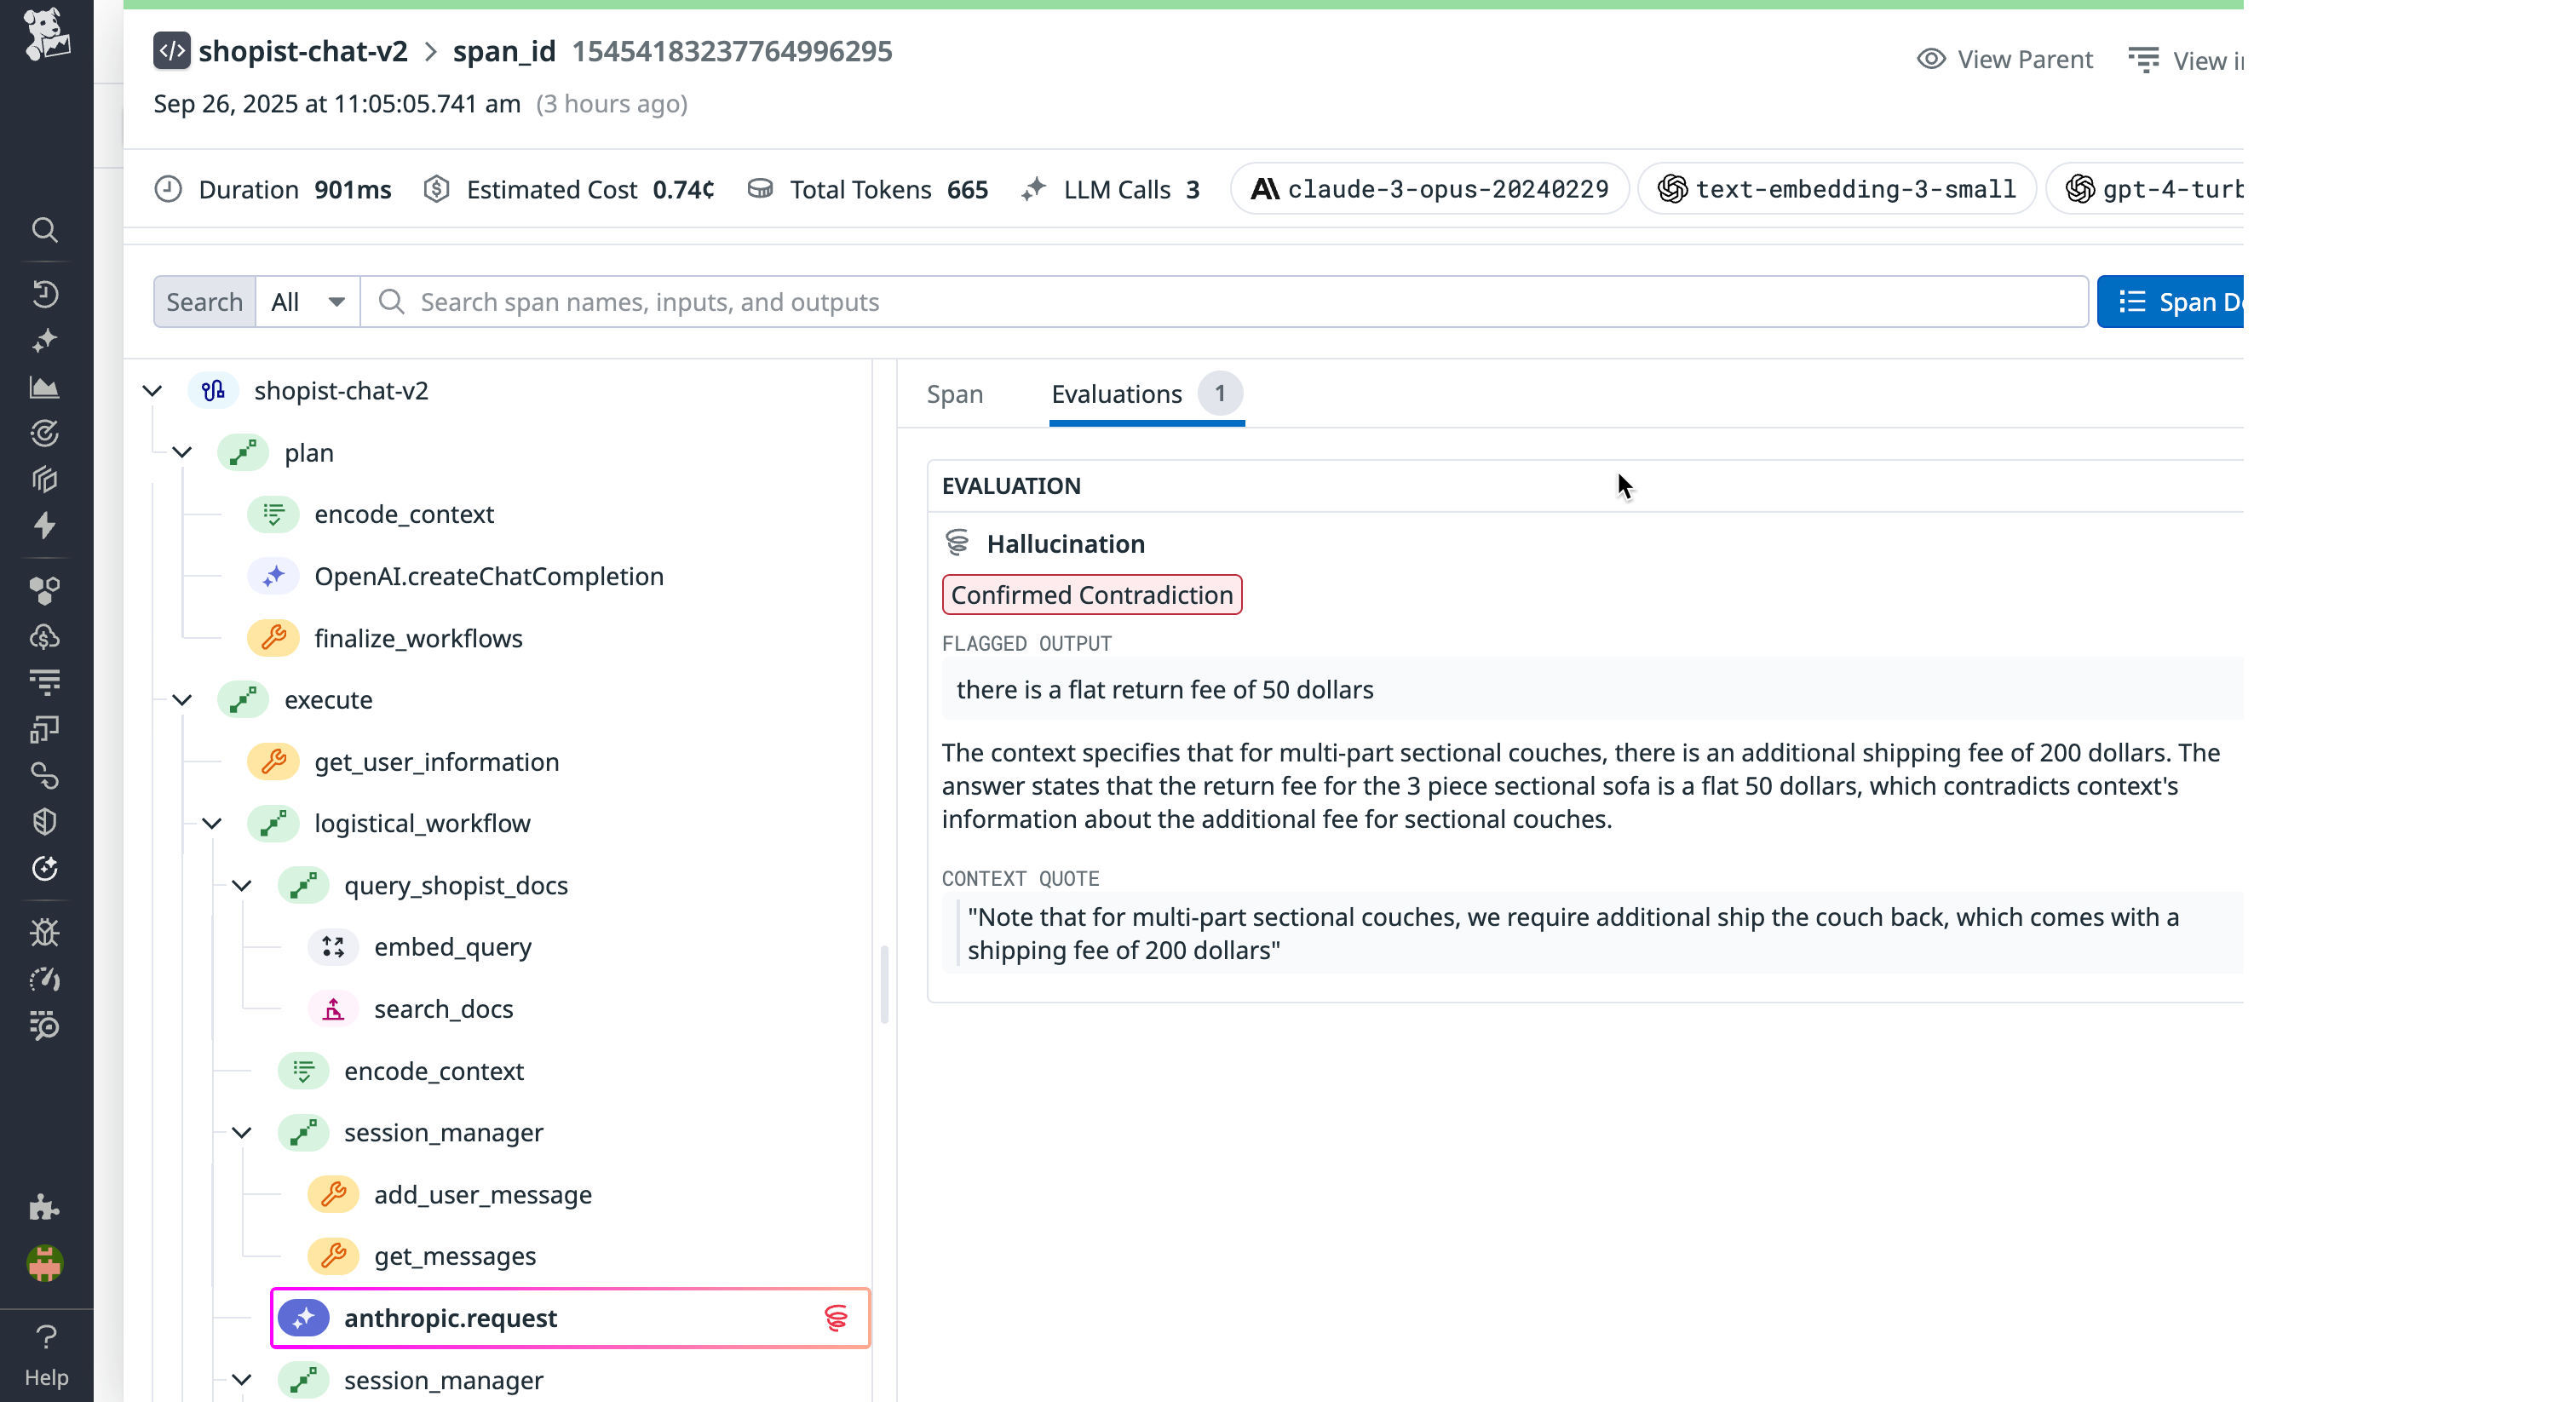
Ensure your LLM agents or applications meets quality standards with online evaluations. For comprehensive information about Datadog-hosted and managed evaluations, ingesting custom evaluations, and safety monitoring capabilities, see the Evaluations documentation.
Query your LLM application’s traces and spans
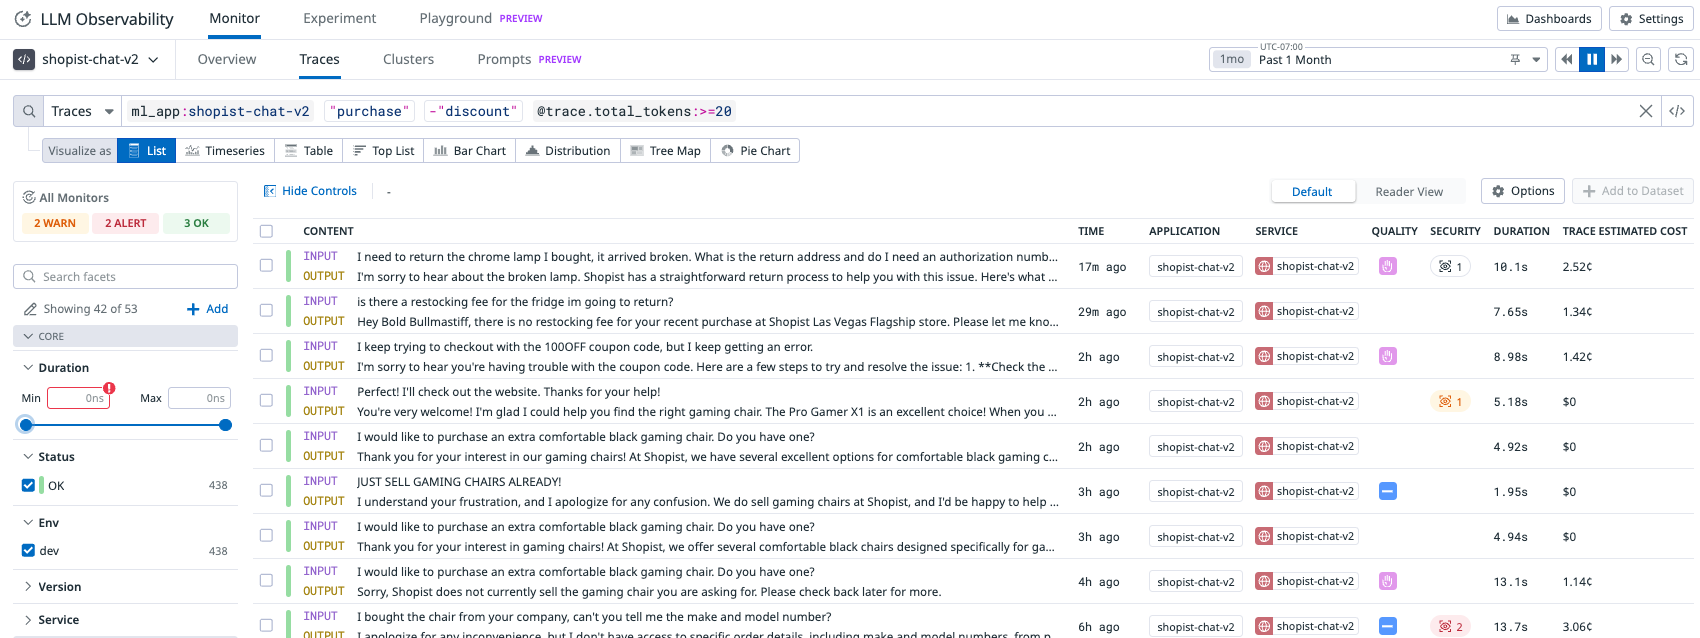
Learn how to use Datadog’s LLM Observability query interface to search, filter, and analyze traces and spans generated by your LLM applications. The Querying documentation covers how to:
- Use the search bar to filter traces and spans by attributes such as model, user, or error status.
- Apply advanced filters to focus on specific LLM operations or timeframes.
- Visualize and inspect trace details to troubleshoot and optimize your LLM workflows.
This enables you to quickly identify issues, monitor performance, and gain insights into your LLM application’s behavior in production.
Correlate APM and LLM Observability
For applications instrumented with Datadog APM, you can correlate APM and LLM Observability through the SDK. Correlating APM with LLM Observability full end-to-end visibility and thorough analysis, from app issues to LLM-specific root causes.
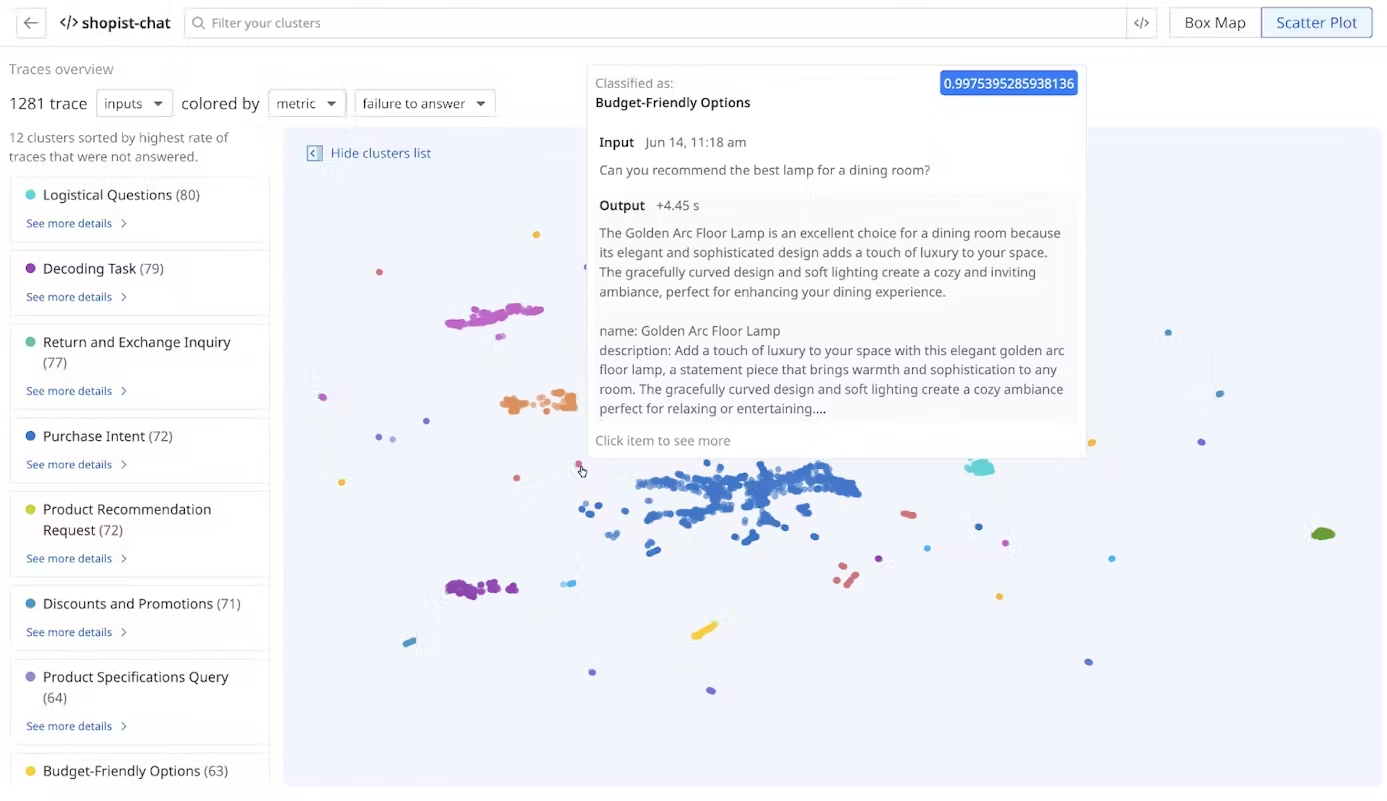
Cluster Map
The Cluster Map provides a visual overview of how your LLM application’s requests are grouped and related. It helps you identify patterns, clusters of similar activity, and outliers in your LLM traces, making it easier to investigate issues and optimize performance.
Monitor your agentic sytems
Learn how to monitor agentic LLM applications, which use multiple tools or chains of reasoning, with Datadog’s Agent Monitoring. This feature helps you track agent actions, tool usage, and reasoning steps, providing visibility into complex LLM workflows and enabling you to troubleshoot and optimize agentic systems effectively. See the Agent Monitoring documentation for details.
