- Agents
- Essentials
- Getting Started
- Agent
- API
- APM Tracing
- Containers
- Dashboards
- Database Monitoring
- Datadog
- Datadog Site
- DevSecOps
- Incident Management
- Integrations
- Internal Developer Portal
- Logs
- Monitors
- Notebooks
- OpenTelemetry
- Profiler
- Search
- Session Replay
- Security
- Serverless for AWS Lambda
- Software Delivery
- Synthetic Monitoring and Testing
- Tags
- Workflow Automation
- Learning Center
- Support
- Glossary
- Standard Attributes
- Guides
- Agent
- Integrations
- Extend Datadog
- Authorization
- DogStatsD
- Custom Checks
- Integrations
- Build an Integration with Datadog
- Create an Agent-based Integration
- Create an API-based Integration
- Create a Log Pipeline
- Integration Assets Reference
- Build a Marketplace Offering
- Create an Integration Dashboard
- Create a Monitor Template
- Create a Cloud SIEM Detection Rule
- Install Agent Integration Developer Tool
- Service Checks
- Community
- Guides
- OpenTelemetry
- Administrator's Guide
- API
- Partners
- Datadog Mobile App
- DDSQL Reference
- CoScreen
- CoTerm
- Remote Configuration
- Cloudcraft (Standalone)
- In The App
- Dashboards
- Notebooks
- DDSQL Editor
- Reference Tables
- Sheets
- Monitors and Alerting
- Service Level Objectives
- Metrics
- Watchdog
- Bits AI
- Internal Developer Portal
- Error Tracking
- Change Tracking
- Event Management
- Incident Response
- Actions & Remediations
- Infrastructure
- Cloudcraft
- Resource Catalog
- Universal Service Monitoring
- End User Device Monitoring
- Hosts
- Containers
- Processes
- Serverless
- Network Monitoring
- Storage Management
- Cloud Cost
- Application Performance
- APM
- Continuous Profiler
- Database Monitoring
- Agent Integration Overhead
- Setup Architectures
- Setting Up Postgres
- Setting Up MySQL
- Setting Up SQL Server
- Setting Up Oracle
- Setting Up Amazon DocumentDB
- Setting Up MongoDB
- Setting Up ClickHouse
- Connecting DBM and Traces
- Data Collected
- Exploring Database Hosts
- Exploring Query Metrics
- Exploring Query Samples
- Exploring Database Schemas
- Exploring Recommendations
- Troubleshooting
- Guides
- Data Streams Monitoring
- Data Observability
- Digital Experience
- Real User Monitoring
- Synthetic Testing and Monitoring
- Continuous Testing
- Experiments
- Product Analytics
- Session Replay
- Software Delivery
- CI Visibility
- CD Visibility
- Deployment Gates
- Test Optimization
- Code Coverage
- PR Gates
- DORA Metrics
- Feature Flags
- Developer Integrations
- Security
- Security Overview
- Cloud SIEM
- Code Security
- Cloud Security
- App and API Protection
- AI Guard
- Workload Protection
- Sensitive Data Scanner
- AI Observability
- Log Management
- Observability Pipelines
- Configuration
- Sources
- Processors
- Destinations
- Packs
- Akamai CDN
- Amazon CloudFront
- Amazon VPC Flow Logs
- AWS Application Load Balancer Logs
- AWS CloudTrail
- AWS Elastic Load Balancer Logs
- AWS Network Load Balancer Logs
- Cisco ASA
- Cloudflare
- F5
- Fastly
- Fortinet Firewall
- HAProxy Ingress
- Istio Proxy
- Juniper SRX Firewall Traffic Logs
- Netskope
- NGINX
- Okta
- Palo Alto Firewall
- Windows XML
- ZScaler ZIA DNS
- Zscaler ZIA Firewall
- Zscaler ZIA Tunnel
- Zscaler ZIA Web Logs
- Search Syntax
- Scaling and Performance
- Monitoring and Troubleshooting
- Guides and Resources
- Log Management
- CloudPrem
- Administration
Analyze Your Experiments Results
This product is not supported for your selected Datadog site. ().
This page describes how to analyze LLM Observability Experiments results in Datadog’s Experiments UI and widgets.
After running an Experiment, you can analyze the results to understand performance patterns and investigate problematic records.
Using the Experiment page in Datadog
On the Experiments page, click on an experiment to see its details.
The Summary section contains the evaluations, summary evaluations, and metrics that were logged during the execution of your Experiment.
Each value is aggregated based on its type:
- Boolean: Aggregated as the ratio of
Trueover all the values recorded. - Score: Aggregated as average over all values recorded.
- Categorical: Aggregated as the mode (most frequent value in the distribution).
The Records section contains traces related to the execution of your task on the dataset inputs. Each trace contains the list of spans showing the flow of information through your agent.
You can use the facets (on the left-hand side) to filter the records based on their evaluation results to uncover patterns.
Searching for specific records
You can use the search bar to find specific records, based on their properties (dataset records data) or on the result of the experiment (output and evaluations). The search is executed at trace level.
To have access to the most data, update to
ddtrace-py >= 4.1.0, as this version brings the following changes:- Experiments spans contain metadata from the dataset record.
- Experiments spans'
input,output, andexpected_outputfields are stored as-is (that is, as queryable JSON if they are emitted as such) - Experiments spans and children spans are tagged with
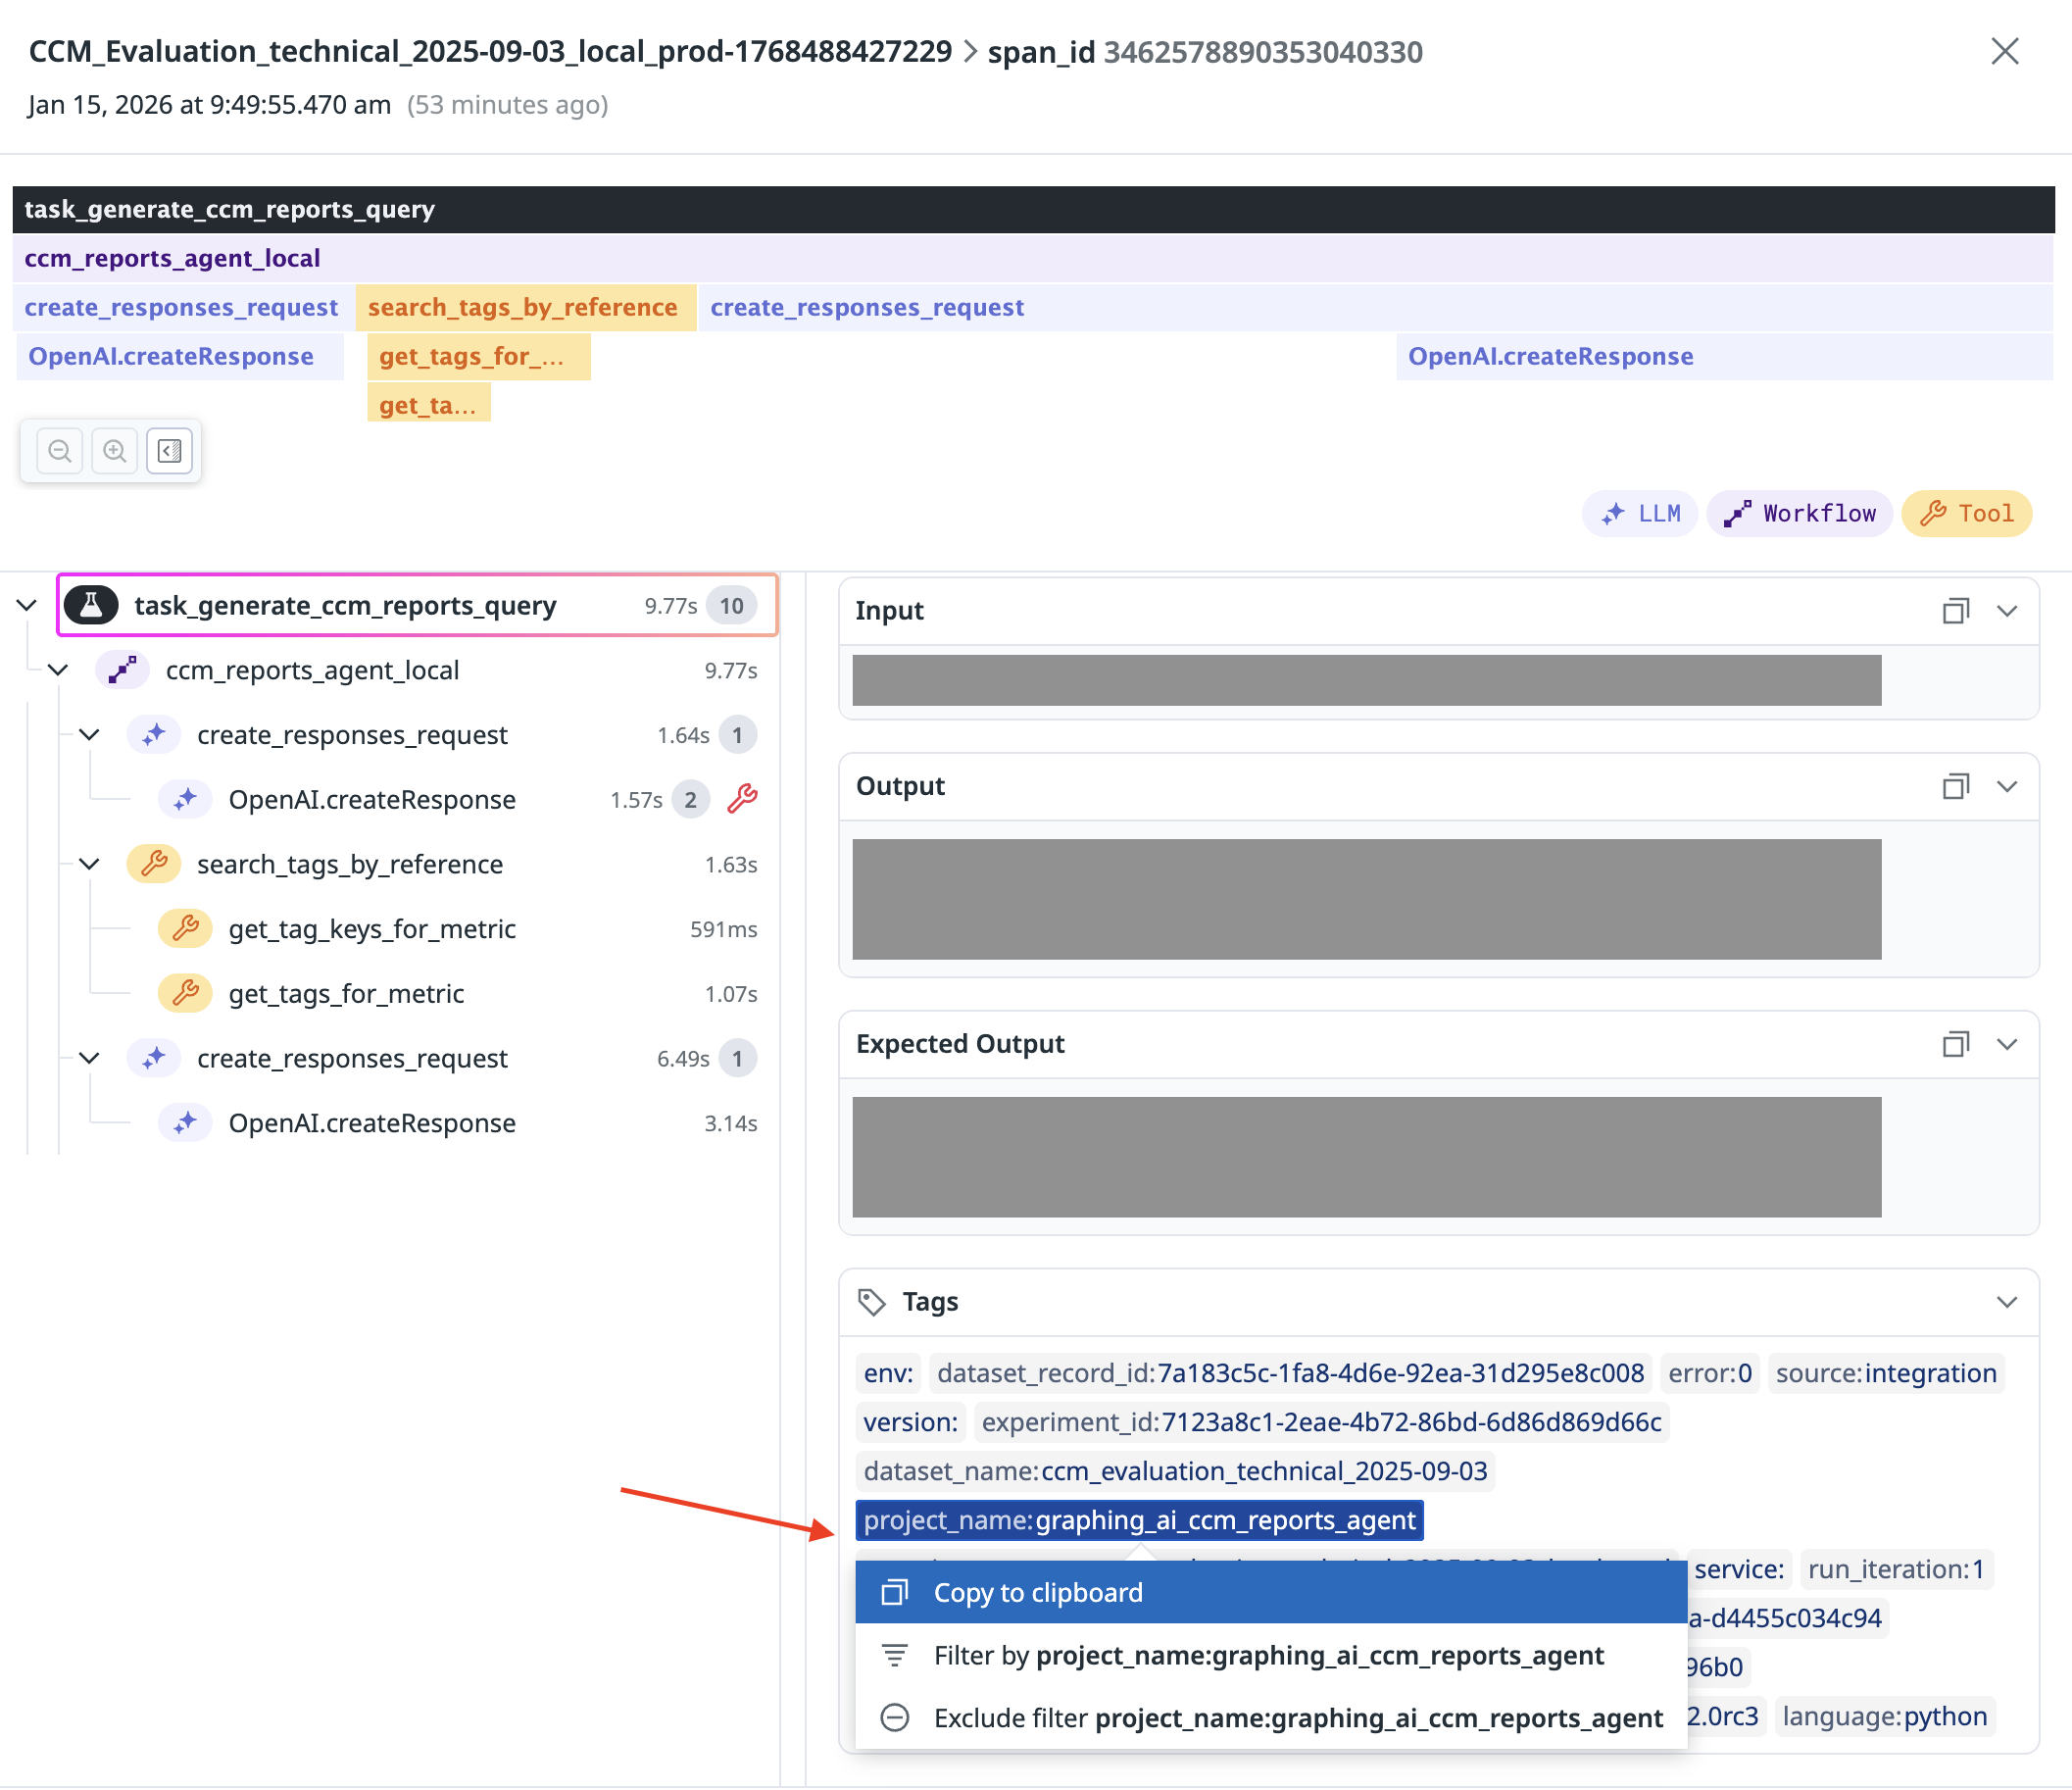
dataset_name,project_name,project_id,experiment_namefor easier search.
Find traces by keyword
Searching by keyword executes a search across all available information (input, output, expected output, metadata, tags).
Find traces by evaluation
To find a trace by evaluation, search: @evaluation.<name>.value:<criteria>
| Evaluation type | Example search term |
|---|---|
| Boolean | @evaluation.has_risk_pred.value:true |
| Score | @evaluation.correctness.value:>=0.35 |
| Categorical | @evaluation.violation.value:(not_fun OR not_nice) |
Find traces by metric
LLM Experiments automatically collects duration, token count, and cost metrics.
| Metric | Example search term |
|---|---|
| Duration | @duration:>=9.5s |
| Token count | @trace.total_tokens:>10000 |
| Estimated total cost (in nanodollars; 1 nanodollar = 10-9 dollars) | @trace.estimated_total_cost:>10000000 |
Find traces by tag
To find traces using tags, search <tag>:<value>. For example, dataset_record_id:84dfd2af88c6441a856031fc2e43cb65 .
To see which tags are available, open a trace to find its tags.
Find traces by input, output, expected output, or metadata
To query a specific key in input, output, expected output, or metadata, you need to emit the property as JSON.
| Property | Format | Example search term |
|---|---|---|
| input | @meta.input.<key1>.<subkey1>:<value> | @meta.input.origin.country:"France" |
| output | @meta.output.<key1>.<subkey1>:<value> | @meta.output.result.status:"success" |
| expected output | @meta.expected_output.<key1>.<subkey1>:<value> | @meta.expected_output.answer:"correct" |
| metadata | @meta.metadata.<key1>.<subkey1>:<value> | @meta.metadata.source:generated |
Querying JSON arrays
Simple arrays are flattened as strings, and you can query them.
Example 1: Queryable JSON array
"output": {
  "action_matches": [
        "^/cases/settings$",
        "^Create Case Type$",
        "^/cases$"
    ],
}
You can query this example array by searching: @meta.output.action_matches:"^/cases/settings$".
Example 2: Non-queryable JSON array
"output": {
  "expected_actions": [
    [
      "bonjour",
      "a_bientot"
    ],
    [
      "todobem",
      "click here"
    ]
  ],
}
In this example, the array is nested and cannot be queried.
Using widgets with LLM Experiments data
You can build widgets in Dashboards and Notebooks using LLM Experiments data. Datadog suggests that you:
- Populate the metadata of your dataset records with all extra information that might help you slice your data (for example: difficulty, language, etc.)
- Ensure that your tasks outputs a JSON object
- Update
ddtrace-pyversion >= 4.1.0
To build a widget using LLM Experiments data, use LLM Observability > Experiments as data source. Then, use the search syntax on this page to narrow down the events to plot.
For record level data aggregation, use Traces; otherwise, use All Spans.
Widget examples
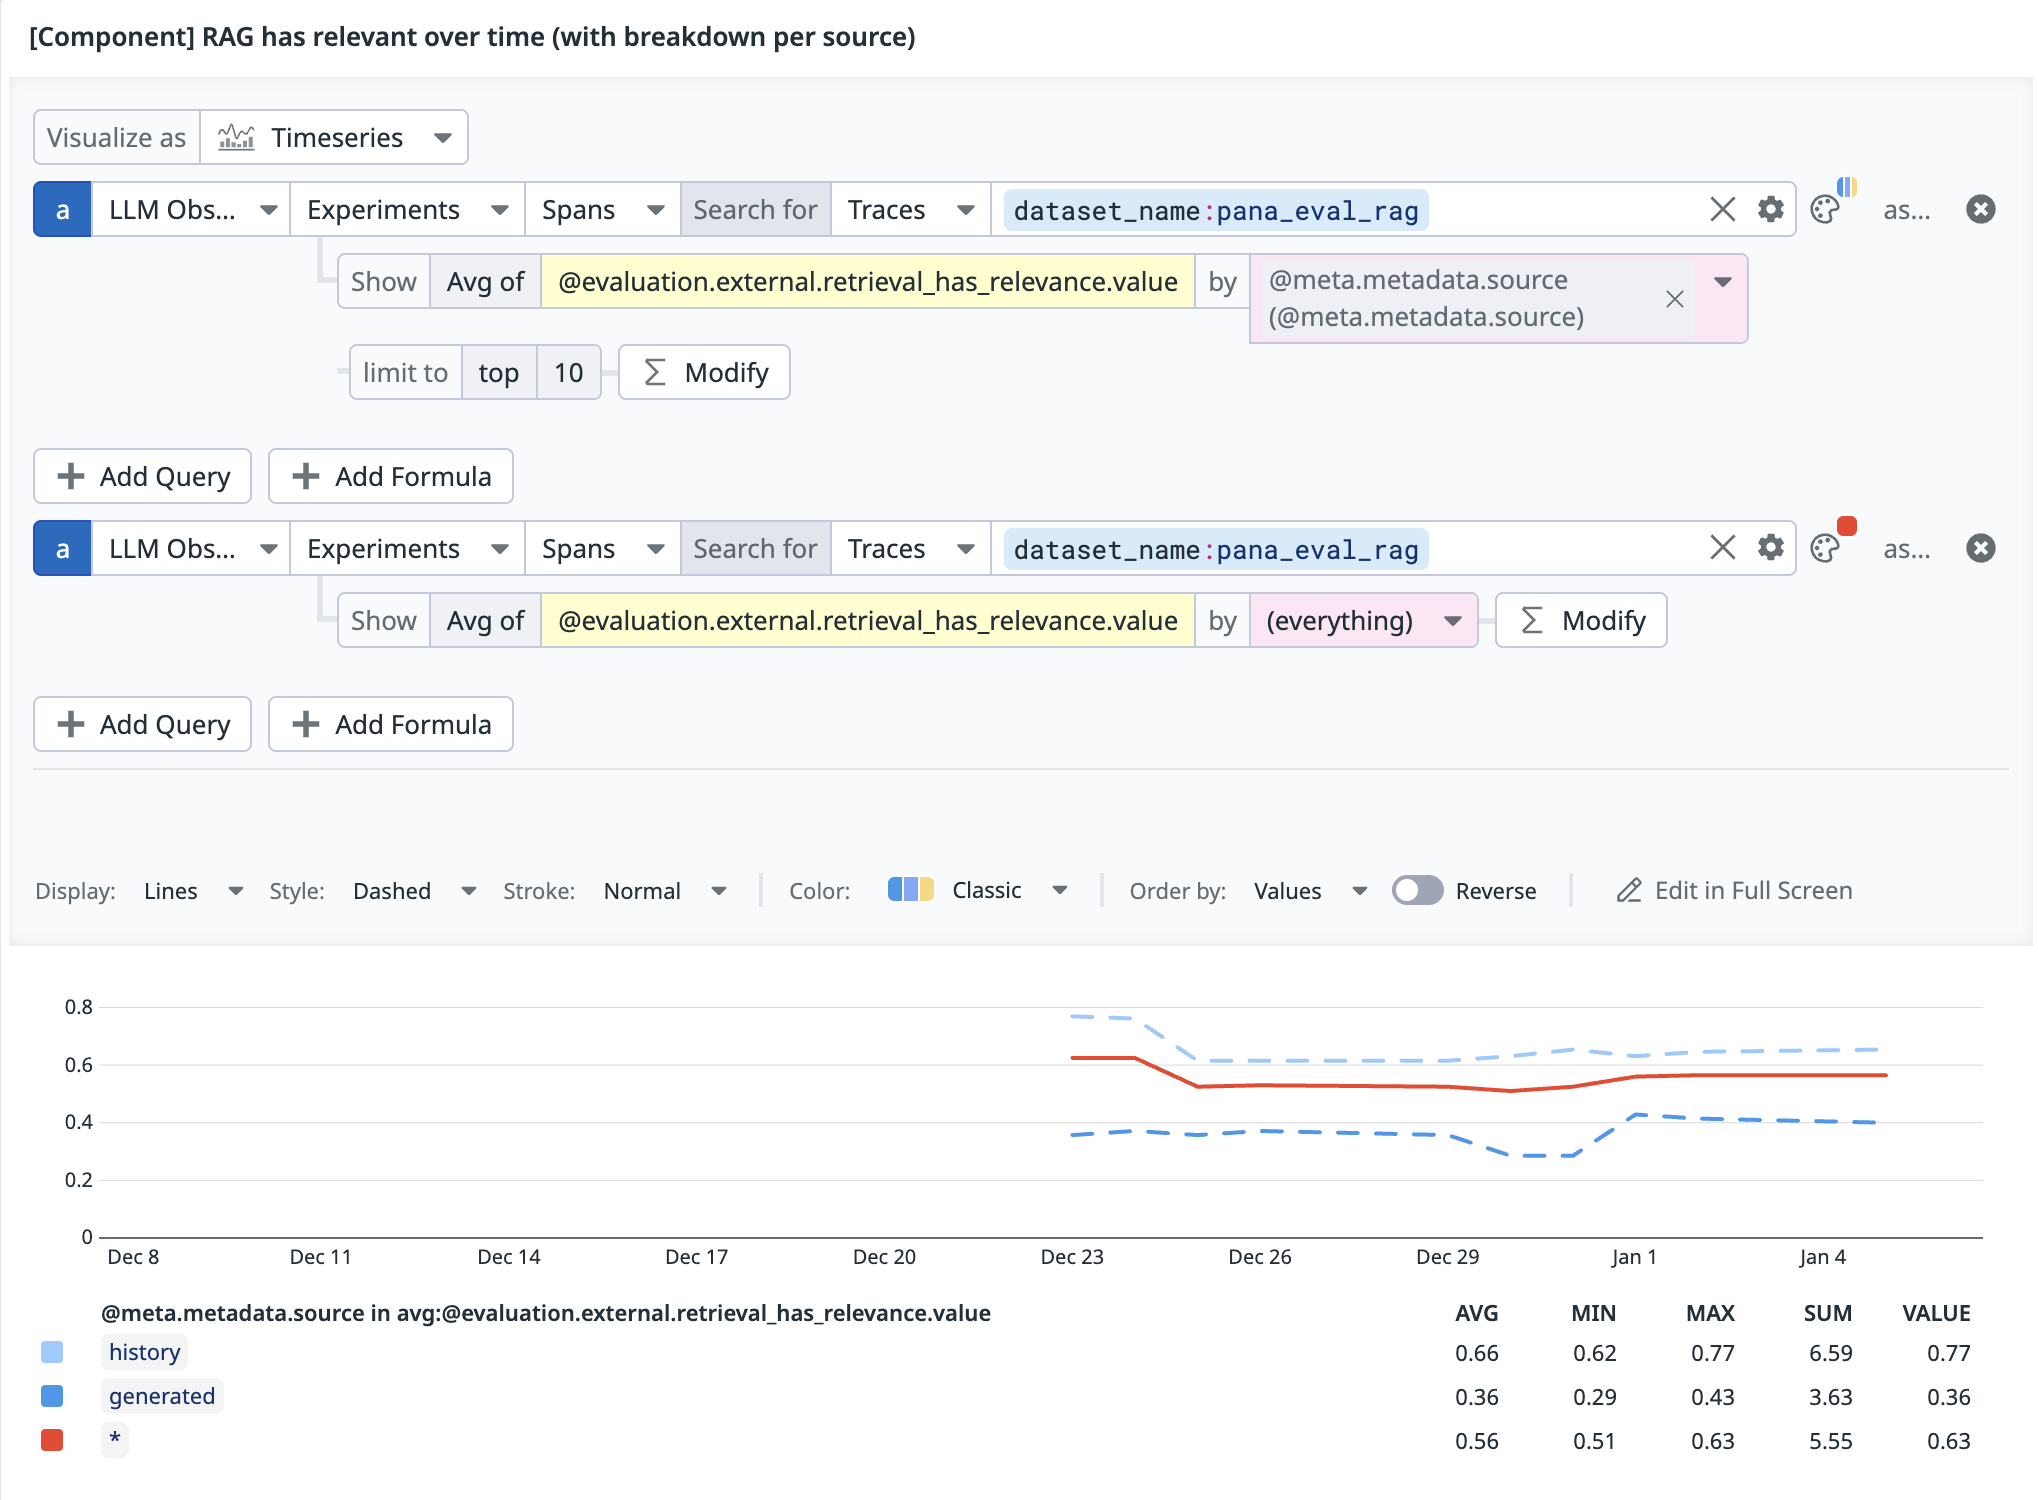
Plotting performance over time broken down by a metadata field
If you are trying to compute an average of a Boolean evaluation, you must manually compute the percentage of
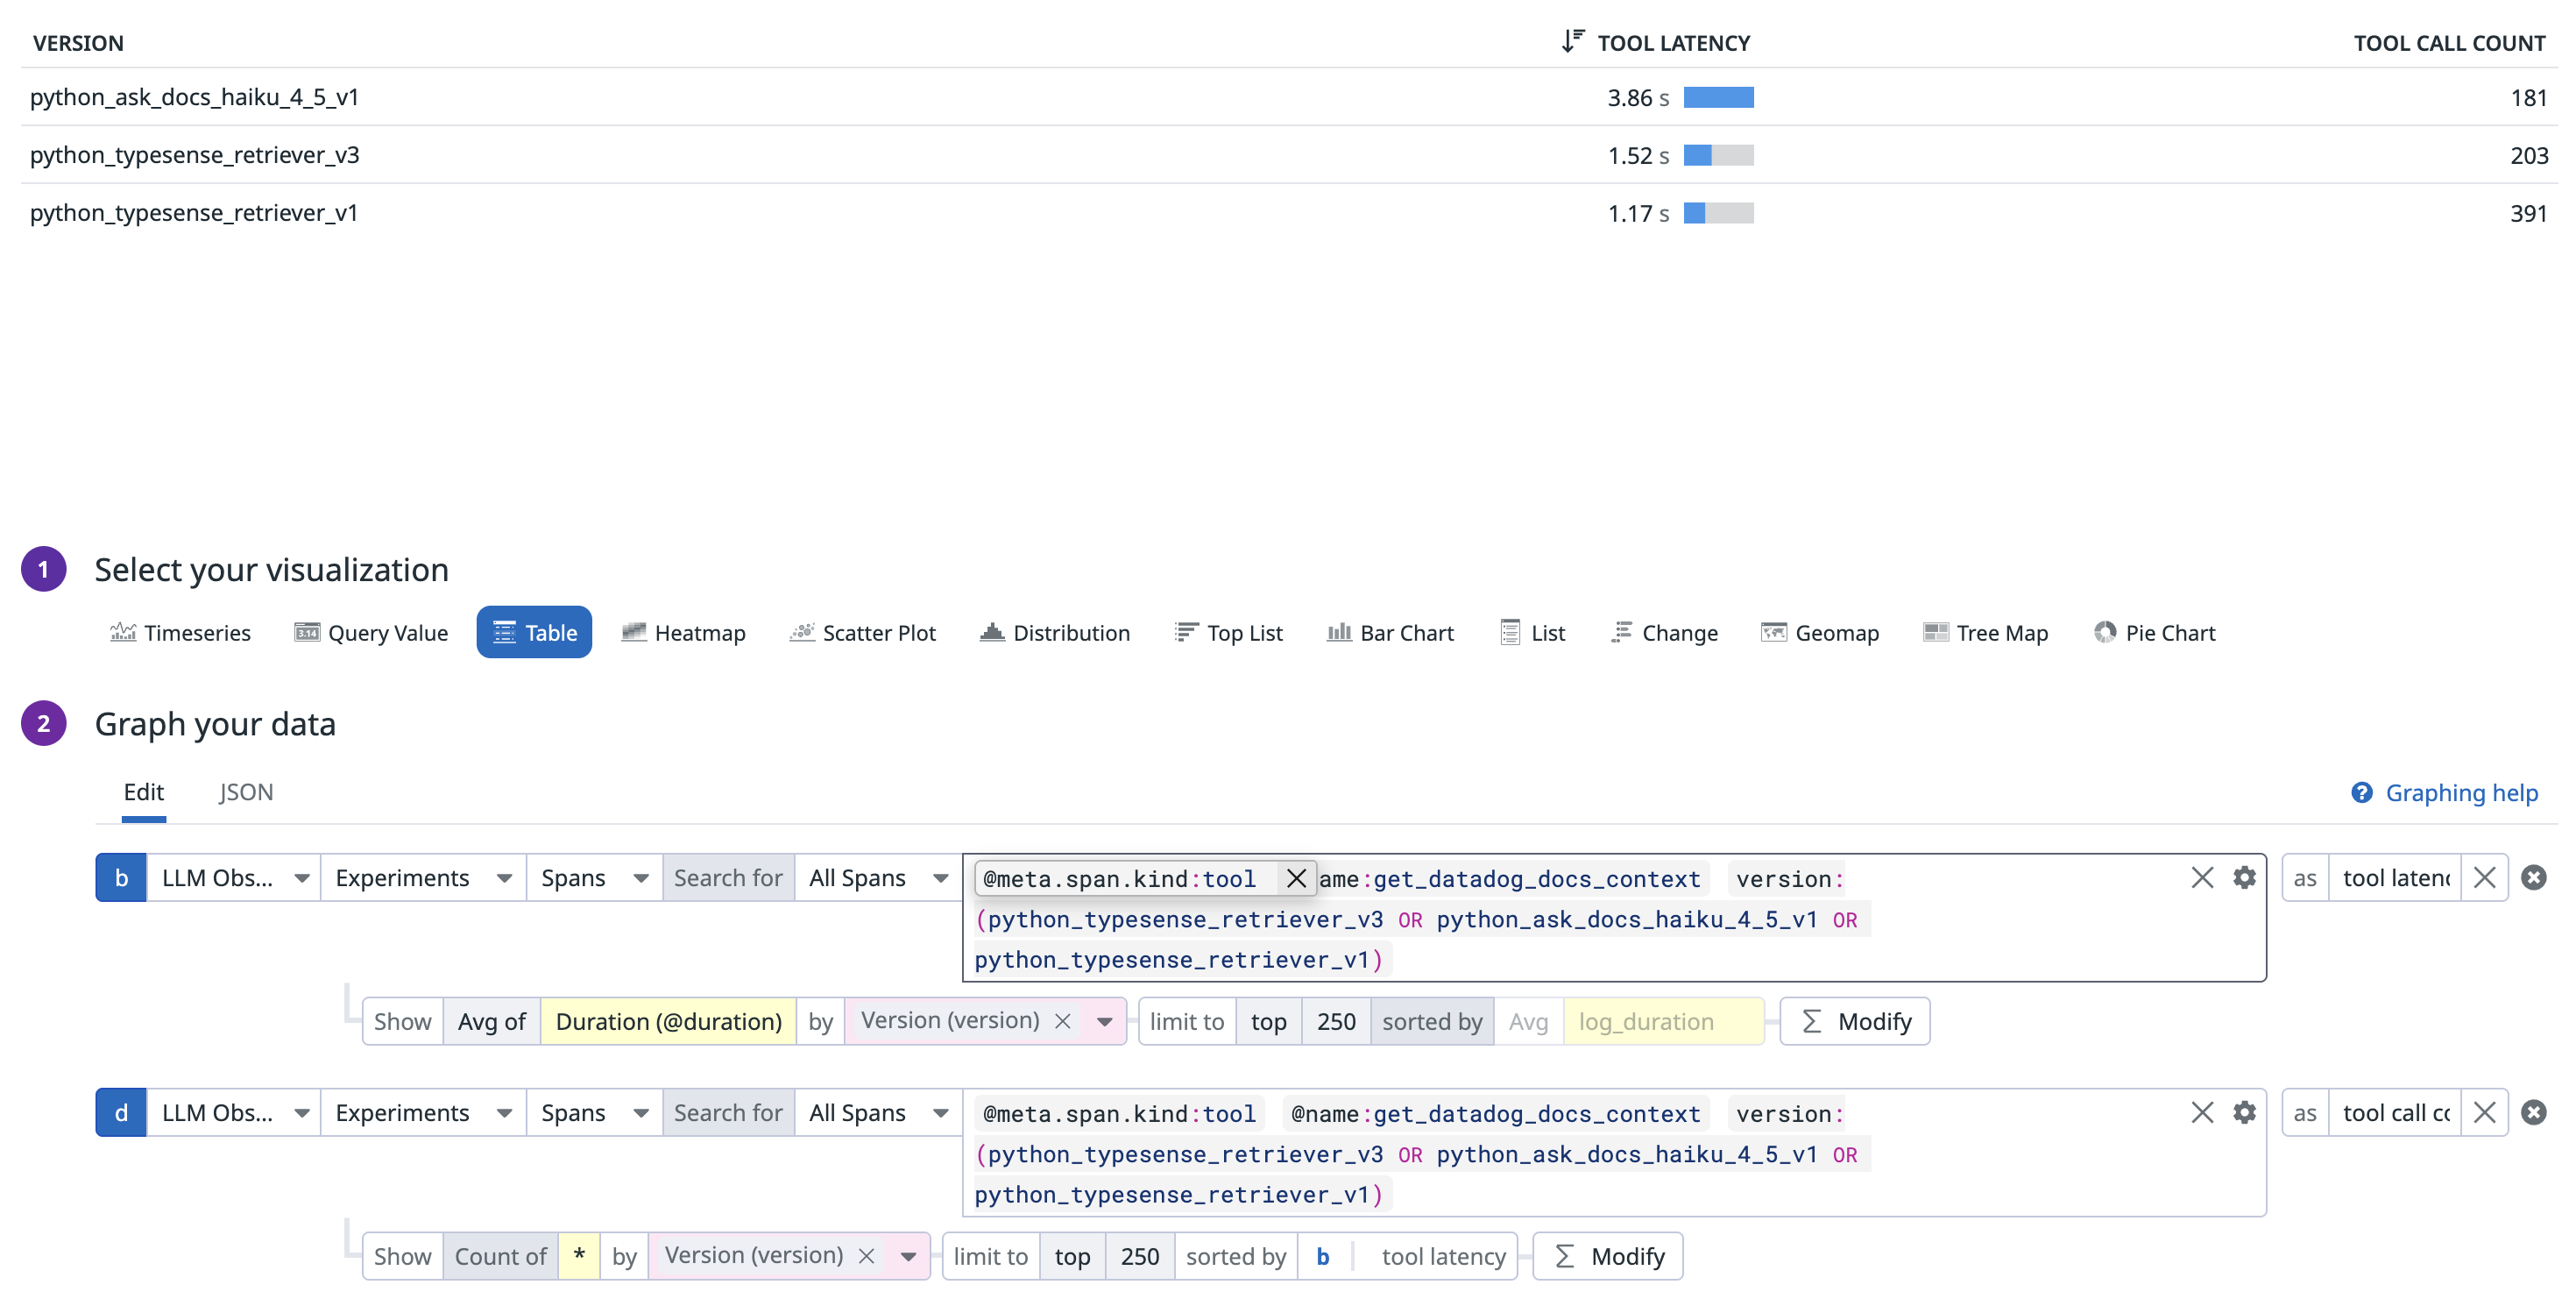
True over all traces.Displaying tool usage stats
In a situation where your agent is supposed to call a certain tool, and you need to understand how often the tool is called and get some stats about it:


