Overview
Datadog RUM supports profiling for browser, iOS, and Android applications. Use profiling data to identify performance bottlenecks, optimize slow code paths, and improve rendering performance at both the system and code level.
Browser profiling provides visibility into how your application behaves in your users' browsers, helping you understand root causes behind unresponsive applications at page load or during the page life cycle. Use profiling data alongside RUM insights to identify which code executes during a Long Animation Frame (LoAF) and how JavaScript execution and rendering tasks impact user-perceived performance.
To get started, enable browser profiling in your RUM SDK configuration. After enabling it, click on a profiled event sample to see detailed profiling data.
Setup
Step 1 - Set up RUM
Browser SDK version 6.12 or later is required.
To start collecting data, set up RUM Browser Monitoring.
Step 2 - Configure the profiling sampling rate
Initialize the RUM SDK and configure
profilingSampleRate, which determines the percentage of sessions that are profiled (for example, 25% means profiling runs on 25 out of 100 sessions).import { datadogRum } from '@datadog/browser-rum' datadogRum.init({ clientToken: '<CLIENT_TOKEN>', applicationId: '<APPLICATION_ID>', site: 'datadoghq.com', // service: 'my-web-application', // env: 'production', // version: '1.0.0', profilingSampleRate: 25, trackLongTasks: true, trackUserInteractions: true, })Configure your web servers to serve HTML pages with the HTTP response header
Document-Policy: js-profiling:app.get("/", (request, response) => { … response.set("Document-Policy", "js-profiling"); … });Set up Cross-Origin Resource Sharing (CORS) if needed.
This step is required only if your JavaScript files are served from a different origin than your HTML. For example, if your HTML is served from
cdn.comand JavaScript files fromstatic.cdn.com, you must enable CORS to make JavaScript files visible to the profiler. For more information, see the Browser profiling and CORS section.To enable CORS:
Add a
crossorigin="anonymous"attribute to<script/>tagsMake sure that JavaScript response includes the
Access-Control-Allow-Origin: *HTTP header (or the proper origin value)app.get("/", (request, response) => { … response.header("Access-Control-Allow-Origin", "*"); response.header("Access-Control-Allow-Headers", … });
Browser profiling and CORS
Browser profiling and CORS
Requirements for Cross-Origin Scripts (CORS)
If a script's execution or attribution information is to be surfaced in performance entries (and thus captured in browser profiling), the resource (for example, a JavaScript file) needs to be fetched with CORS headers that explicitly allow it to be shared with the origin making the measurement (your application).
To summarize:
- If a script is loaded from a same-origin source, then attribution is allowed, and you can see profiling data attributed to this script.
- If a script is loaded cross-origin without a permissive CORS policy (like
Access-Control-Allow-Originallowing the page origin), then attribution is blocked, and you do not see profiling data attributed to this script.
This CORS policy restricts profiling to only scripts that are explicitly intended to be profiled by other origins.
How does CORS relate to browser profiling?
When you start Datadog's browser profiler (which uses the JS Self-Profiling API), the profiler can capture stack traces of JavaScript execution—but it only includes attribution (function names, URLs, etc.) for the following scripts:
- Scripts that have the same origin as the page initiating the profiling
- Cross-origin scripts that explicitly opt-in using CORS
This protects third-party content and users from leaking execution details across security boundaries.
Why is the crossorigin="anonymous" attribute needed?
Without the crossorigin="anonymous" attribute, the browser does not make a CORS-enabled request for the script. The browser fetches the script without CORS, meaning:
- No CORS policy applies.
- No credentials (cookies, HTTP auth, etc.) are sent.
- The fetched script is not eligible for detailed attribution in performance entries or stack traces. These stack frames are displayed as "(anonymous)" or with no attribution.
To protect cross-origin script privacy, both sides must agree to share information:
- The page must explicitly request a CORS-enabled fetch, with
crossorigin="anonymous". - The server must permit this, with an
Access-Control-Allow-Originheader in the response.
A script is eligible for attribution in the JS Self-Profiling API only when both of these conditions are met.
Explore profiling
Within the Sessions Explorer
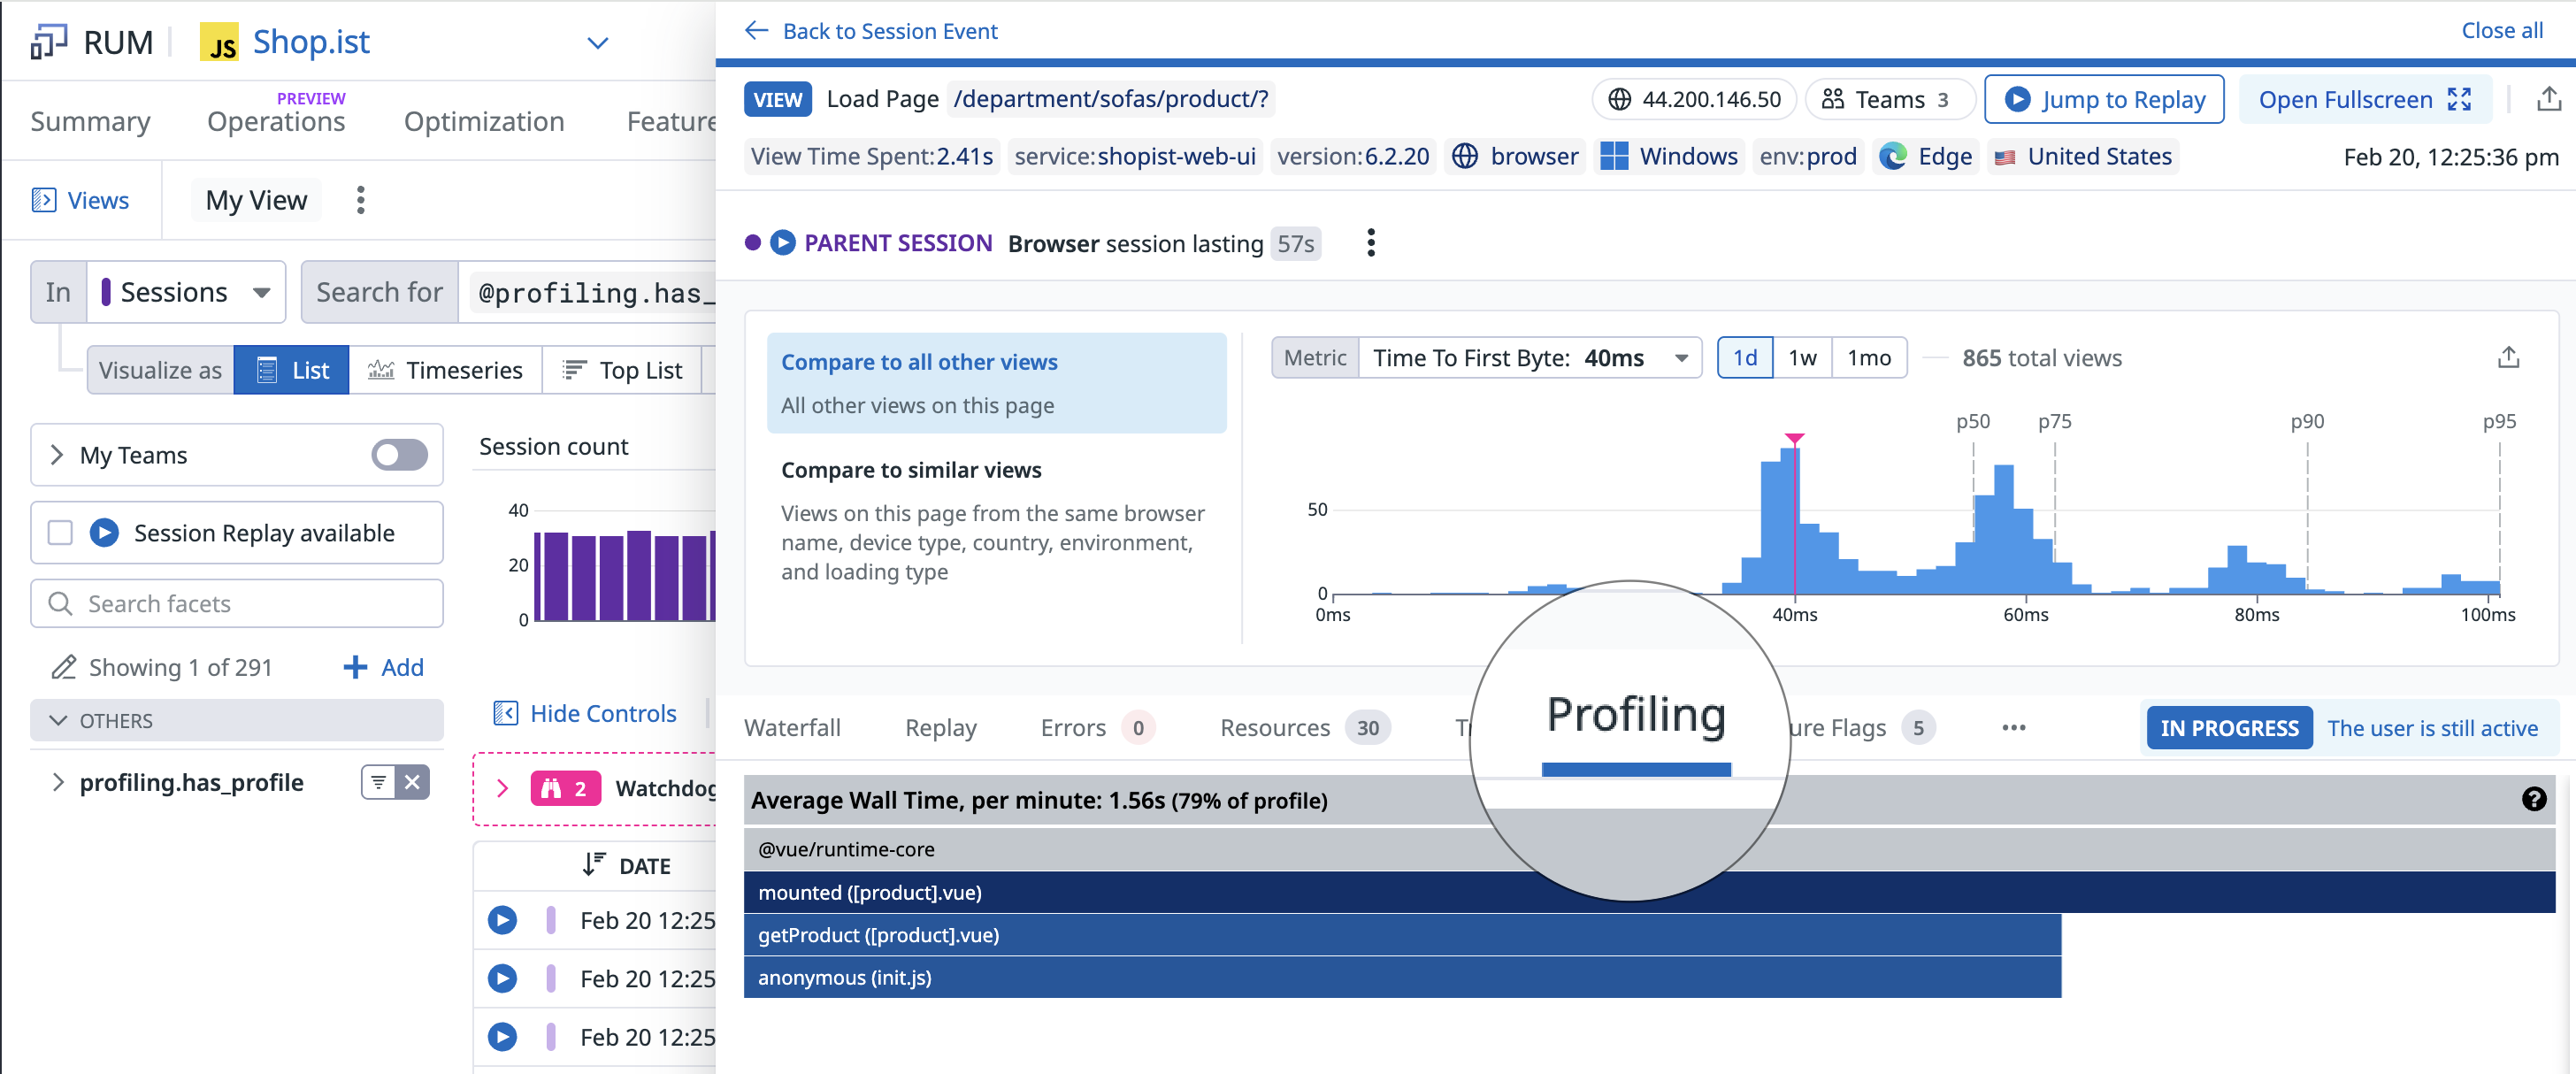
Profiling data is captured on long tasks and rolls up to actions, views, vitals, and sessions. Use @profiling.has_profile to filter to profiled events and understand what code ran and how it affected the user's experience. This is available for sessions, views, actions, vitals, and long tasks.
- View panel: Profiling data in a new tab.
- Long Task panel: Profiling data in the performance tab.
- Vitals panel: Profiling data in a new tab.
- Action panel: Profiling data in a new tab.
Within the Profiling page
The Profiling page, found thorugh the top bar navigation, lets you analyze profiling data across sessions in one place. Use it to spot system level patterns, compare top-consuming functions, and prioritize optimizations instead of inspecting profiled sessions one by one. The guided experience walks you through:
- Focus on views: Choose the views you'd like to analyze.
- Select a measurement: Pick a Core Web Vital, custom vital, or RUM action to dive into.
- Refine your selection: Narrow to the most relevant slice of data by percentile or time range so you focus on the worst-performing or most critical segment.
- Investigate slowest functions: Review which functions consume the most time in the aggregated profile so you can prioritize what to optimize first.
- View the flame graph: Explore the call hierarchy to see how those functions relate and where time is spent across the stack.
Within the Optimization page
The Optimization page surfaces profiling data in several contexts:
- In the Troubleshoot section, Datadog samples long tasks across multiple views to identify your top contributing functions. Use this overview to find where JavaScript execution time is spent and which functions block the main thread, then optimize those functions to improve responsiveness.
- Within the Event Waterfall, any long task that includes profiling data is marked with a yellow profiling icon. Click one of these long task events to open a Long Task view panel with detailed profiling data. Use this panel to identify blocking functions, trace their call stacks, and understand how script execution contributes to poor responsiveness.
Android profiling captures detailed data about your application's performance during launch, helping you identify slow methods and optimize startup time. Android profiling is built on top of the ProfilingManager Android API and samples the device's CPU to collect method call stacks from the application's process.
Only devices running Android 15 (API level 35) or higher generate profiling data.
Prerequisites
- Your Android application must use the Datadog Android SDK version 3.6.0+.
- RUM without Limits must be enabled in your organization.
Setup
Step 1 - Set up RUM
To start collecting data, set up Mobile RUM for Android.
Step 2 - Configure the profiling sampling rate
Initialize the RUM SDK and configure the
applicationLaunchSampleRate, which determines the percentage of application launches that are profiled (for example, 15% means profiling runs on 15 out of 100 launches).If no value is specified, the default
applicationLaunchSampleRateis 15 percent.class SampleApplication : Application() { override fun onCreate() { super.onCreate() val configuration = Configuration.Builder( clientToken = "<CLIENT_TOKEN>", env = "<ENV_NAME>", variant = "<APP_VARIANT_NAME>" ).build() Datadog.initialize(this, configuration, trackingConsent) // Enable RUM (required for Profiling) val rumConfig = RumConfiguration.Builder(applicationId) .build() Rum.enable(rumConfig) // Enable Profiling val profilingConfig = ProfilingConfiguration.Builder() .setApplicationLaunchSampleRate(15) // default is 15% .build() Profiling.enable(profilingConfig) } }The total volume of profiles may not match the percentage configured in
applicationLaunchSampleRate. This variation results from rate limitations within the data collector, including profiling support on older devices and the maximum profiling frequency per device.
The ProfilingManager API also supports disabling rate limiting during debug builds.
Explore profiling data
Profiling data is captured on vitals and rolls up to views and sessions. Use @profiling.has_profile in the Sessions Explorer to filter to profiled events and investigate which code ran and how it affected the user's experience. This is available for sessions, views, and vitals.
During the time to initial display
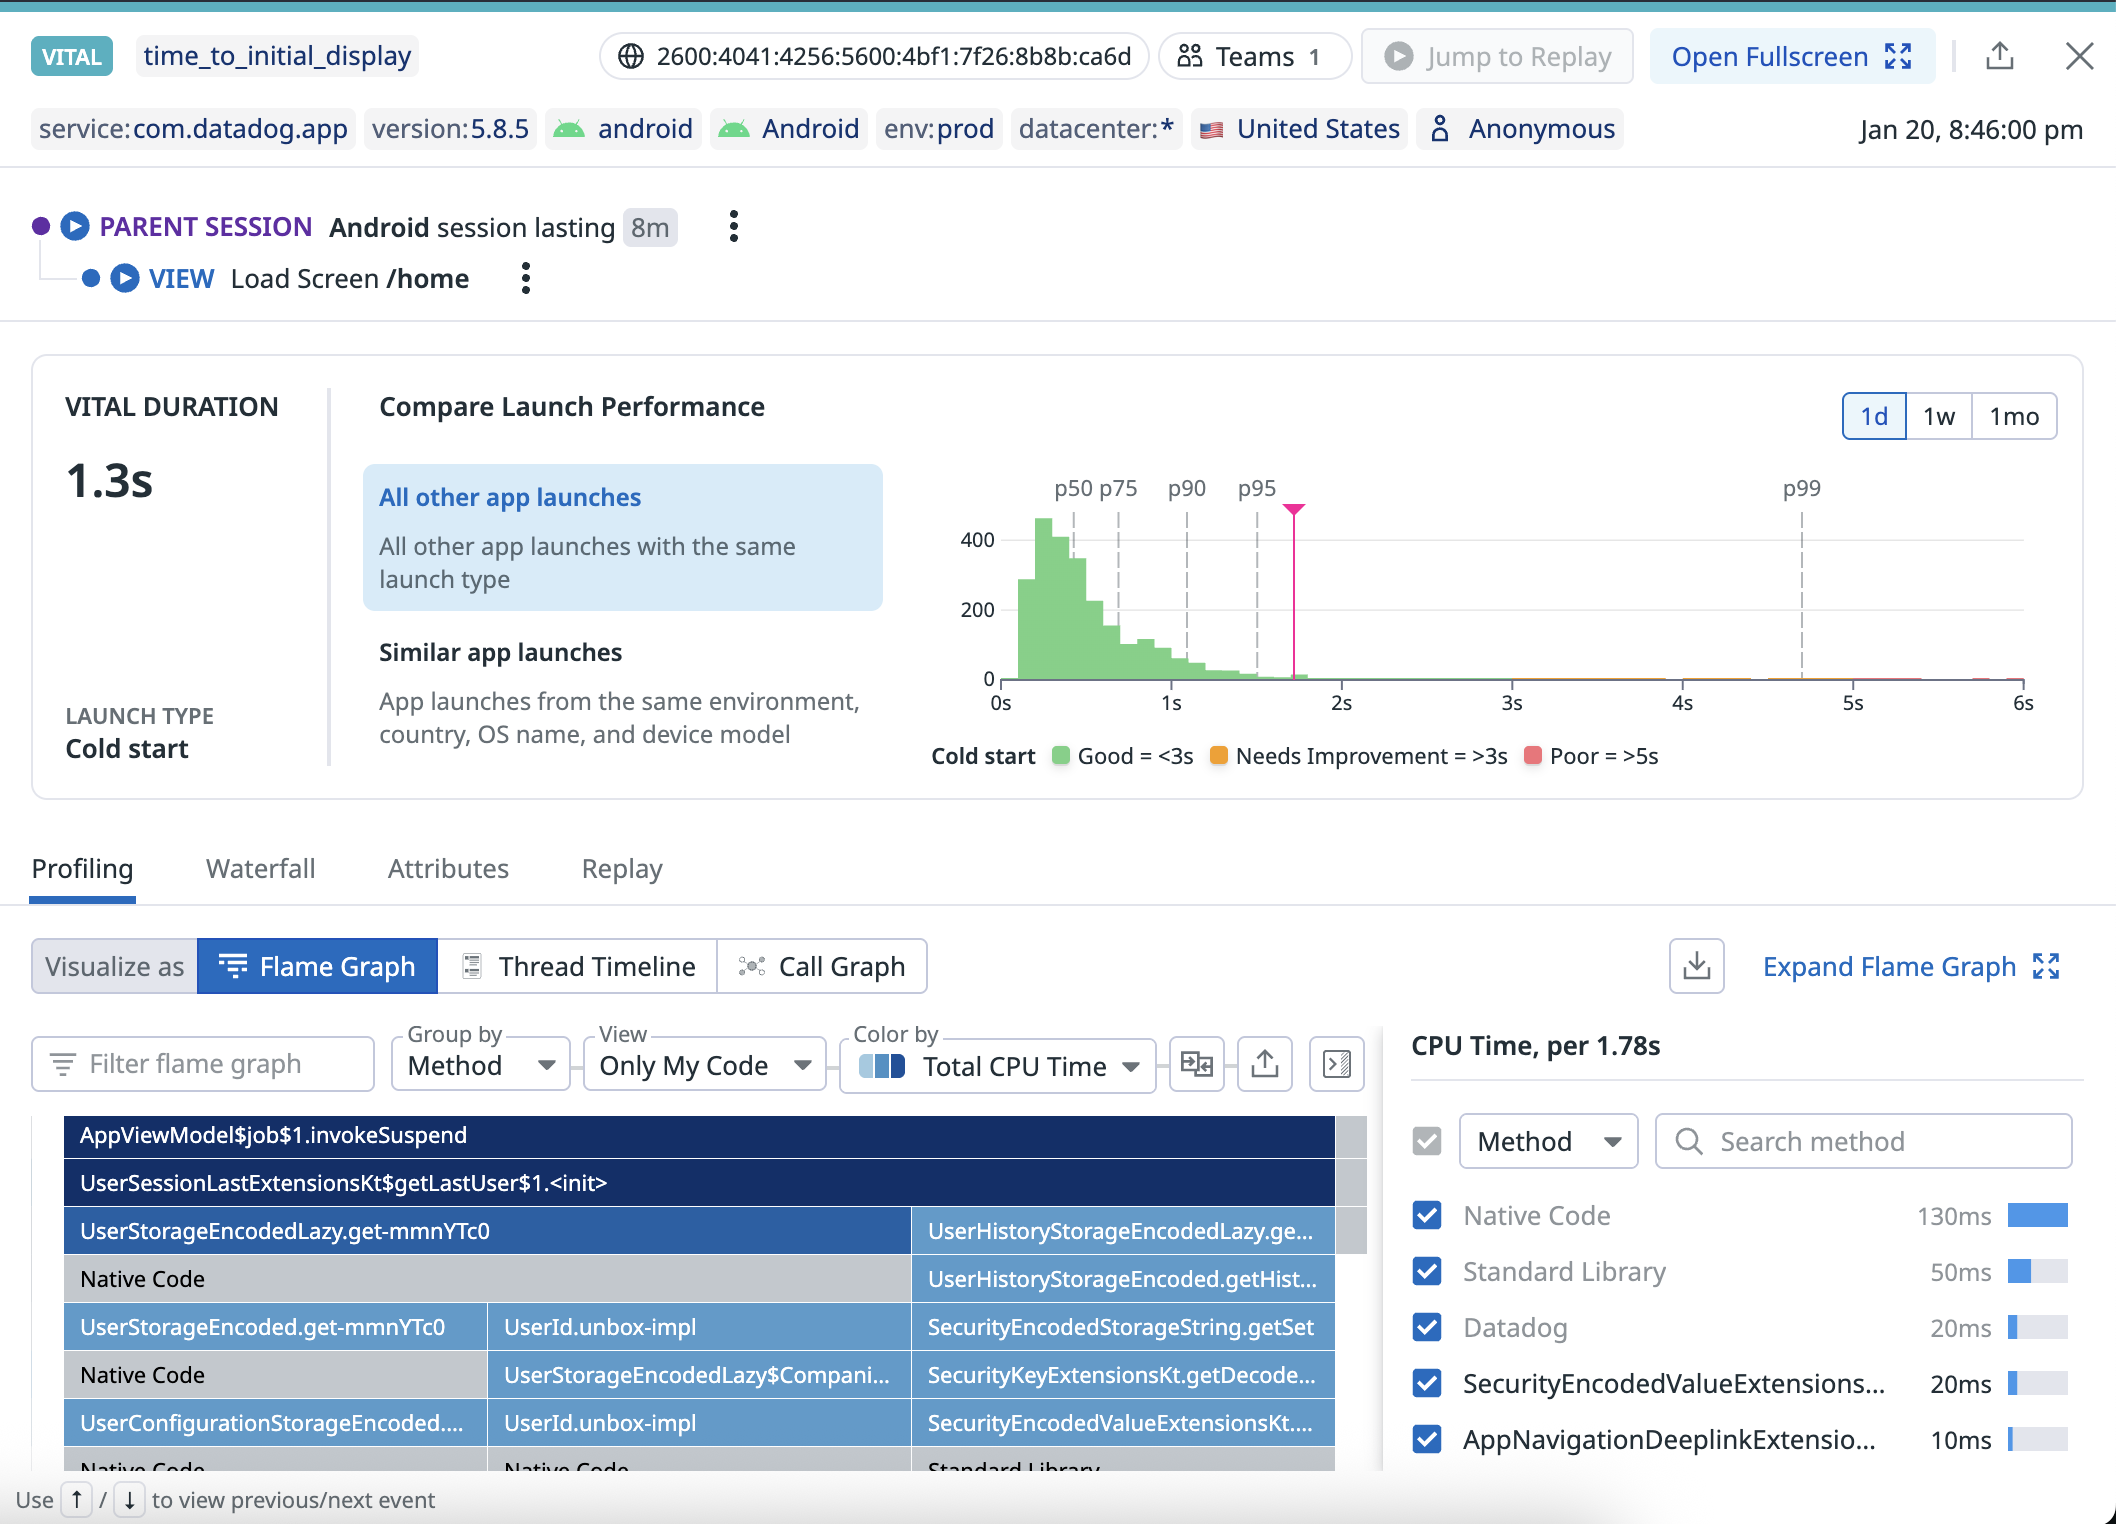
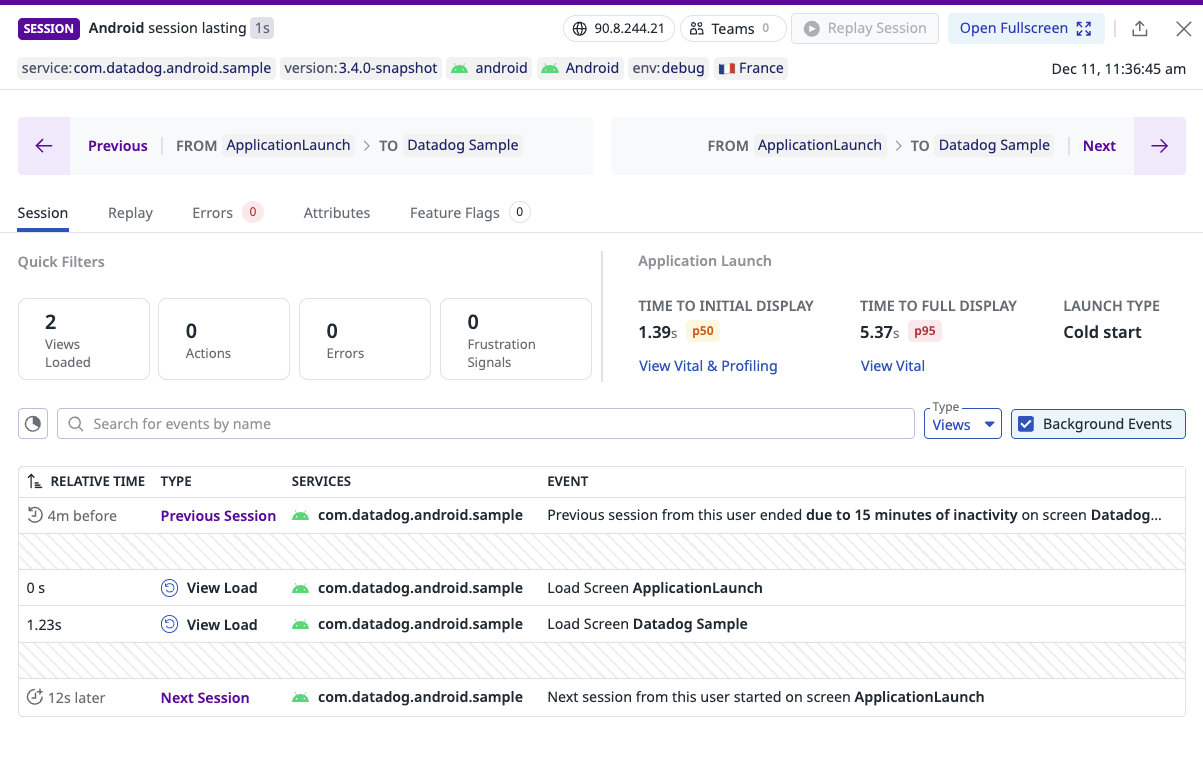
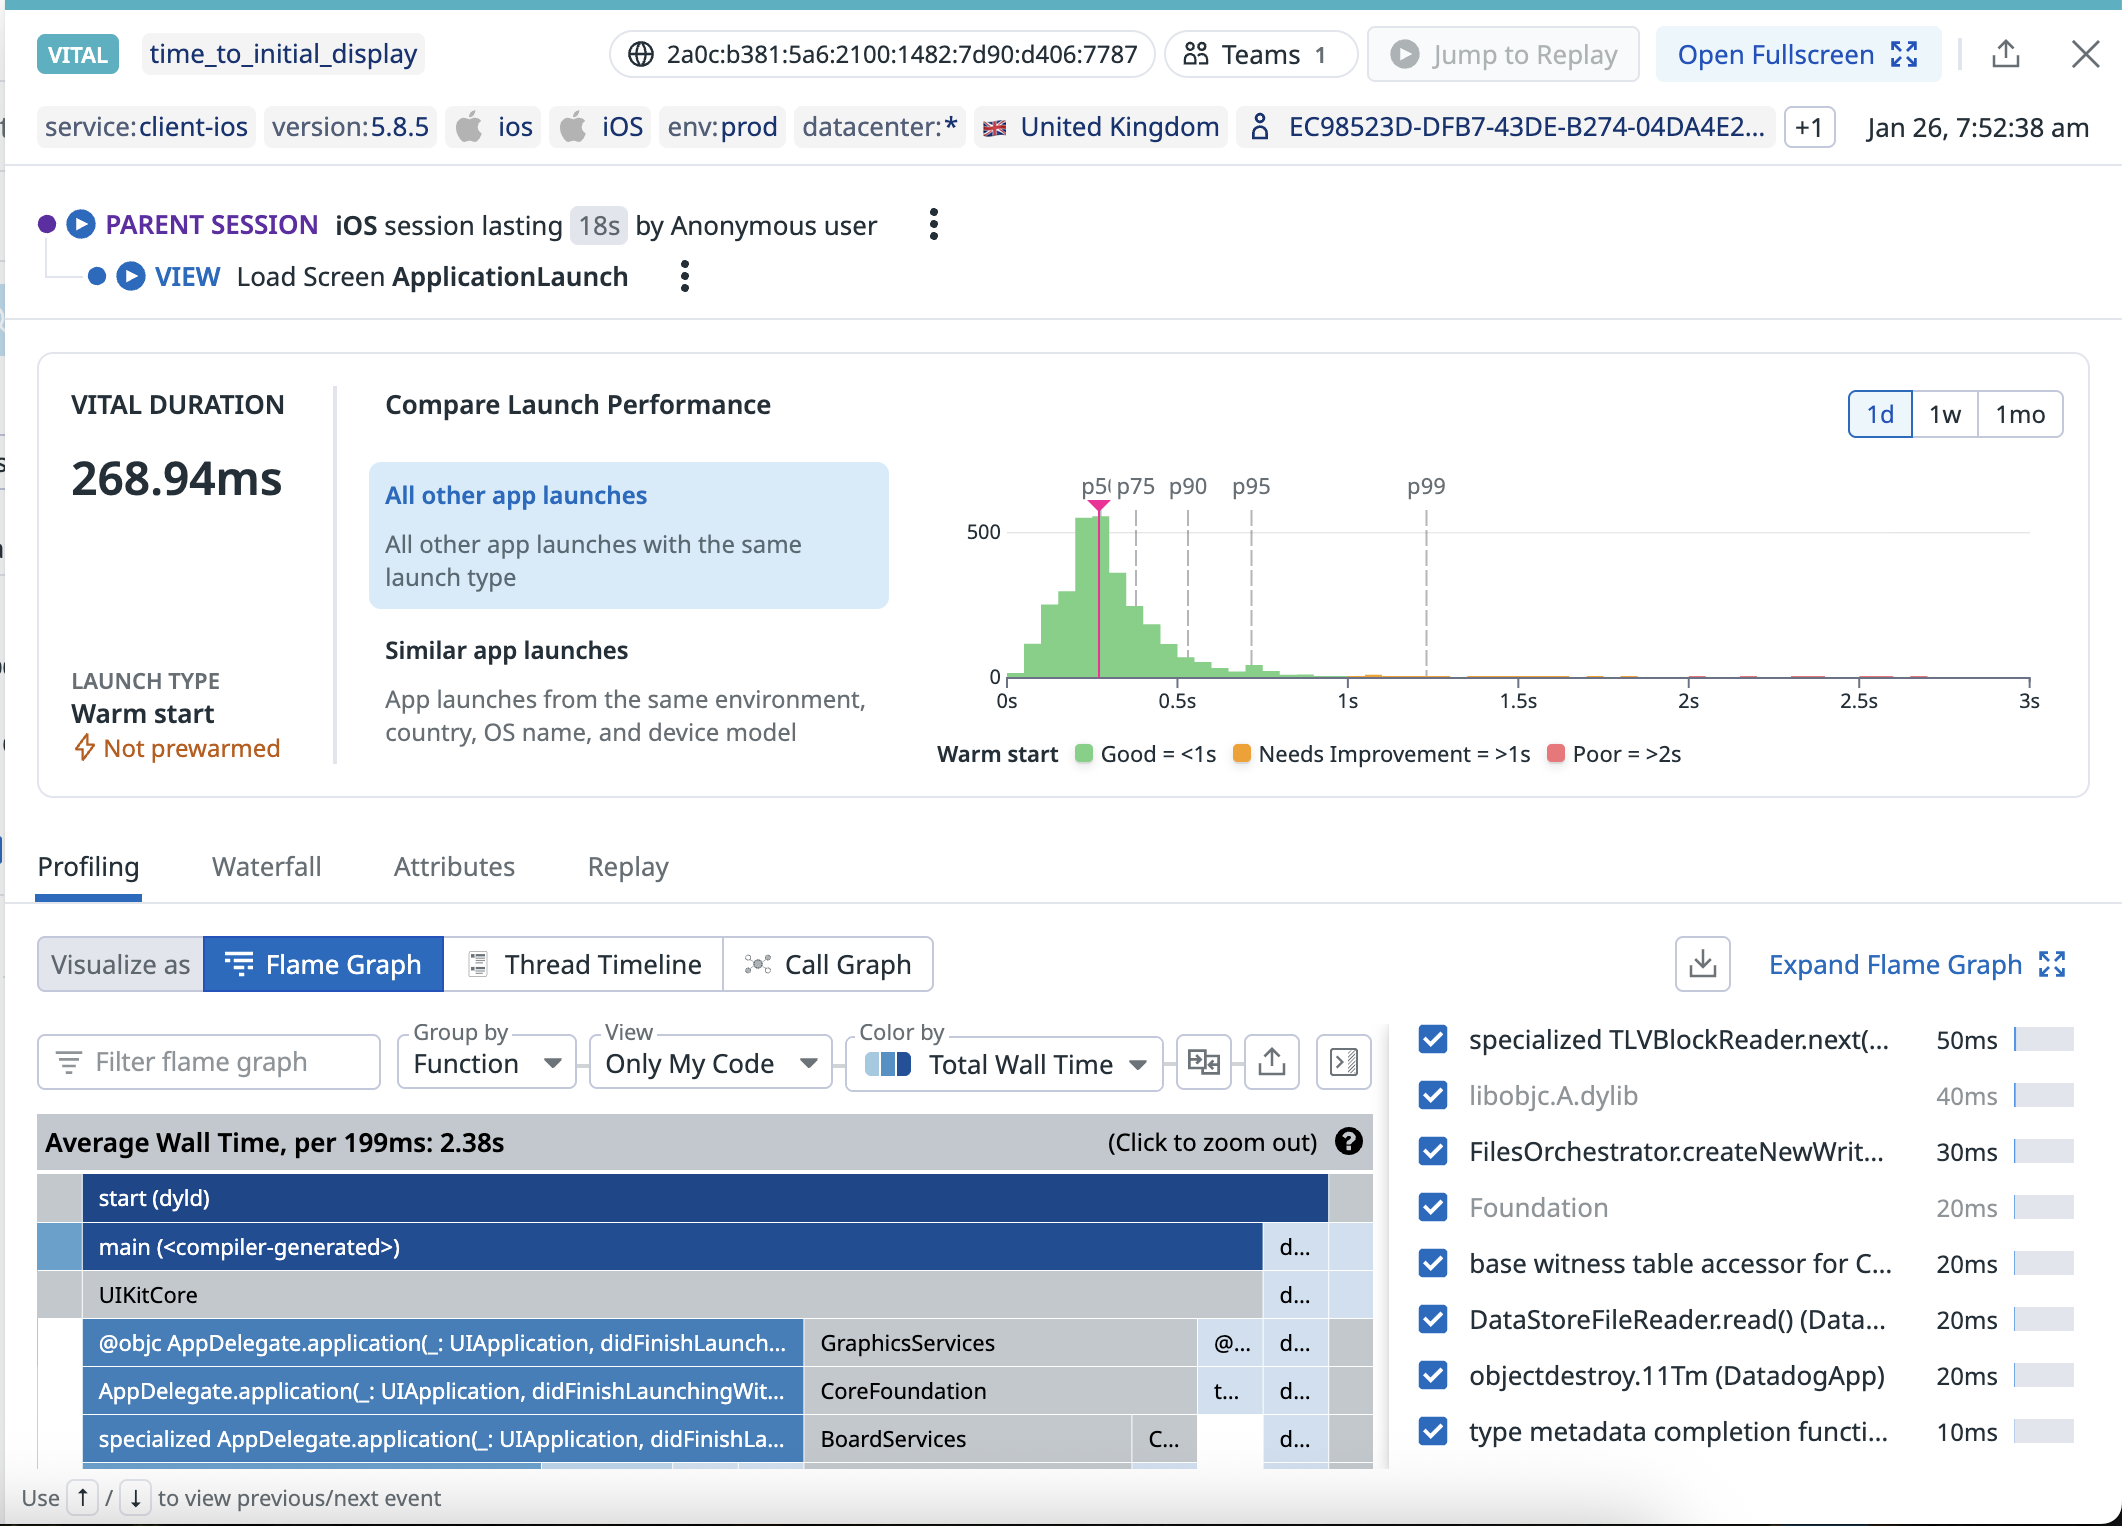
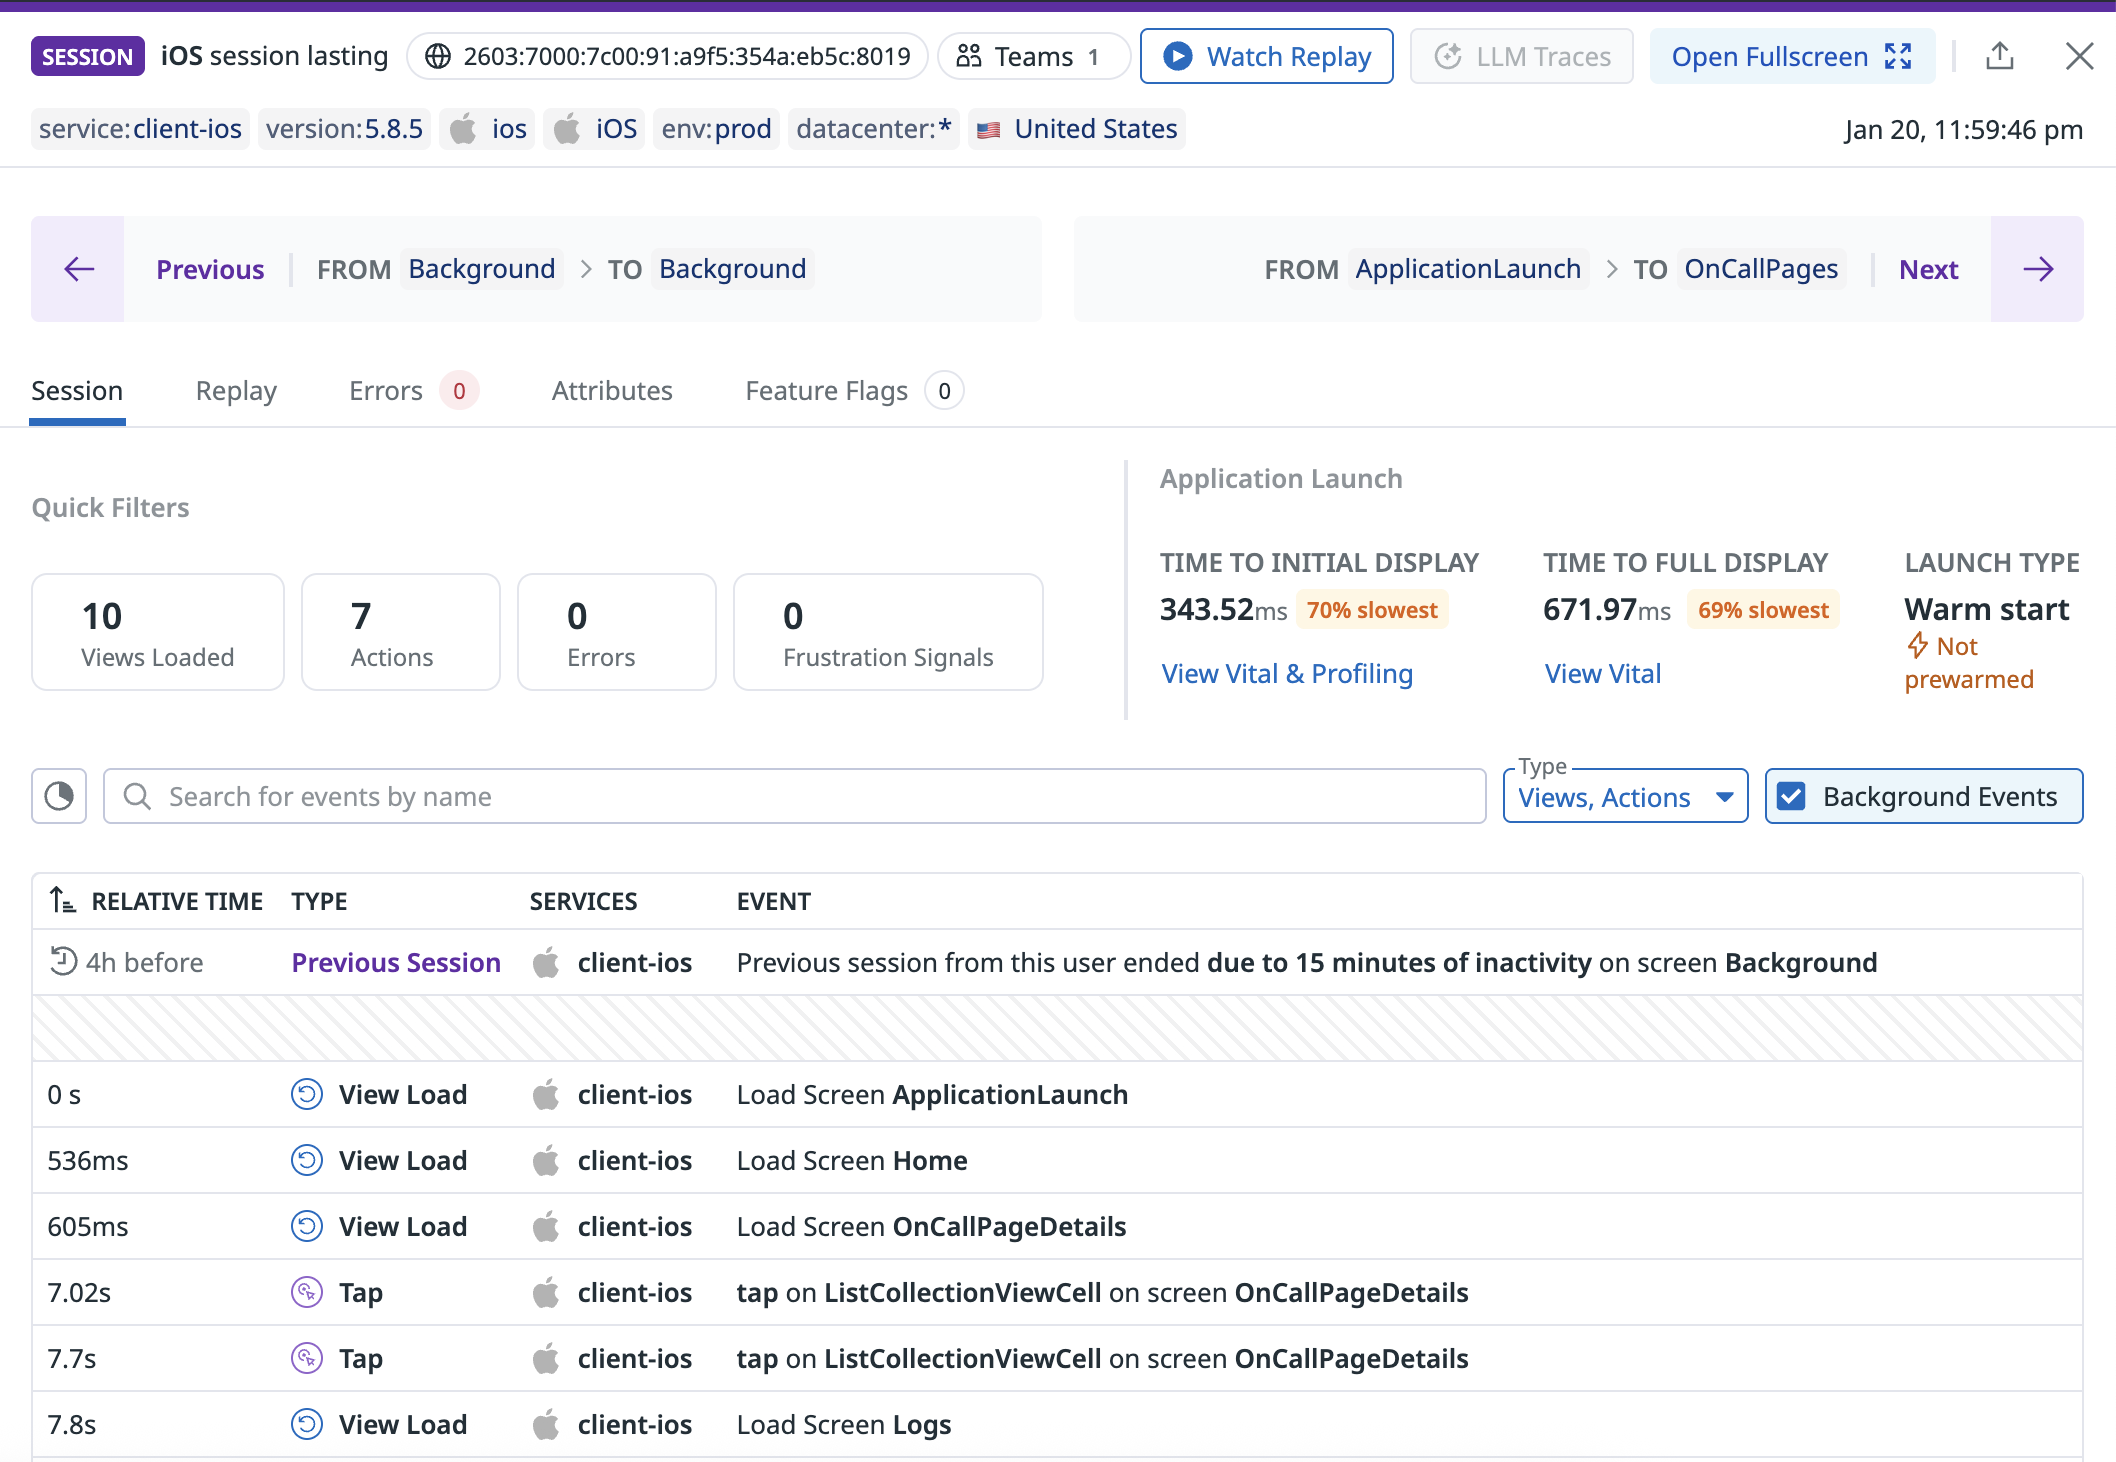
Android application launch profiling data is attached to the time to initial display vital event in a RUM session. You can access the time to initial display from the session side panel, view side panel, or directly from the time to initial display vital side panel.
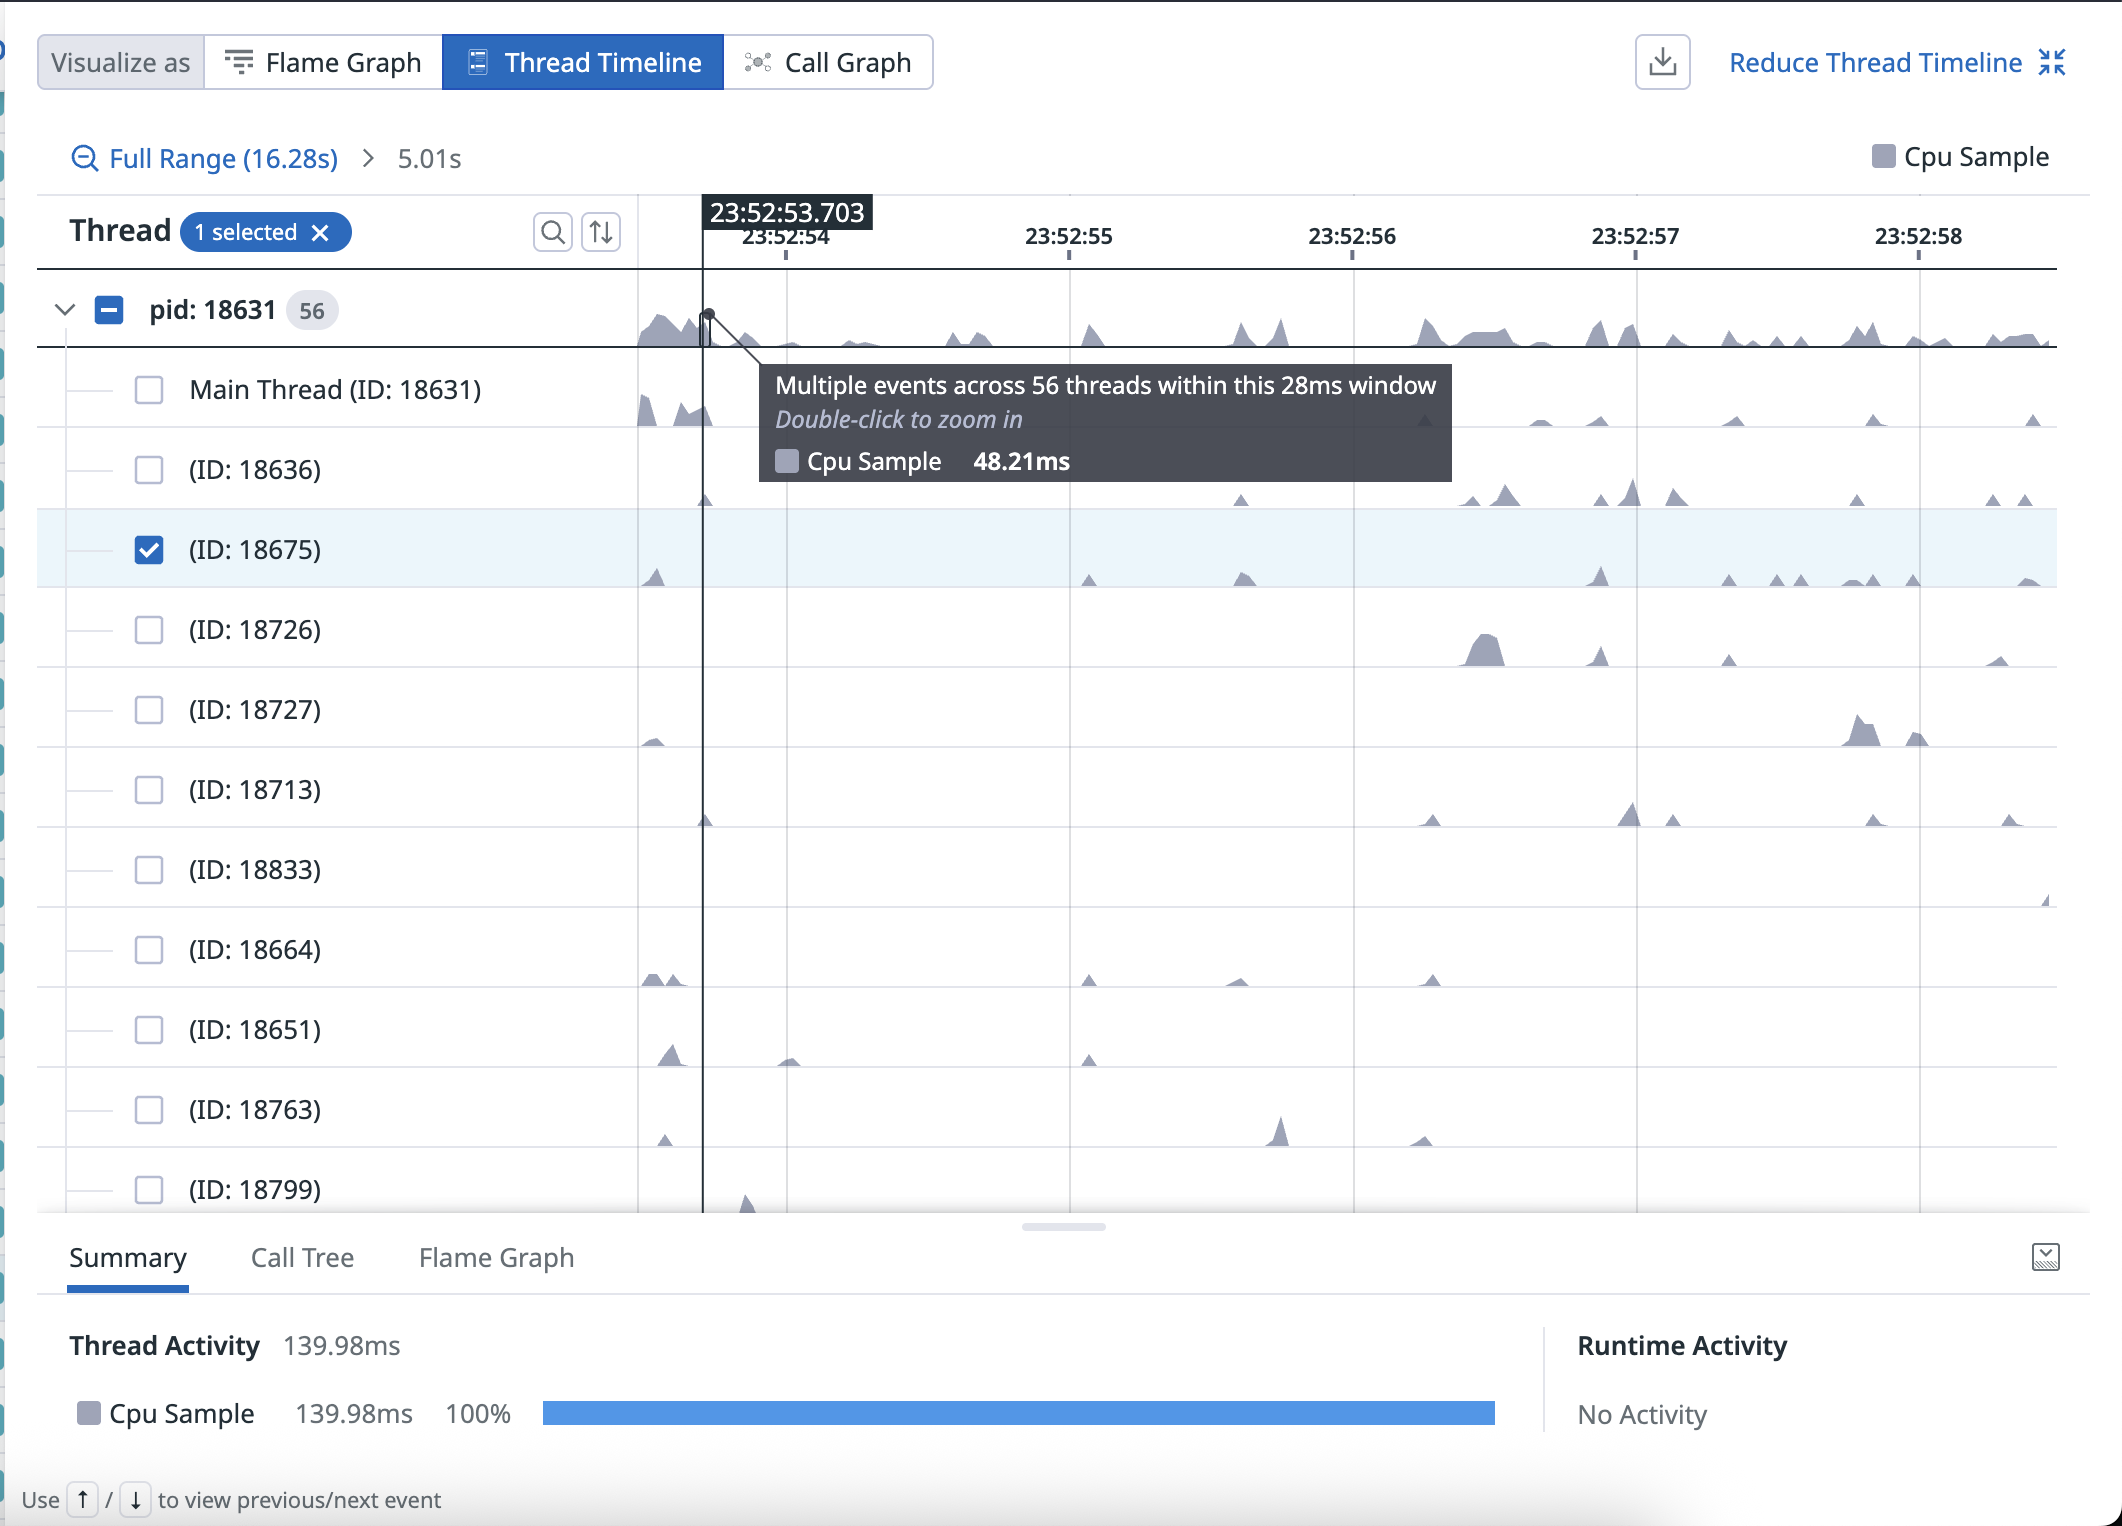
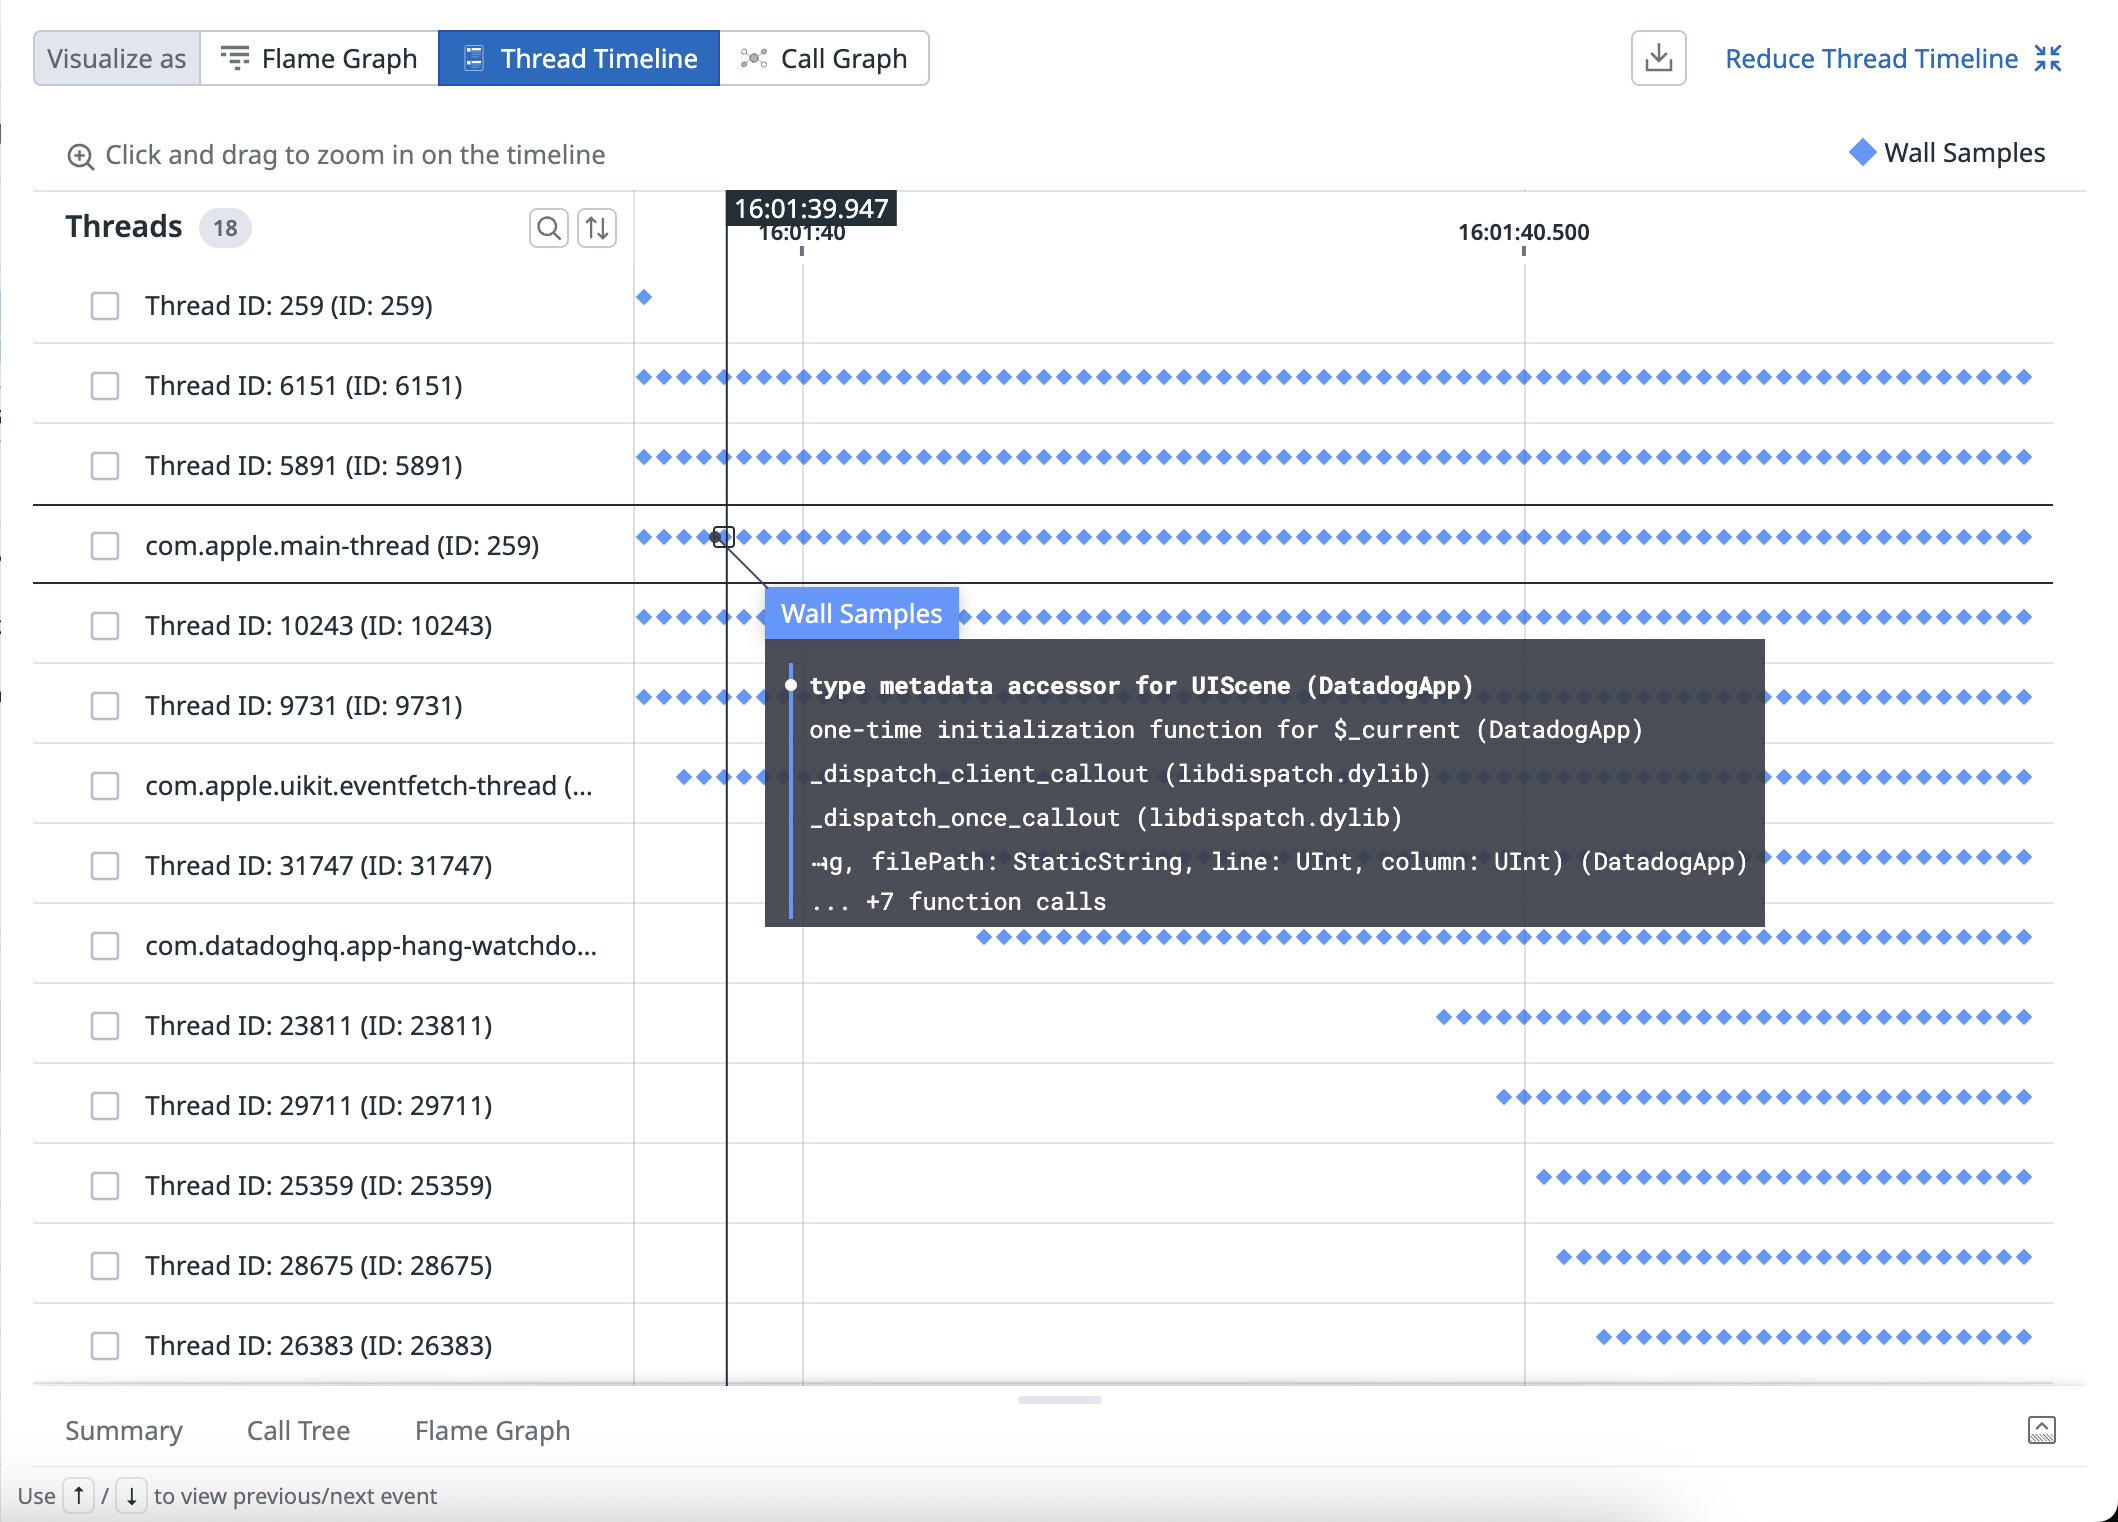
Use the flame graph to identify which methods consume the most CPU time during launch, the thread timeline to see parallel execution patterns, and the call graph to trace method dependencies. You can also download the profiling data for external analysis or deeper investigation.
iOS profiling captures detailed data about your application's performance during launch, helping you identify slow functions and optimize startup time. iOS profiling is built on top of the mach Kernel API and periodically samples all application threads to collect call stacks.
Prerequisites
- Your iOS application must use the Datadog iOS SDK version 3.6.0+.
- RUM without Limits must be enabled in your organization.
Setup
Step 1 - Set up RUM
To start collecting data, set up Mobile RUM for iOS.
Step 2 - Configure the profiling sampling rate
Initialize the RUM SDK and configure the applicationLaunchSampleRate, which determines the percentage of application launches that are profiled (for example, 5% means profiling runs on 5 out of 100 launches).
If no value is specified, the default applicationLaunchSampleRate is 5 percent.
    import DatadogCore
    import DatadogRUM
    import DatadogProfiling

    // Initialize Datadog SDK with your configuration
    Datadog.initialize(
      with: Datadog.Configuration(
        clientToken: "<client token>",  // From Datadog UI
        env: "<environment>",           // for example, "production", "staging"
        service: "<service name>"       // Your app's service name
      ),
      trackingConsent: trackingConsent  // GDPR compliance setting
    )

    // Enable RUM feature
    RUM.enable(
      with: RUM.Configuration(
        applicationID: "<rum application id>"
      )
    )

    // Enable Profiling feature
    Profiling.enable() // default is 5%
Explore profiling data
Profiling data is captured on vitals and rolls up to views and sessions. Use @profiling.has_profile in the Sessions Explorer to filter to profiled events and investigate which code ran and how it affected the user's experience. This is available for sessions, views, and vitals.
During the time to initial display
iOS application launch profiling data is attached to the time to initial display vital event in a RUM session. You can access the time to initial display from the session side panel, view side panel, or directly from the time to initial display vital side panel.
Use the flame graph to identify which functions consume the most Wall time during launch, the thread timeline to see parallel execution patterns, and the call graph to trace function dependencies. You can also download the profiling data for external analysis or deeper investigation.
Further reading
Additional helpful documentation, links, and articles:


