- 重要な情報
- はじめに
- 用語集
- Standard Attributes
- ガイド
- インテグレーション
- エージェント
- OpenTelemetry
- 開発者
- Administrator's Guide
- API
- Partners
- DDSQL Reference
- モバイルアプリケーション
- CoScreen
- CoTerm
- Remote Configuration
- Cloudcraft
- アプリ内
- ダッシュボード
- ノートブック
- DDSQL Editor
- Reference Tables
- Sheets
- Watchdog
- アラート設定
- メトリクス
- Bits AI
- Internal Developer Portal
- Error Tracking
- Change Tracking
- Service Management
- Actions & Remediations
- インフラストラクチャー
- Cloudcraft
- Resource Catalog
- ユニバーサル サービス モニタリング
- Hosts
- コンテナ
- Processes
- サーバーレス
- ネットワークモニタリング
- Cloud Cost
- アプリケーションパフォーマンス
- APM
- Continuous Profiler
- データベース モニタリング
- Data Streams Monitoring
- Data Jobs Monitoring
- Data Observability
- Digital Experience
- RUM & セッションリプレイ
- Synthetic モニタリング
- Continuous Testing
- Product Analytics
- Software Delivery
- CI Visibility (CI/CDの可視化)
- CD Visibility
- Deployment Gates
- Test Visibility
- Code Coverage
- Quality Gates
- DORA Metrics
- Feature Flags
- セキュリティ
- セキュリティの概要
- Cloud SIEM
- Code Security
- クラウド セキュリティ マネジメント
- Application Security Management
- Workload Protection
- Sensitive Data Scanner
- AI Observability
- ログ管理
- Observability Pipelines(観測データの制御)
- ログ管理
- CloudPrem
- 管理
Test Coverage
このページは日本語には対応しておりません。随時翻訳に取り組んでいます。
翻訳に関してご質問やご意見ございましたら、お気軽にご連絡ください。
翻訳に関してご質問やご意見ございましたら、お気軽にご連絡ください。
Overview
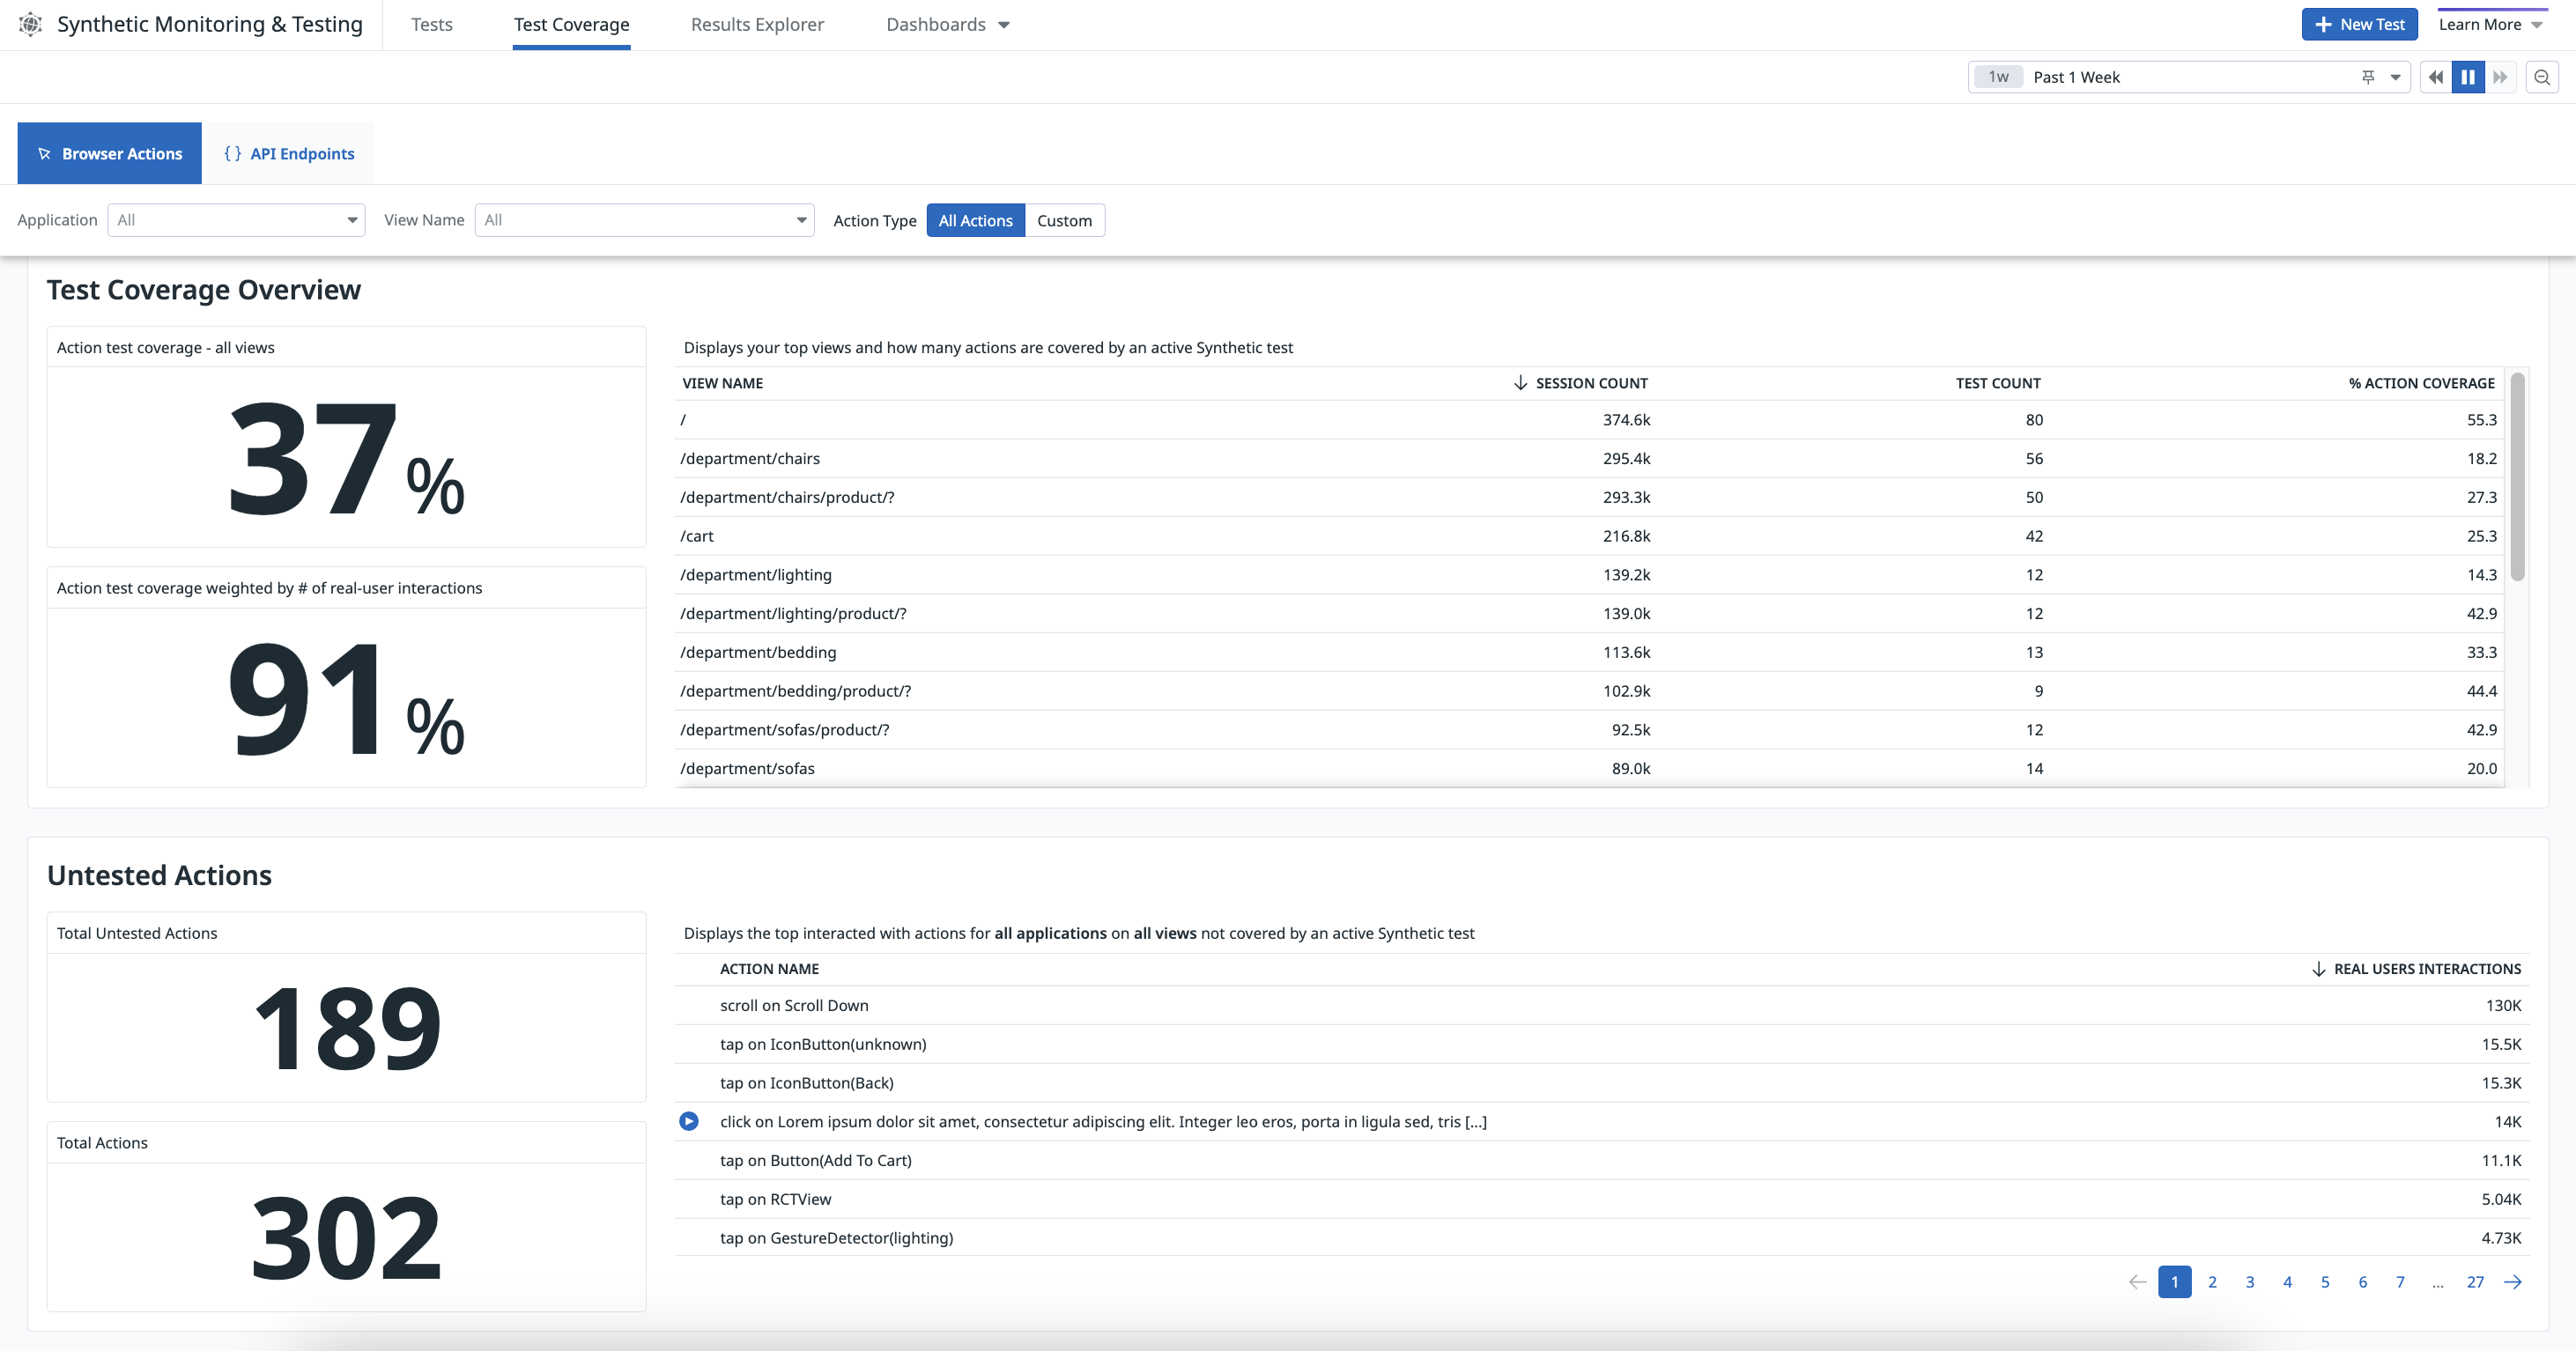
Explore your testing suite’s Synthetic test coverage of RUM browser actions on the Test Coverage page, which you can find under Digital Experience > Synthetic Monitoring & Testing.
The Test Coverage page provides actionable insight into the overall testing coverage of your RUM applications. It uses data collected from the Browser RUM SDK and results from Synthetic browser tests.
The Test Coverage page presents the following information:
- The top visited web pages
- The percentage of tested RUM actions
- The number of tested and total actions
- The number of browser tests covering actions
- The number of real user interactions
Investigate test coverage for an application or view
Build a more comprehensive, accurate testing suite by identifying untested actions and linking them with real user interactions on the Test Coverage page.
To identify areas in your application or views where you should create browser tests:
- Select a RUM application from the Application dropdown menu or a view from the View Name dropdown menu.
- Click Custom to filter the data on custom actions, which are unique and offer more accurate coverage results compared to generated actions. If you want to include generated actions in the test coverage analysis, select All Actions.
- Identify gaps in your test coverage by examining the information presented in the following sections:
- Test Coverage Overview
- Displays the percentage of actions being tested, the percentage of actions being tested weighted by the number of real user interactions, and a list of top views with their counts of user sessions and browser tests, and the percentage of actions being tested.
- Untested Actions
- Displays the number of untested user actions, the number of total actions collected, and a list of top actions that real users most interact with but are not being tested.
- Tested Actions
- Displays the number of browser tests covering user actions, the number of real user interactions, and a list of top actions that real users most interact with and are being tested.
The Test Coverage page populates actions that are extensively used, and hides actions that are less commonly used in your application. For more information about the data displayed, see Synthetic Monitoring Metrics.
View replays and add tests
Use the information on the Test Coverage page to answer the following questions:
- What actions are not being tested in your application?
- What views are the most popular to your users?
- What actions need more browser tests?
- What percentage of browser tests are covering user actions?
View session replays
Click on the Play icon next to an action in the Untested Actions table to examine a recording of real user interaction in Session Replay.
Examine actions
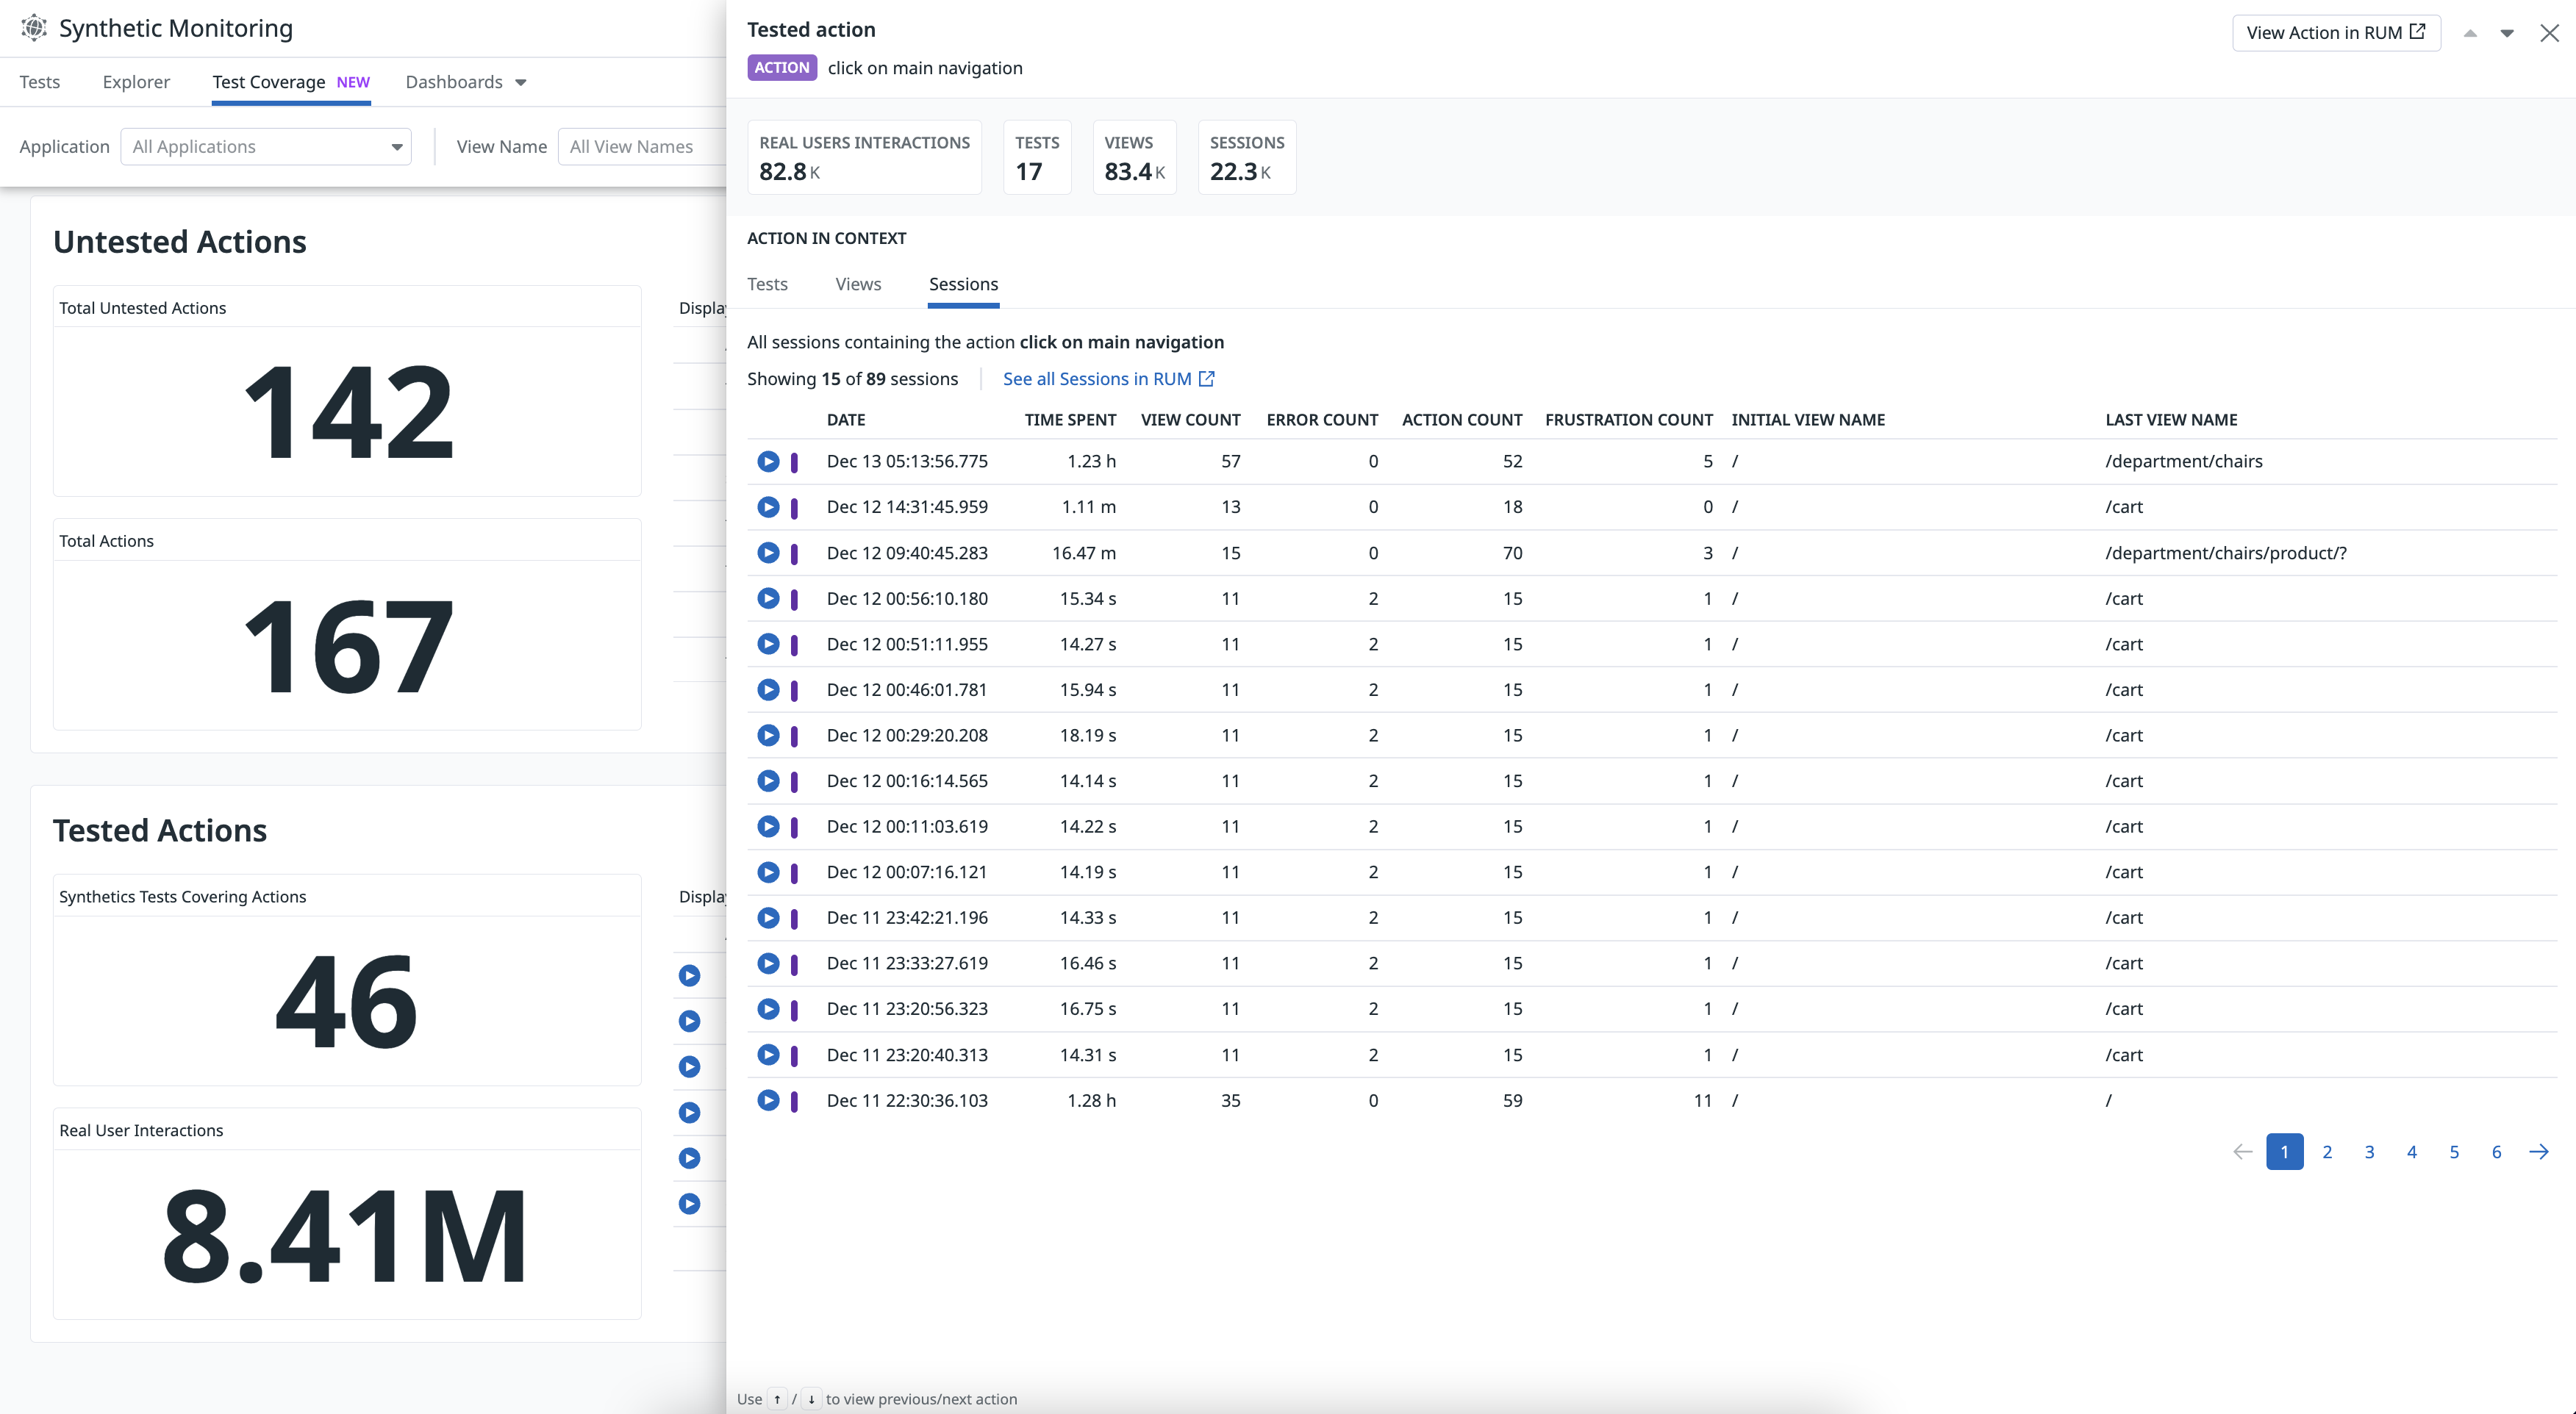
Click on an action to access the number of tests, views, sessions, and a subset of these tests, views, and sessions that include the selected action.
Add the most popular sections of your application to a new or existing browser test so that you are alerted when key user journeys in your application are negatively impacted by a code change.
To create a test, click + New Test on the top right of the Test Coverage page. You can run tests directly in your CI/CD pipelines to ensure no regressions occur before releasing code in production.


