- 重要な情報
- はじめに
- 用語集
- Standard Attributes
- ガイド
- インテグレーション
- エージェント
- OpenTelemetry
- 開発者
- Administrator's Guide
- API
- Partners
- DDSQL Reference
- モバイルアプリケーション
- CoScreen
- CoTerm
- Remote Configuration
- Cloudcraft
- アプリ内
- ダッシュボード
- ノートブック
- DDSQL Editor
- Reference Tables
- Sheets
- Watchdog
- アラート設定
- メトリクス
- Bits AI
- Internal Developer Portal
- Error Tracking
- Change Tracking
- Service Management
- Actions & Remediations
- インフラストラクチャー
- Cloudcraft
- Resource Catalog
- ユニバーサル サービス モニタリング
- Hosts
- コンテナ
- Processes
- サーバーレス
- ネットワークモニタリング
- Cloud Cost
- アプリケーションパフォーマンス
- APM
- Continuous Profiler
- データベース モニタリング
- Data Streams Monitoring
- Data Jobs Monitoring
- Data Observability
- Digital Experience
- RUM & セッションリプレイ
- Synthetic モニタリング
- Continuous Testing
- Product Analytics
- Software Delivery
- CI Visibility (CI/CDの可視化)
- CD Visibility
- Deployment Gates
- Test Visibility
- Code Coverage
- Quality Gates
- DORA Metrics
- Feature Flags
- セキュリティ
- セキュリティの概要
- Cloud SIEM
- Code Security
- クラウド セキュリティ マネジメント
- Application Security Management
- Workload Protection
- Sensitive Data Scanner
- AI Observability
- ログ管理
- Observability Pipelines(観測データの制御)
- ログ管理
- CloudPrem
- 管理
Analyze Error Logs Using Sheets
このページは日本語には対応しておりません。随時翻訳に取り組んでいます。
翻訳に関してご質問やご意見ございましたら、お気軽にご連絡ください。
翻訳に関してご質問やご意見ございましたら、お気軽にご連絡ください。
Overview
Datadog Sheets is a spreadsheet tool that you can populate with Datadog data to perform complex analyses and build reports without requiring technical expertise.
This guide walks through creating a table of error logs, adding calculated columns to extract specific error details from error messages, and using pivot tables to summarize the data and identify patterns. It also offers an example use case of this workflow.
Creating a table in Sheets
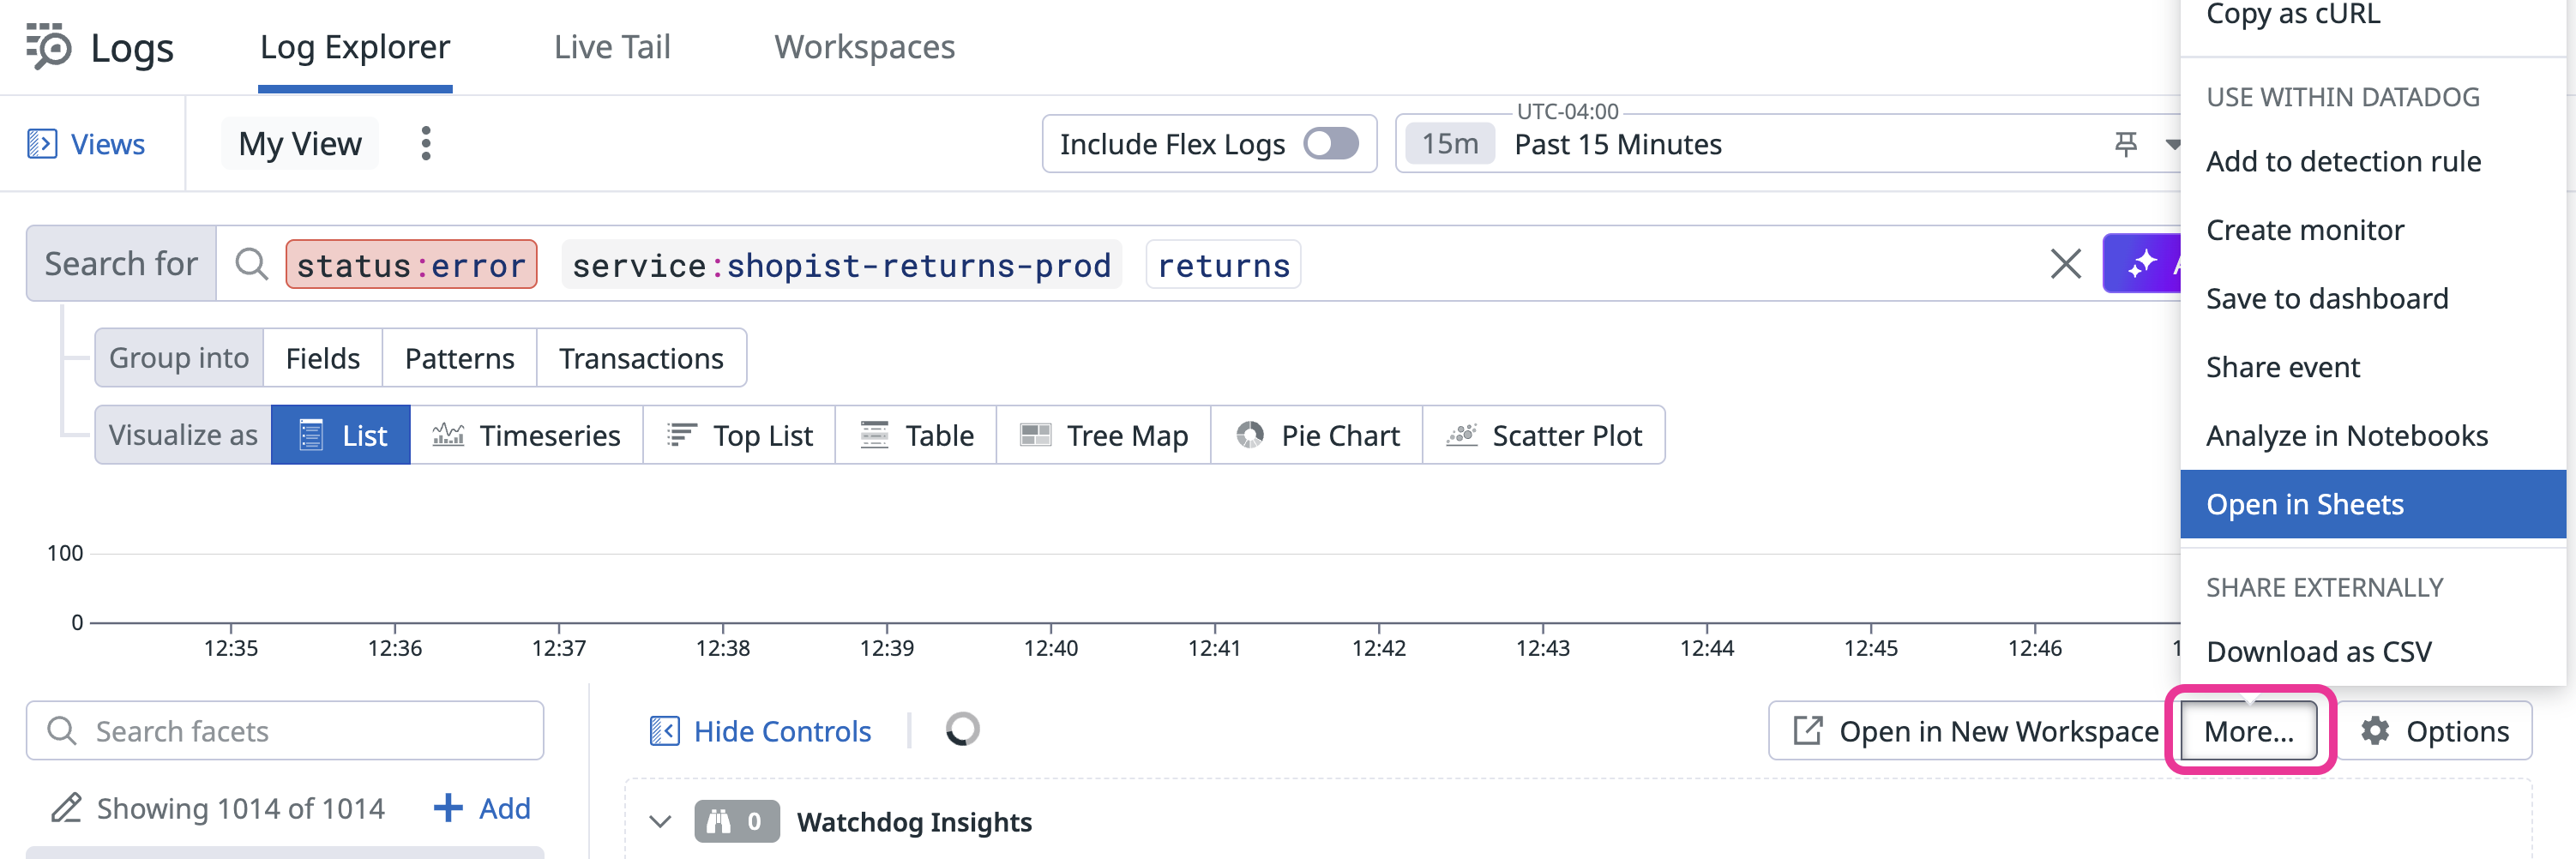
- Start from a supported product page, such as the Log Explorer.
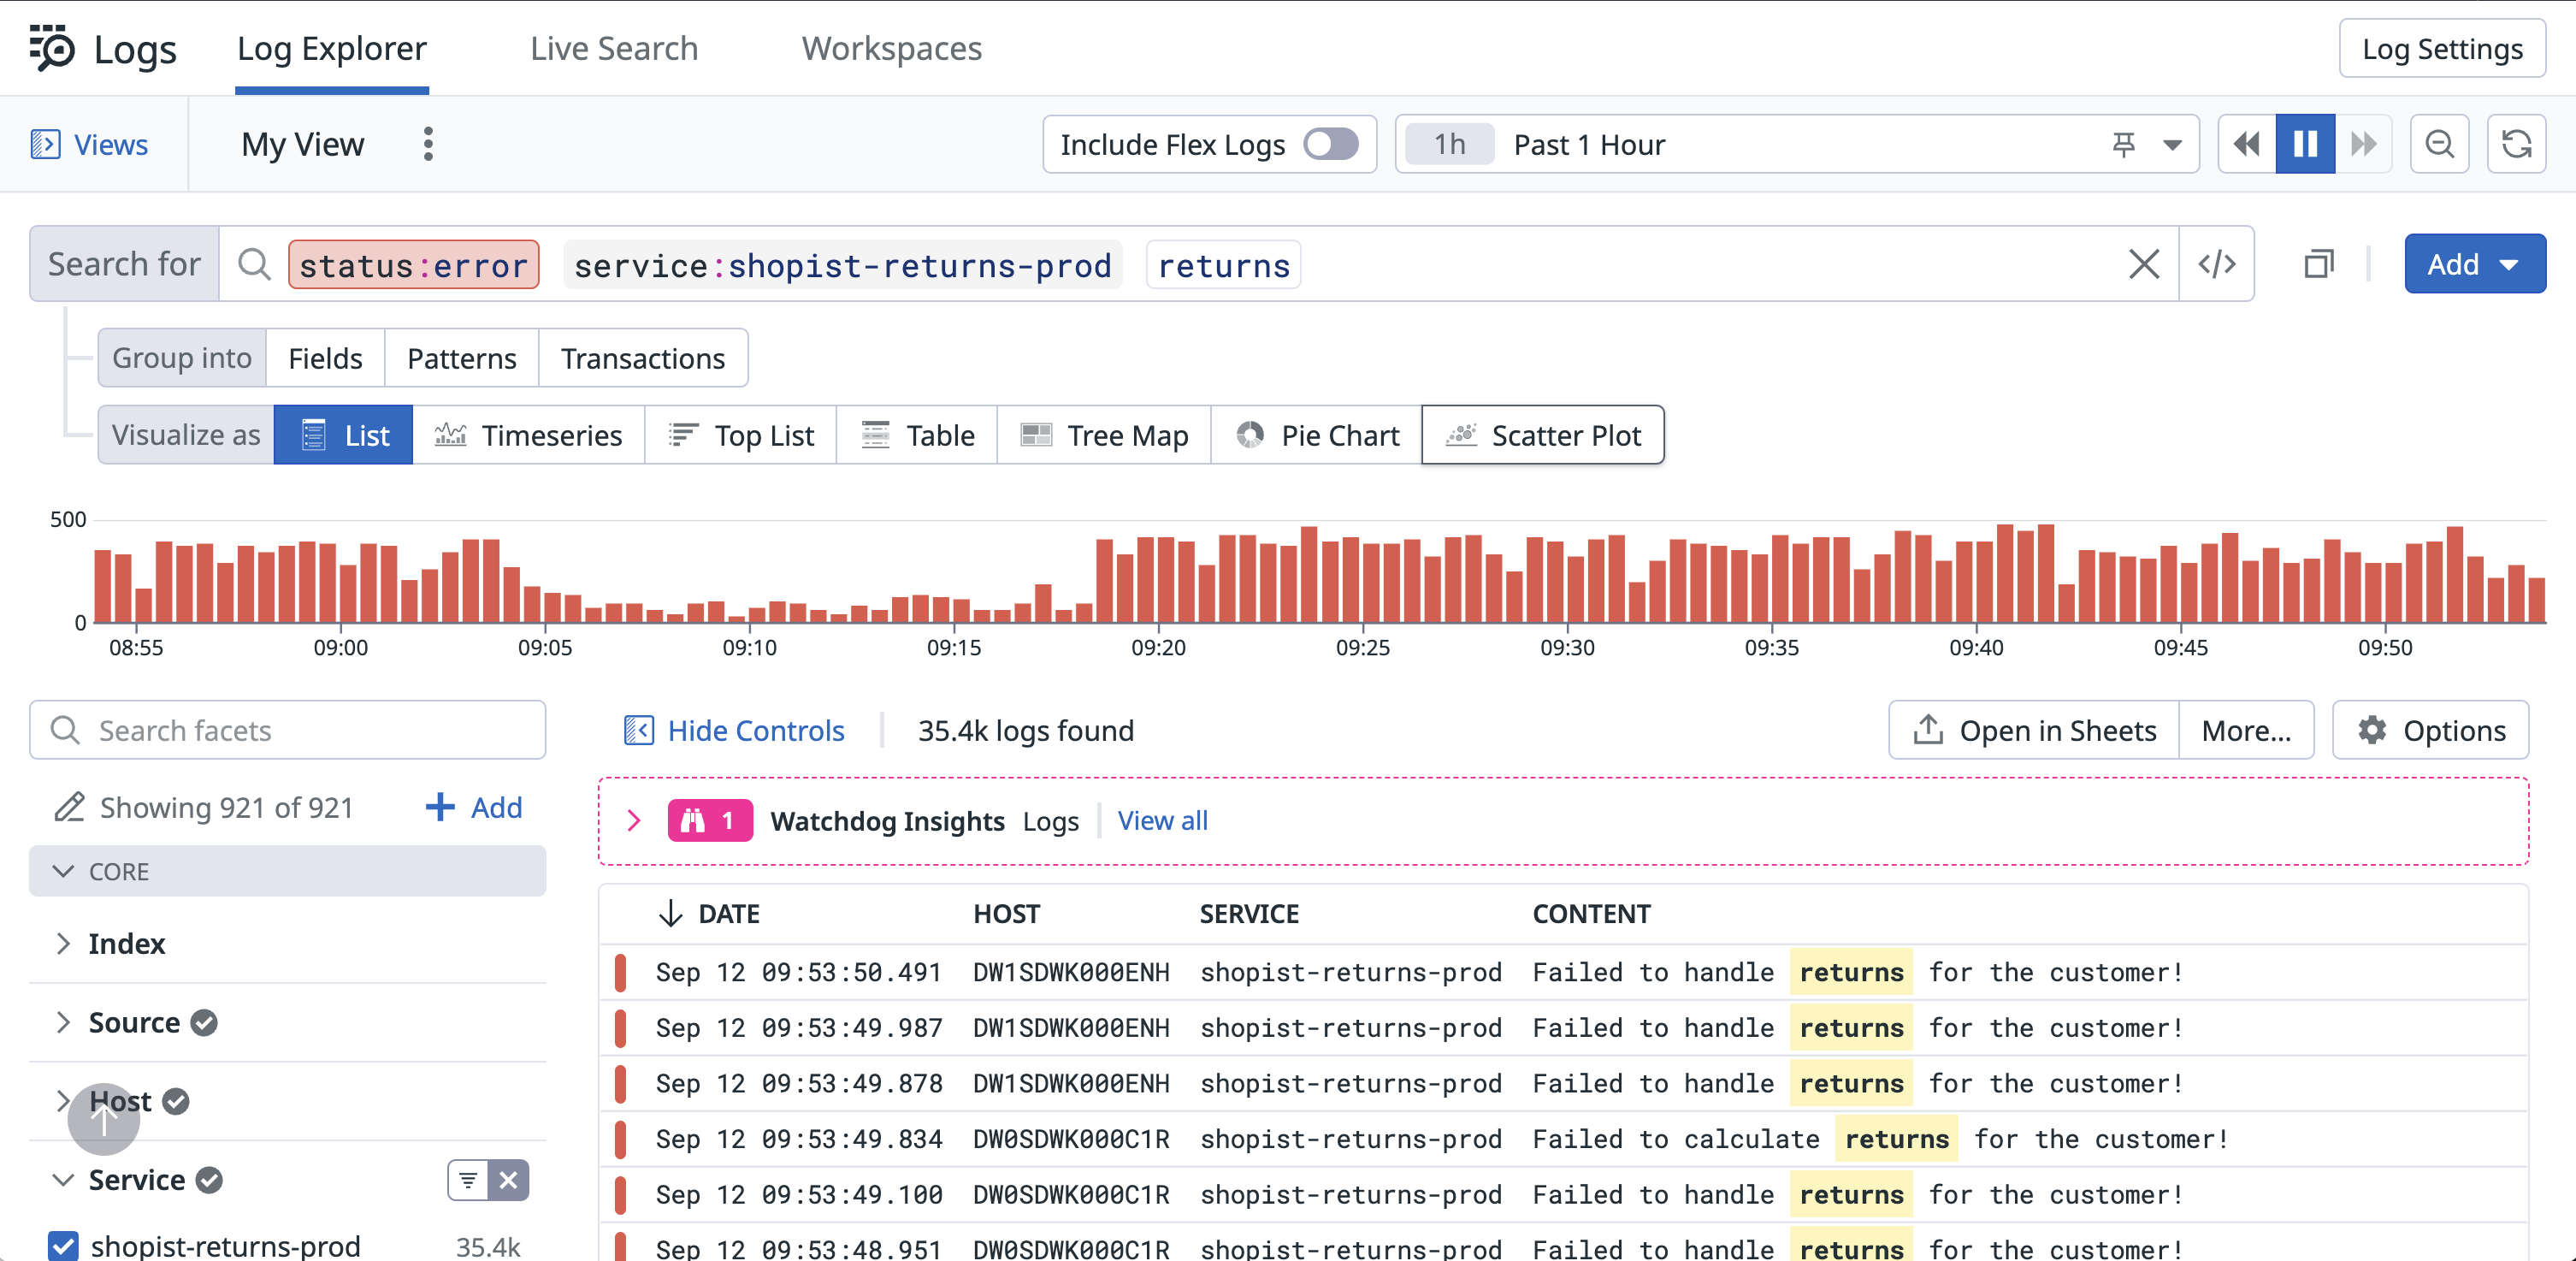
- Build the query of data that you want to analyze. For instance, to filter your logs to show only those with
status:errorthat contain the word “returns” in the log message:status:error service:shopist-returns-prod returns - Click Open in Sheets.
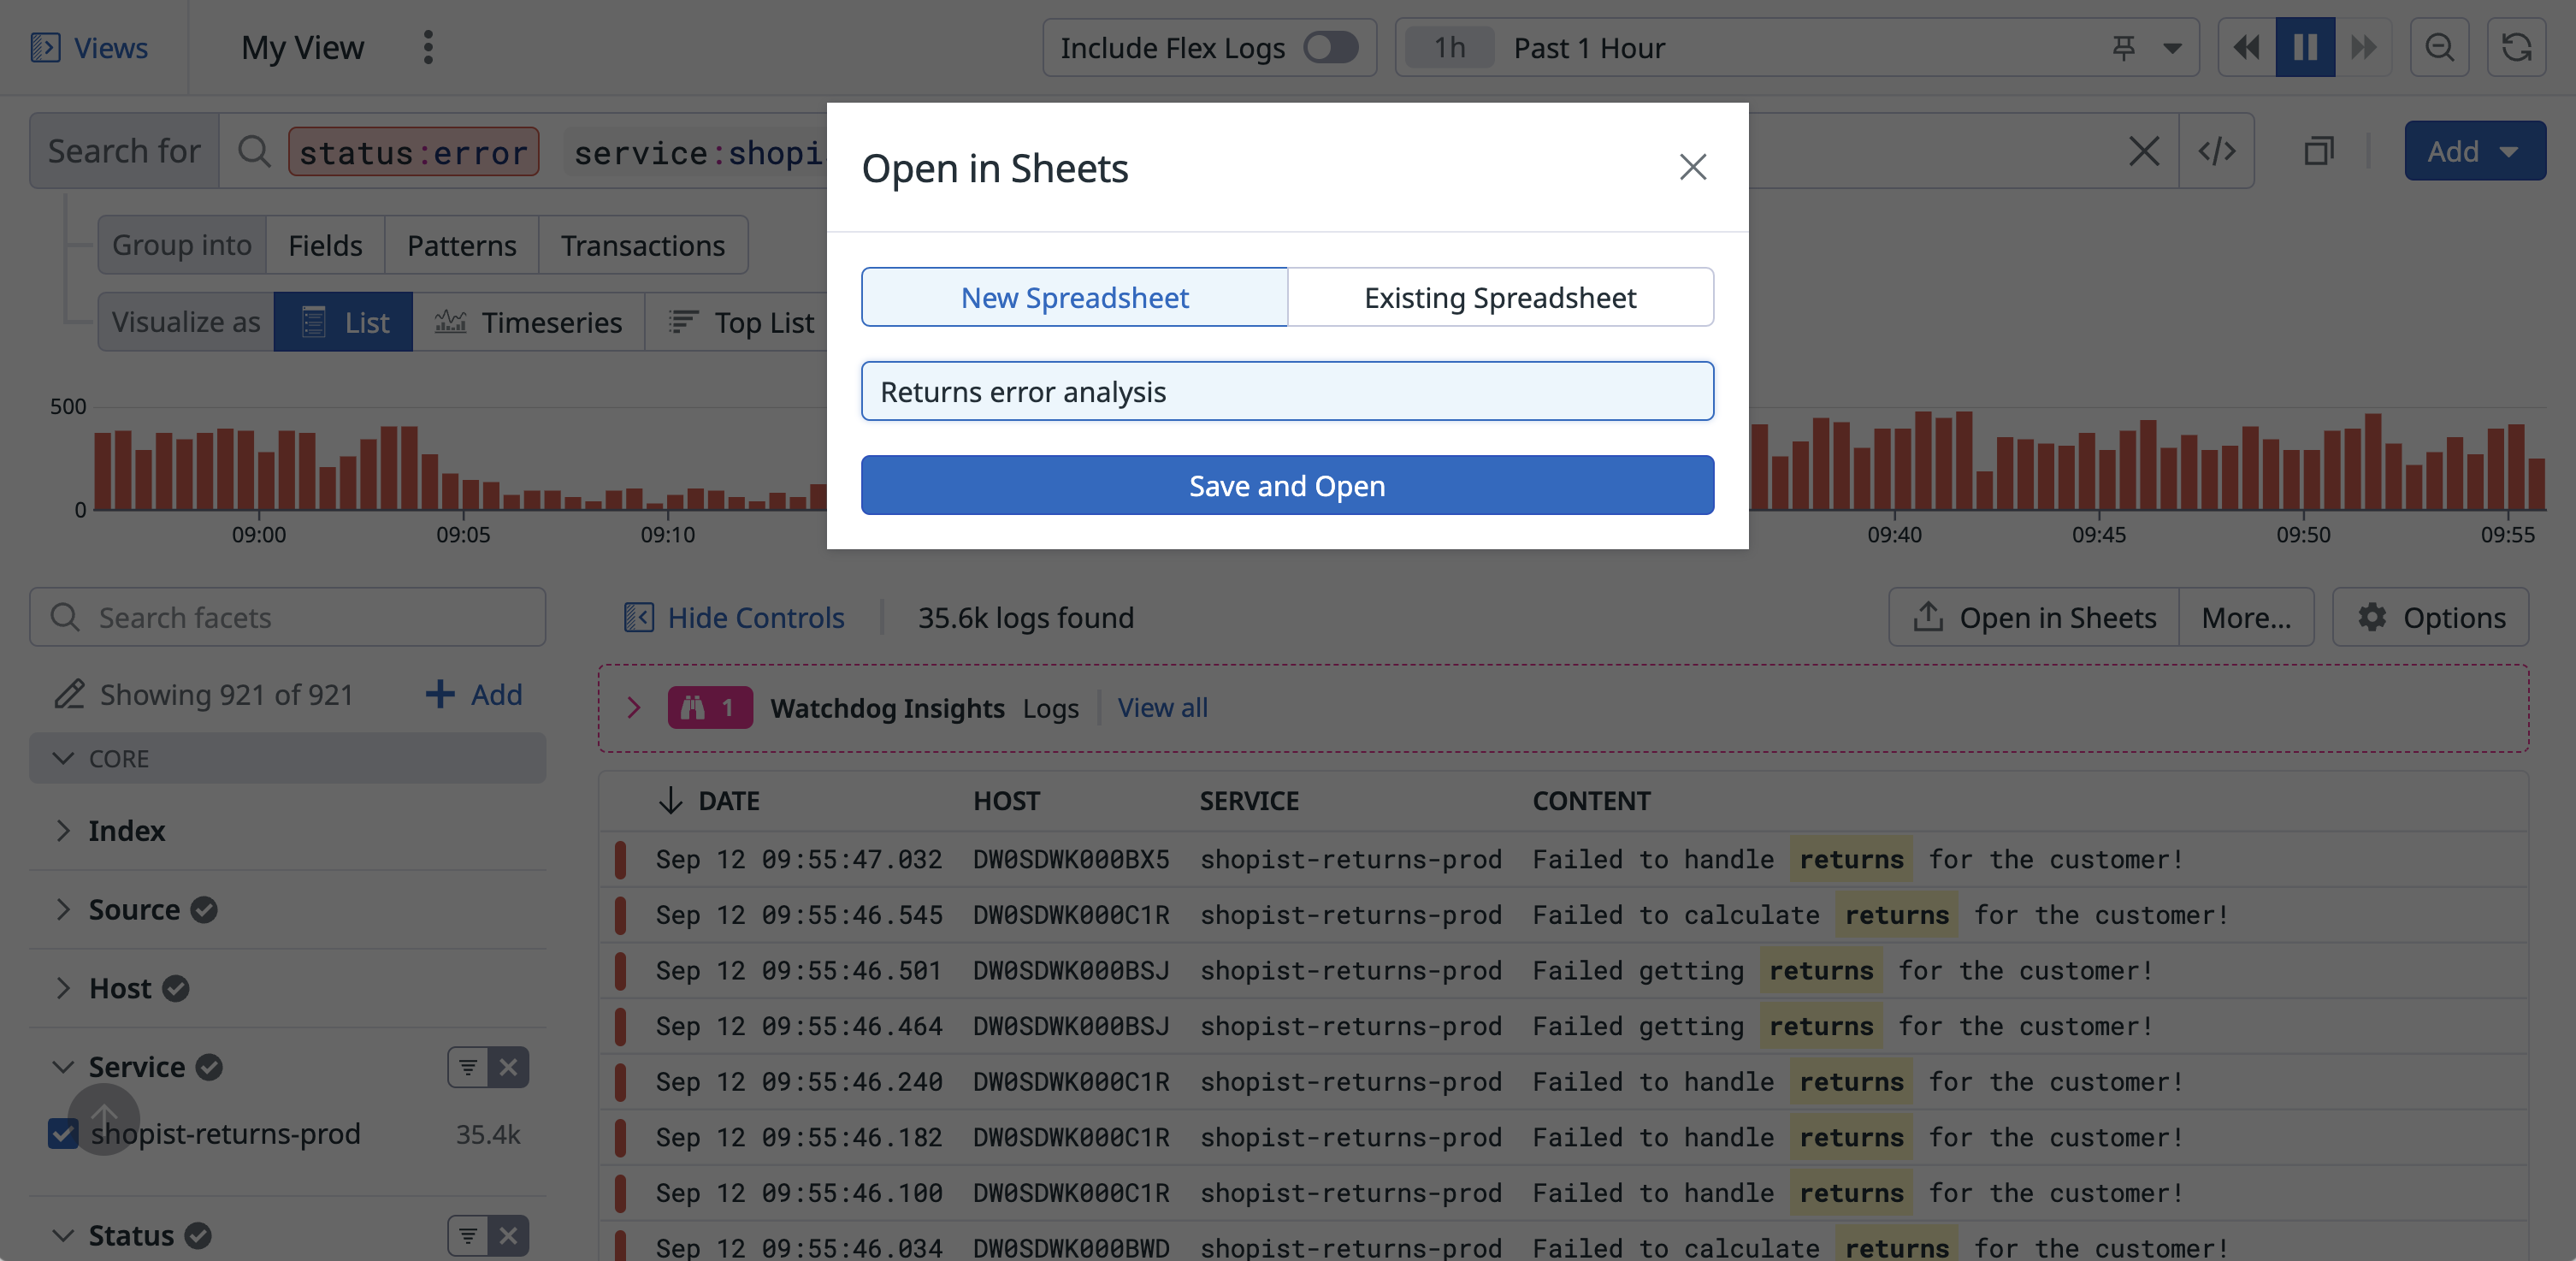
- Choose to create a New Spreadsheet or add the table to an Existing Spreadsheet.
- Click Save and Open.
Adding calculated columns
To gain more insight into your return errors, you might want to extract specific parts of the error messages. You can achieve this by adding calculated columns in Sheets.
- From the header of the far-right column of your table, click the Plus icon to add a calculated column.
- Use the
REGEXEXTRACTfunction to pull out the actual issue with the return. For example, to extract the next word after “Failed” or “Failed to”:This function helps you identify whether the error is in getting, calculating, or handling returns.=REGEXEXTRACT(#Message, "Failed (?:to )?(\w+)")
Using pivot tables for analysis
Pivot tables help you summarize and organize large datasets to find patterns and trends.
- From an existing spreadsheet that already has a table of data, click Add Pivot Table.
- In the Rows section, select the dimensions you want to analyze, such as the status of logs.
- In the Calculations section, choose the dimensions for calculations, like sum, average, count, min, and max.
Example use case: Analyzing retail application error logs
You have a retail web application that generates a series of error logs related to returns. You want to analyze what types of errors are causing these issues. Follow these steps to analyze your error logs, identify patterns, and gain insights into the underlying issues causing errors in your retail application. Apply this example to your logs to gain a deeper understanding of your logs and make data-driven decisions.
Example logs
Failed getting returns for the customer!Failed to calculate returns for the customer!Failed to handle returns for the customer!
Analyze error logs
- From the Logs Explorer, build a logs query that filters down to Error logs from your retail application with
returnsin the log message. For example:status:error service:shopist-returns-prod returns - Click Open in Sheets to create a new table to analyze these logs.
Extract specific error data
Add a calculated column in Sheets to pull out the specific issue with the return using the REGEXEXTRACT function:
=REGEXEXTRACT(#'Message', "Failed (?:to )?(\w+)")
Analyze error types
- Create a pivot table to count the number of errors per error type (
getting,calculating, andhandling). - Summarize the data to understand the distribution and total impact of each error type.


