- 重要な情報
- はじめに
- Datadog
- Datadog サイト
- DevSecOps
- AWS Lambda のサーバーレス
- エージェント
- インテグレーション
- コンテナ
- ダッシュボード
- アラート設定
- ログ管理
- トレーシング
- プロファイラー
- タグ
- API
- Service Catalog
- Session Replay
- Continuous Testing
- Synthetic モニタリング
- Incident Management
- Database Monitoring
- Cloud Security Management
- Cloud SIEM
- Application Security Management
- Workflow Automation
- CI Visibility
- Test Visibility
- Intelligent Test Runner
- Code Analysis
- Learning Center
- Support
- 用語集
- Standard Attributes
- ガイド
- インテグレーション
- エージェント
- OpenTelemetry
- 開発者
- 認可
- DogStatsD
- カスタムチェック
- インテグレーション
- Create an Agent-based Integration
- Create an API Integration
- Create a Log Pipeline
- Integration Assets Reference
- Build a Marketplace Offering
- Create a Tile
- Create an Integration Dashboard
- Create a Recommended Monitor
- Create a Cloud SIEM Detection Rule
- OAuth for Integrations
- Install Agent Integration Developer Tool
- サービスのチェック
- IDE インテグレーション
- コミュニティ
- ガイド
- Administrator's Guide
- API
- モバイルアプリケーション
- CoScreen
- Cloudcraft
- アプリ内
- Service Management
- インフラストラクチャー
- アプリケーションパフォーマンス
- APM
- Continuous Profiler
- データベース モニタリング
- Data Streams Monitoring
- Data Jobs Monitoring
- Digital Experience
- Software Delivery
- CI Visibility (CI/CDの可視化)
- CD Visibility
- Test Visibility
- Intelligent Test Runner
- Code Analysis
- Quality Gates
- DORA Metrics
- セキュリティ
- セキュリティの概要
- Cloud SIEM
- クラウド セキュリティ マネジメント
- Application Security Management
- AI Observability
- ログ管理
- Observability Pipelines(観測データの制御)
- ログ管理
- 管理
Testing and Deployment Dashboards
このページは日本語には対応しておりません。随時翻訳に取り組んでいます。
翻訳に関してご質問やご意見ございましたら、お気軽にご連絡ください。
翻訳に関してご質問やご意見ございましたら、お気軽にご連絡ください。
Testing coverage
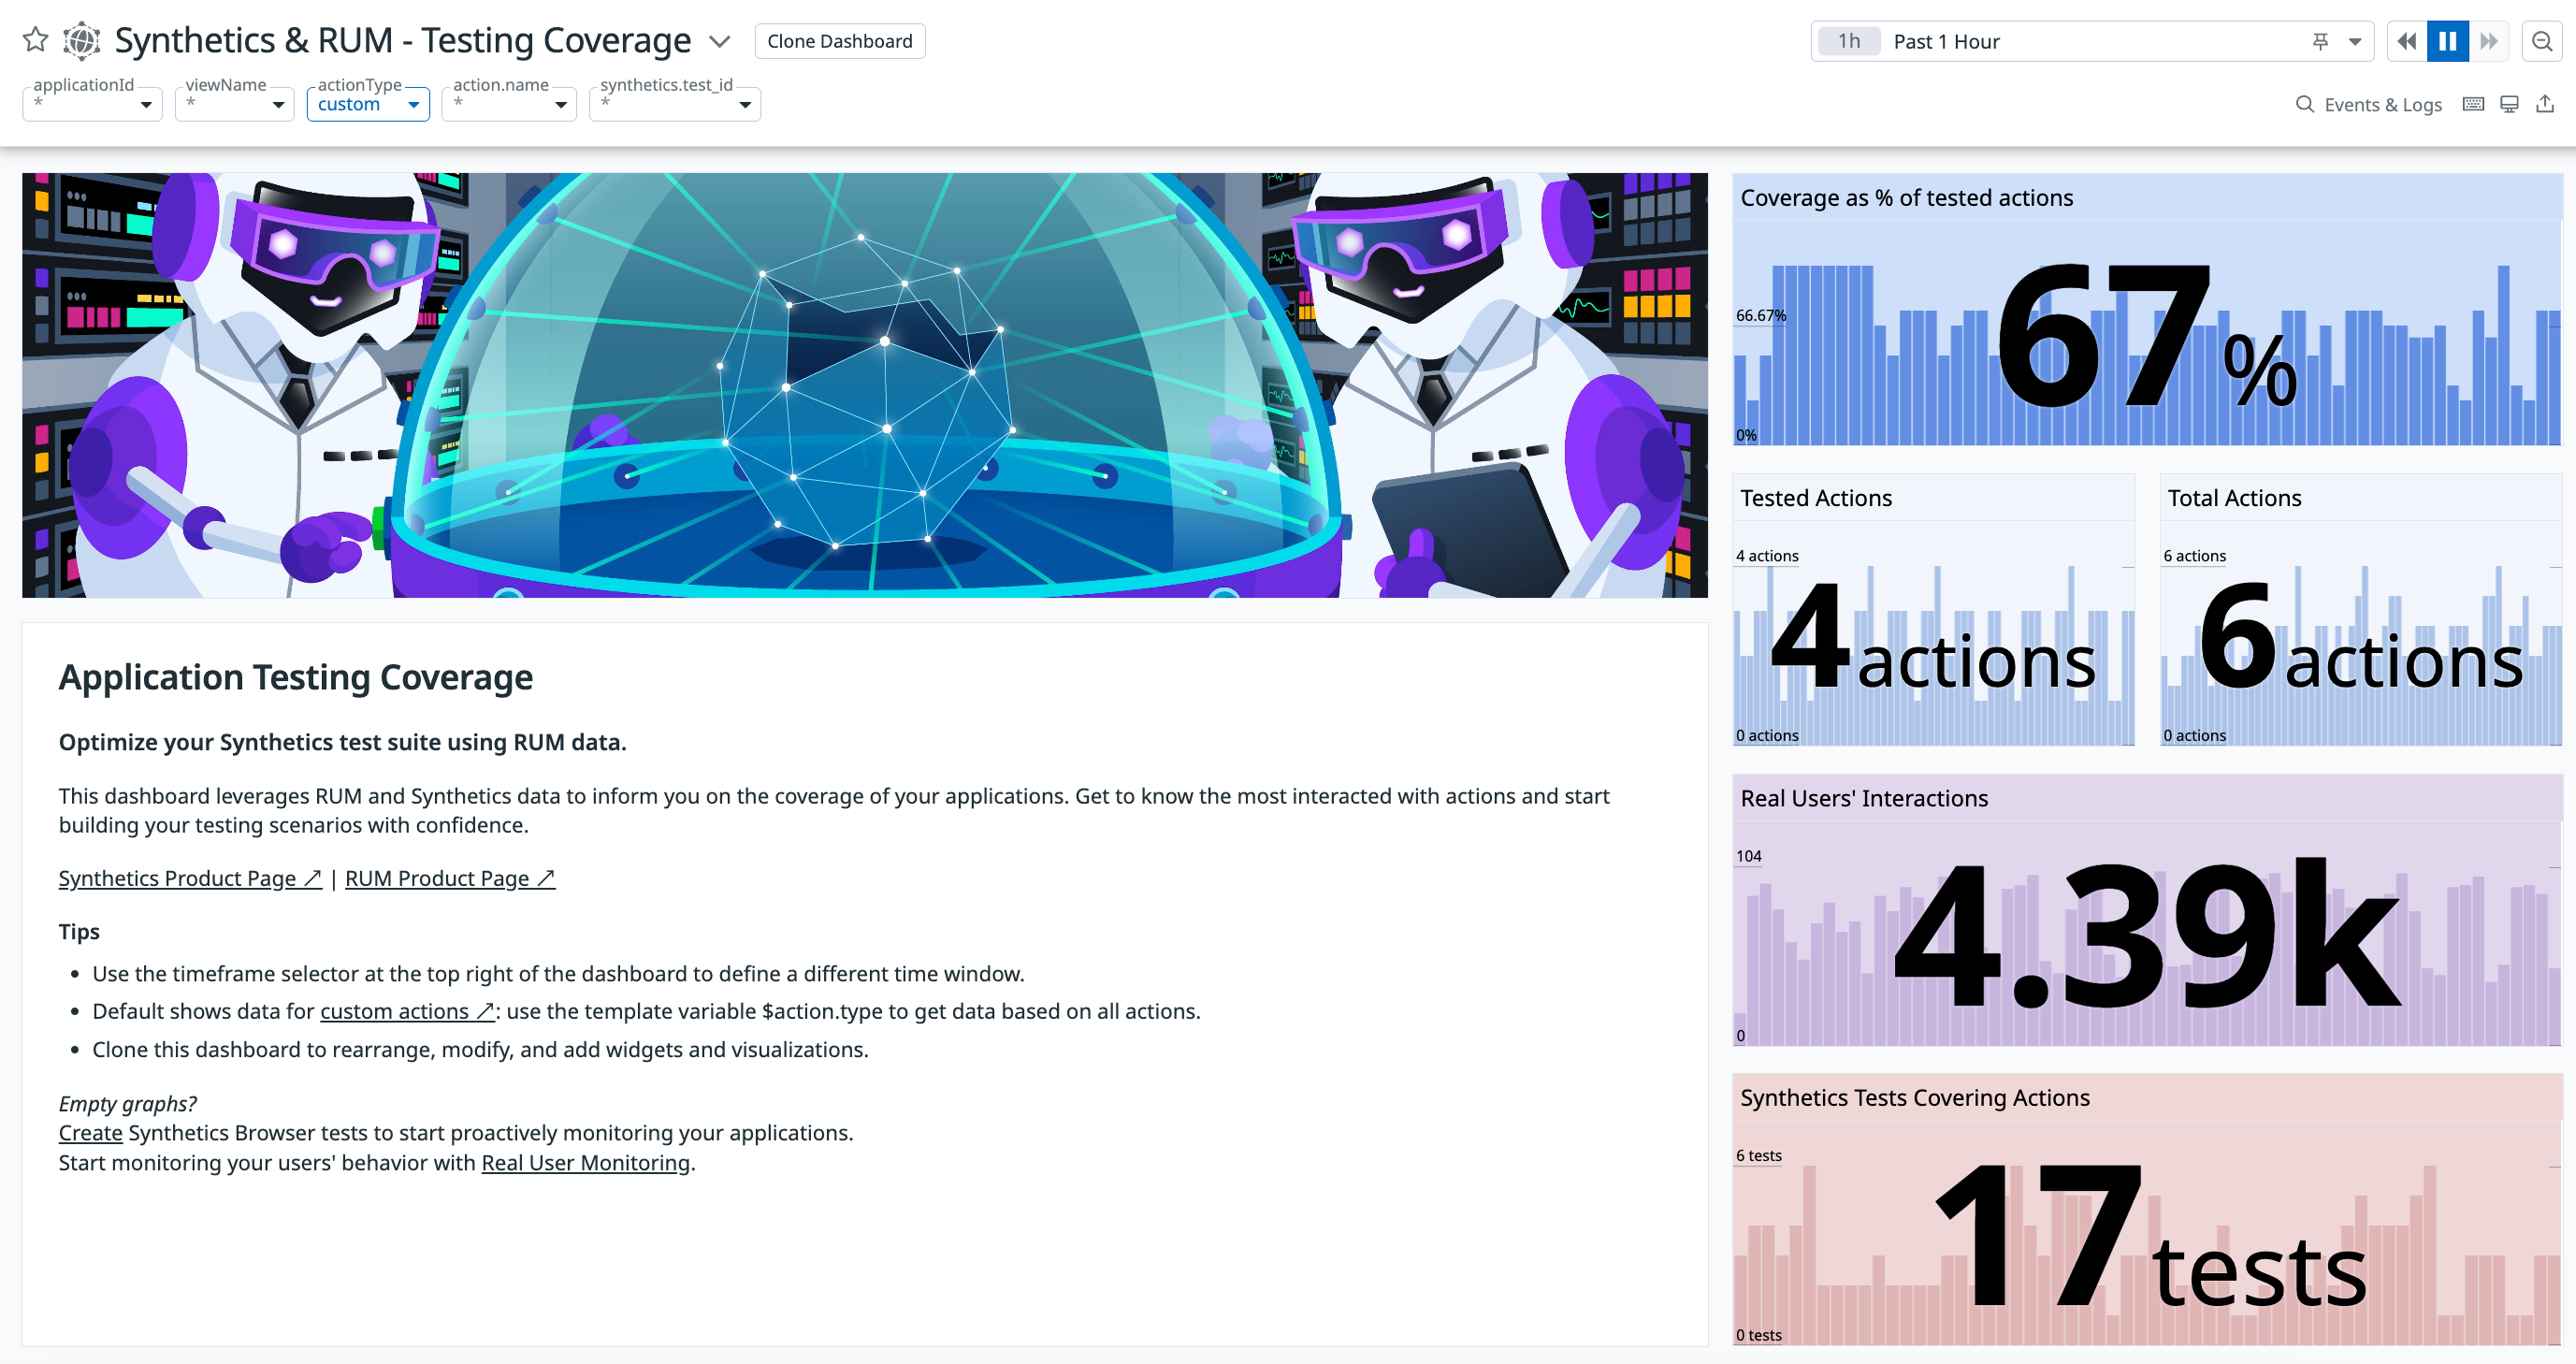
The Synthetics & RUM application testing coverage dashboard uses data collected from RUM and results from Synthetic browser tests to provide insights about the overall testing coverage for your application.
You can use this dashboard to answer the following questions:
- What is and what is not being tested in your application?
- How do you identify the most popular sections of your application to continuously monitor?
- How do you find the most popular user actions in your application to add browser test coverage?
It shows:
- Percentage of tested actions: Scan your application’s overall testing coverage.
- Untested actions: Explore the most popular untested user actions with the count of real user interactions and the number of actions covered in browser tests.
For more information about the data displayed, see RUM Browser Data Collected.
Web deployment tracking
The RUM Web App Deployment Tracking dashboard helps you identify when a recent deployment is causing performance issues or new errors within your application. To use this feature, make sure that you add RUM versions to your application. This dashboard shows:
- Core web vitals: For all views, three browser performance metrics are highlighted: Largest Contentful Paint, First Input Delay, and Cumulative Layout Shift. Other performance metrics, such as Load Time, are also available.
- Errors: See a count of errors, percentage of views with errors, and explore ongoing issues.
- Browser performance metrics: Compare performance metrics like loading time, sessions, errors, and load times across different services and versions.
Mobile deployment tracking
The RUM Mobile App Deployment Tracking dashboard helps you to identify when a recent deployment or release is causing performance issues or new errors within your mobile application. If you need to directly compare versions, use the RUM summary page deployment tracking section.
To use deployment tracking, make sure to specify an app version when you initialize the Datadog SDK.
This dashboard shows:
- Crashes: Review crash count by version, crash rate by version, and explore ongoing crashes.
- Errors: Review error count by version, error rate by version, and explore ongoing errors.
- Mobile vitals by version: For all versions, four mobile performance metrics are highlighted: slow renders, frozen frames, application start time, and memory usage.
For more information about the data displayed, see our documentation for each platform: iOS RUM, Android RUM, React Native RUM, and Flutter RUM.


