- 重要な情報
- はじめに
- Datadog
- Datadog サイト
- DevSecOps
- AWS Lambda のサーバーレス
- エージェント
- インテグレーション
- コンテナ
- ダッシュボード
- アラート設定
- ログ管理
- トレーシング
- プロファイラー
- タグ
- API
- Service Catalog
- Session Replay
- Continuous Testing
- Synthetic モニタリング
- Incident Management
- Database Monitoring
- Cloud Security Management
- Cloud SIEM
- Application Security Management
- Workflow Automation
- CI Visibility
- Test Visibility
- Intelligent Test Runner
- Code Analysis
- Learning Center
- Support
- 用語集
- Standard Attributes
- ガイド
- インテグレーション
- エージェント
- OpenTelemetry
- 開発者
- 認可
- DogStatsD
- カスタムチェック
- インテグレーション
- Create an Agent-based Integration
- Create an API Integration
- Create a Log Pipeline
- Integration Assets Reference
- Build a Marketplace Offering
- Create a Tile
- Create an Integration Dashboard
- Create a Recommended Monitor
- Create a Cloud SIEM Detection Rule
- OAuth for Integrations
- Install Agent Integration Developer Tool
- サービスのチェック
- IDE インテグレーション
- コミュニティ
- ガイド
- Administrator's Guide
- API
- モバイルアプリケーション
- CoScreen
- Cloudcraft
- アプリ内
- Service Management
- インフラストラクチャー
- アプリケーションパフォーマンス
- APM
- Continuous Profiler
- データベース モニタリング
- Data Streams Monitoring
- Data Jobs Monitoring
- Digital Experience
- Software Delivery
- CI Visibility (CI/CDの可視化)
- CD Visibility
- Test Visibility
- Intelligent Test Runner
- Code Analysis
- Quality Gates
- DORA Metrics
- セキュリティ
- セキュリティの概要
- Cloud SIEM
- クラウド セキュリティ マネジメント
- Application Security Management
- AI Observability
- ログ管理
- Observability Pipelines(観測データの制御)
- ログ管理
- 管理
RUM イベントとグラフのエクスポート
概要
RUM クエリと視覚化したグラフをダッシュボード、モニター、ノートブックで使用したり、Search RUM Events エンドポイントを使用してプログラムでイベントを検索することができます。
検索クエリまたは視覚化をエクスポートする
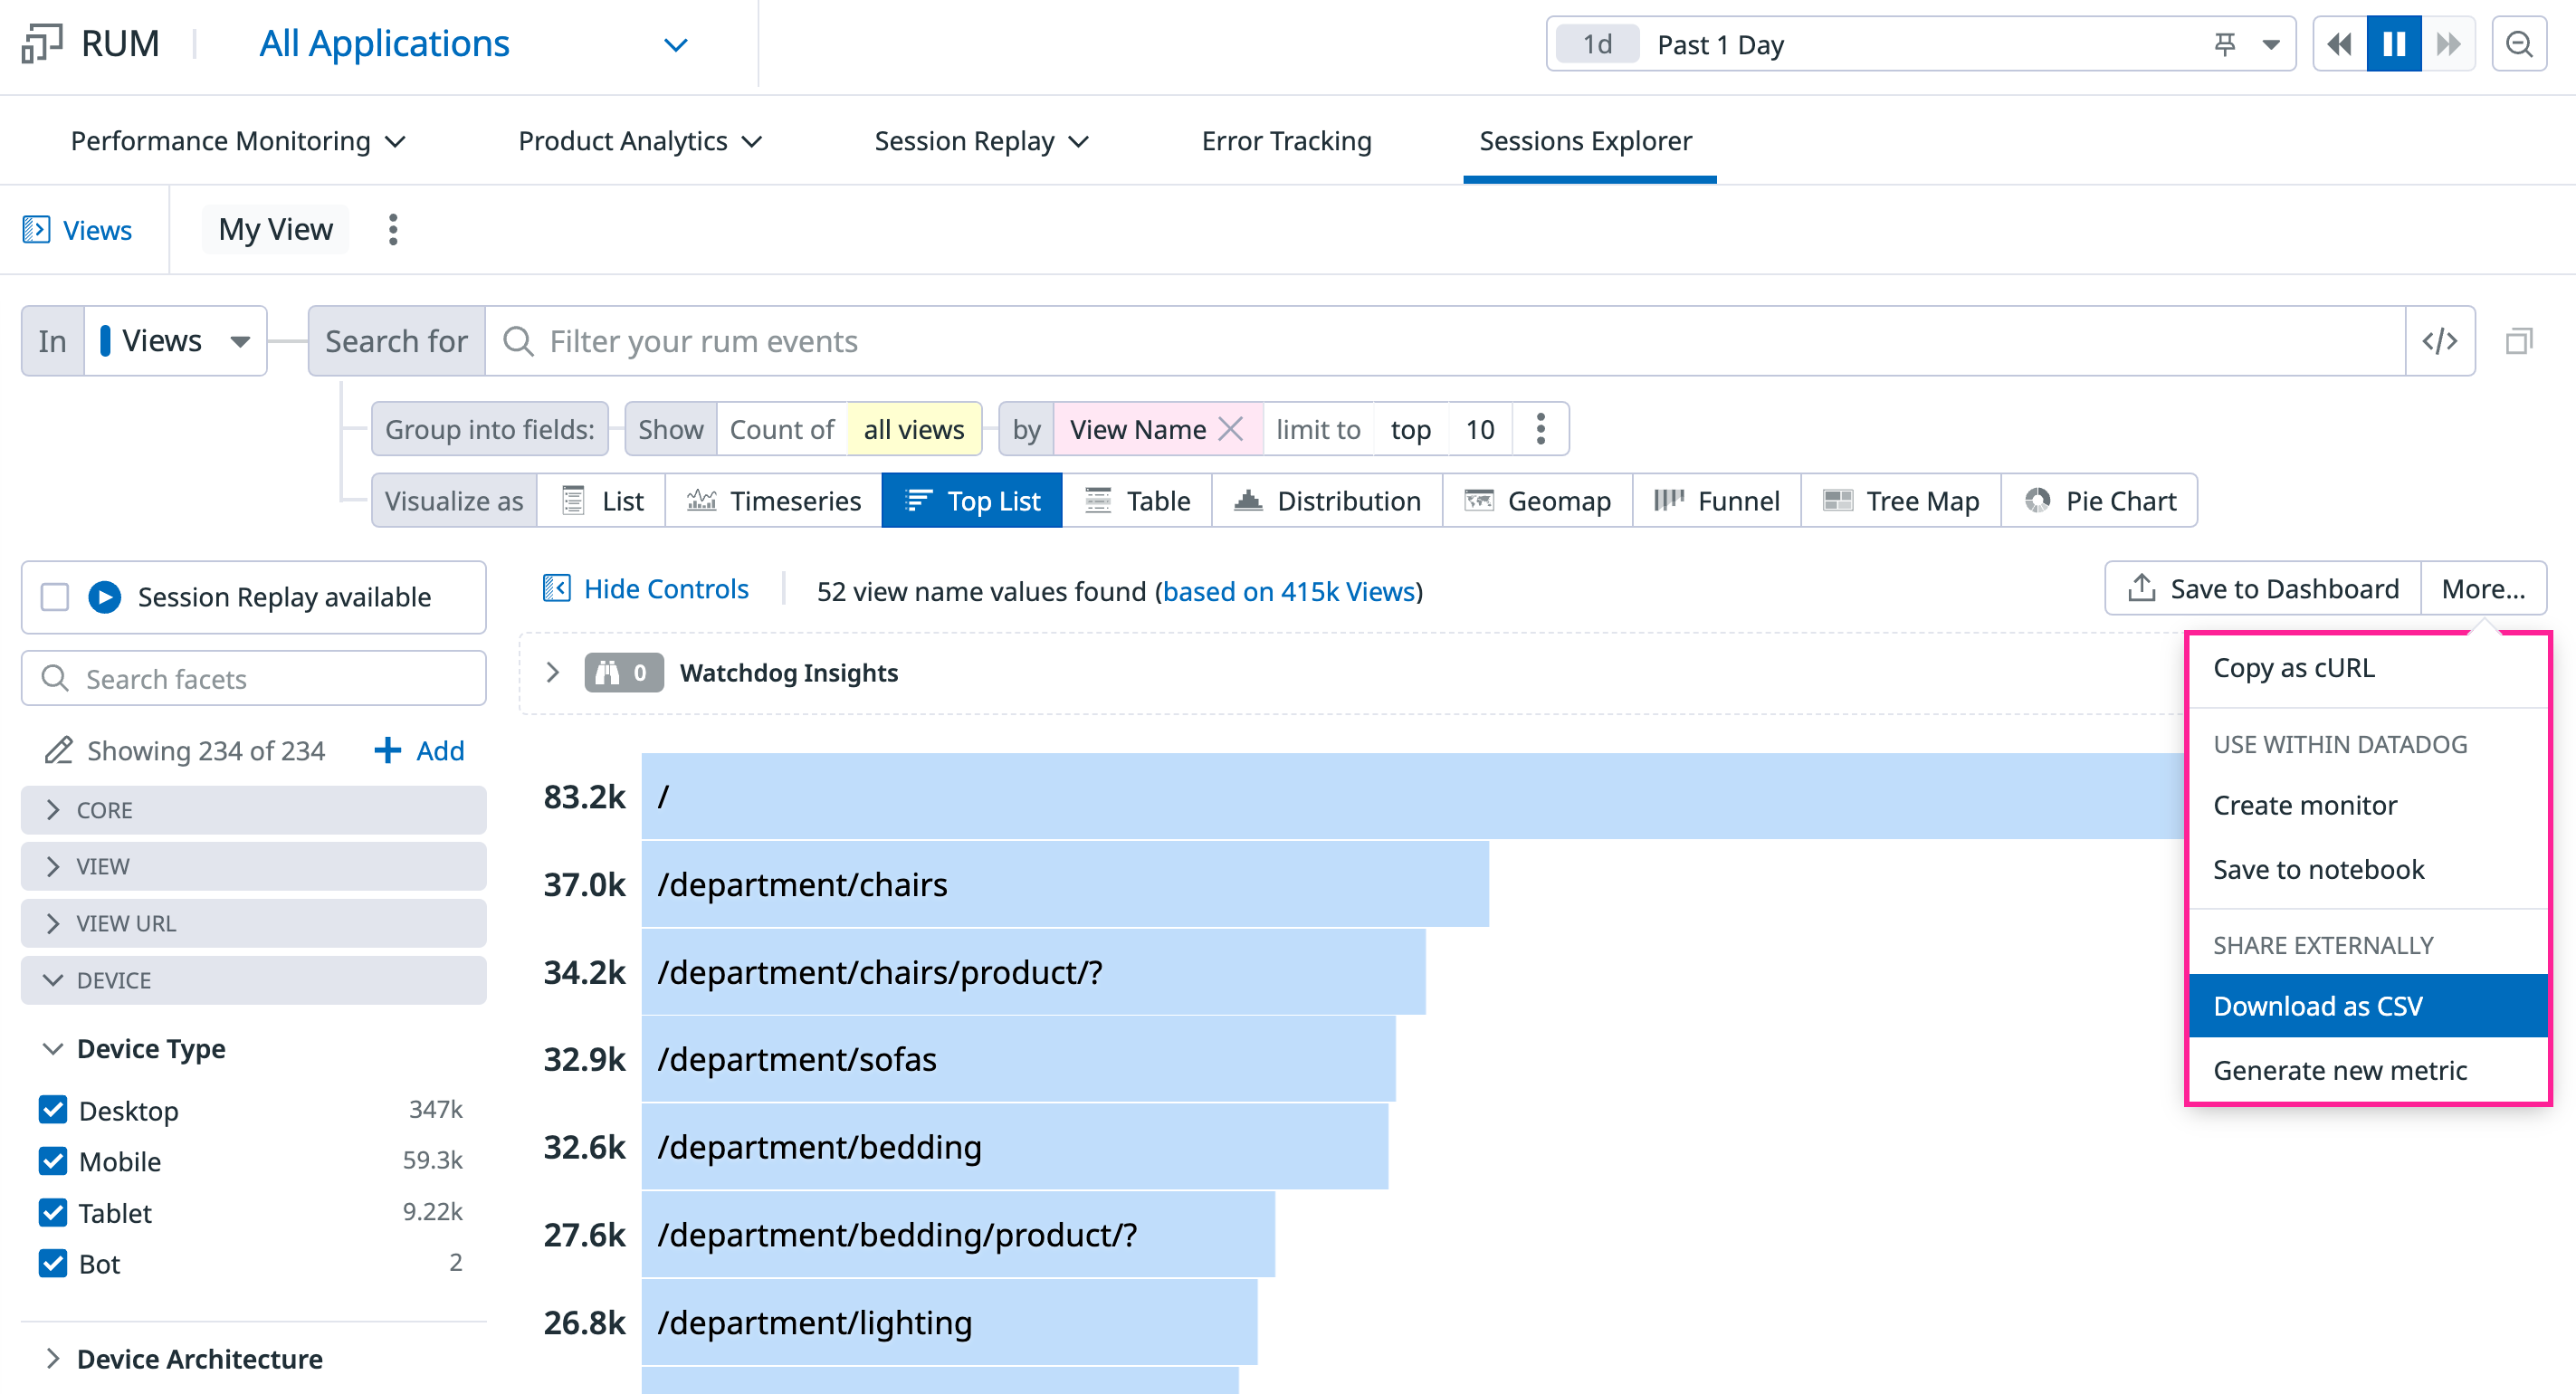
RUM エクスプローラーで集計した検索クエリや視覚化したグラフをコピー、エクスポート、ダウンロードすることが可能です。
右側の More ボタンをクリックし、ドロップダウンメニューからオプションを選択します。
- クエリを cURL コマンドとしてコピーし、RUM エクスプローラーでテストしたり、Datadog API を使用してカスタムレポートを構築したりすることができます。
- 事前に設定したしきい値でアラートをトリガーするモニターに検索結果をエクスポートすることができます。
- 検索結果を既存のノートブックにエクスポートして、レポートや統合の目的に利用できます。
- 検索結果を個々の RUM イベントや特定の集計の CSV ファイルとしてダウンロードすることができます。リスト付きの個々の RUM イベントは最大 5,000 件まで、時系列、トップリスト、表グラフは最大 500 件まで集計してエクスポートすることができます。
- 検索結果を使用して新しいメトリクスを生成することができます。生成したメトリクスは、メトリクスエクスプローラーで表示できます。
ある視覚化タイプで利用可能なオプションは、他のタイプではサポートされていません。例えば、分布グラフを CSV ファイルにダウンロードすることはできません。
その他の参考資料
お役に立つドキュメント、リンクや記事:

