- 重要な情報
- はじめに
- Datadog
- Datadog サイト
- DevSecOps
- AWS Lambda のサーバーレス
- エージェント
- インテグレーション
- コンテナ
- ダッシュボード
- アラート設定
- ログ管理
- トレーシング
- プロファイラー
- タグ
- API
- Service Catalog
- Session Replay
- Continuous Testing
- Synthetic モニタリング
- Incident Management
- Database Monitoring
- Cloud Security Management
- Cloud SIEM
- Application Security Management
- Workflow Automation
- CI Visibility
- Test Visibility
- Intelligent Test Runner
- Code Analysis
- Learning Center
- Support
- 用語集
- Standard Attributes
- ガイド
- インテグレーション
- エージェント
- OpenTelemetry
- 開発者
- 認可
- DogStatsD
- カスタムチェック
- インテグレーション
- Create an Agent-based Integration
- Create an API Integration
- Create a Log Pipeline
- Integration Assets Reference
- Build a Marketplace Offering
- Create a Tile
- Create an Integration Dashboard
- Create a Recommended Monitor
- Create a Cloud SIEM Detection Rule
- OAuth for Integrations
- Install Agent Integration Developer Tool
- サービスのチェック
- IDE インテグレーション
- コミュニティ
- ガイド
- Administrator's Guide
- API
- モバイルアプリケーション
- CoScreen
- Cloudcraft
- アプリ内
- Service Management
- インフラストラクチャー
- アプリケーションパフォーマンス
- APM
- Continuous Profiler
- データベース モニタリング
- Data Streams Monitoring
- Data Jobs Monitoring
- Digital Experience
- Software Delivery
- CI Visibility (CI/CDの可視化)
- CD Visibility
- Test Visibility
- Intelligent Test Runner
- Code Analysis
- Quality Gates
- DORA Metrics
- セキュリティ
- セキュリティの概要
- Cloud SIEM
- クラウド セキュリティ マネジメント
- Application Security Management
- AI Observability
- ログ管理
- Observability Pipelines(観測データの制御)
- ログ管理
- 管理
Error Tracking Explorer
このページは日本語には対応しておりません。随時翻訳に取り組んでいます。
翻訳に関してご質問やご意見ございましたら、お気軽にご連絡ください。
翻訳に関してご質問やご意見ございましたら、お気軽にご連絡ください。
このページは日本語には対応しておりません。随時翻訳に取り組んでいます。
翻訳に関してご質問やご意見ございましたら、お気軽にご連絡ください。
翻訳に関してご質問やご意見ございましたら、お気軽にご連絡ください。
Overview
The Error Tracking Explorer allows you to view, filter, and investigate issues. An issue is a group of similar errors related to the same bug. Datadog creates issues by computing a fingerprint for each error using some of its attributes such as the error type, the error message, or the stack trace. Errors with the same fingerprint are grouped together in the same issue.
Explore your issues
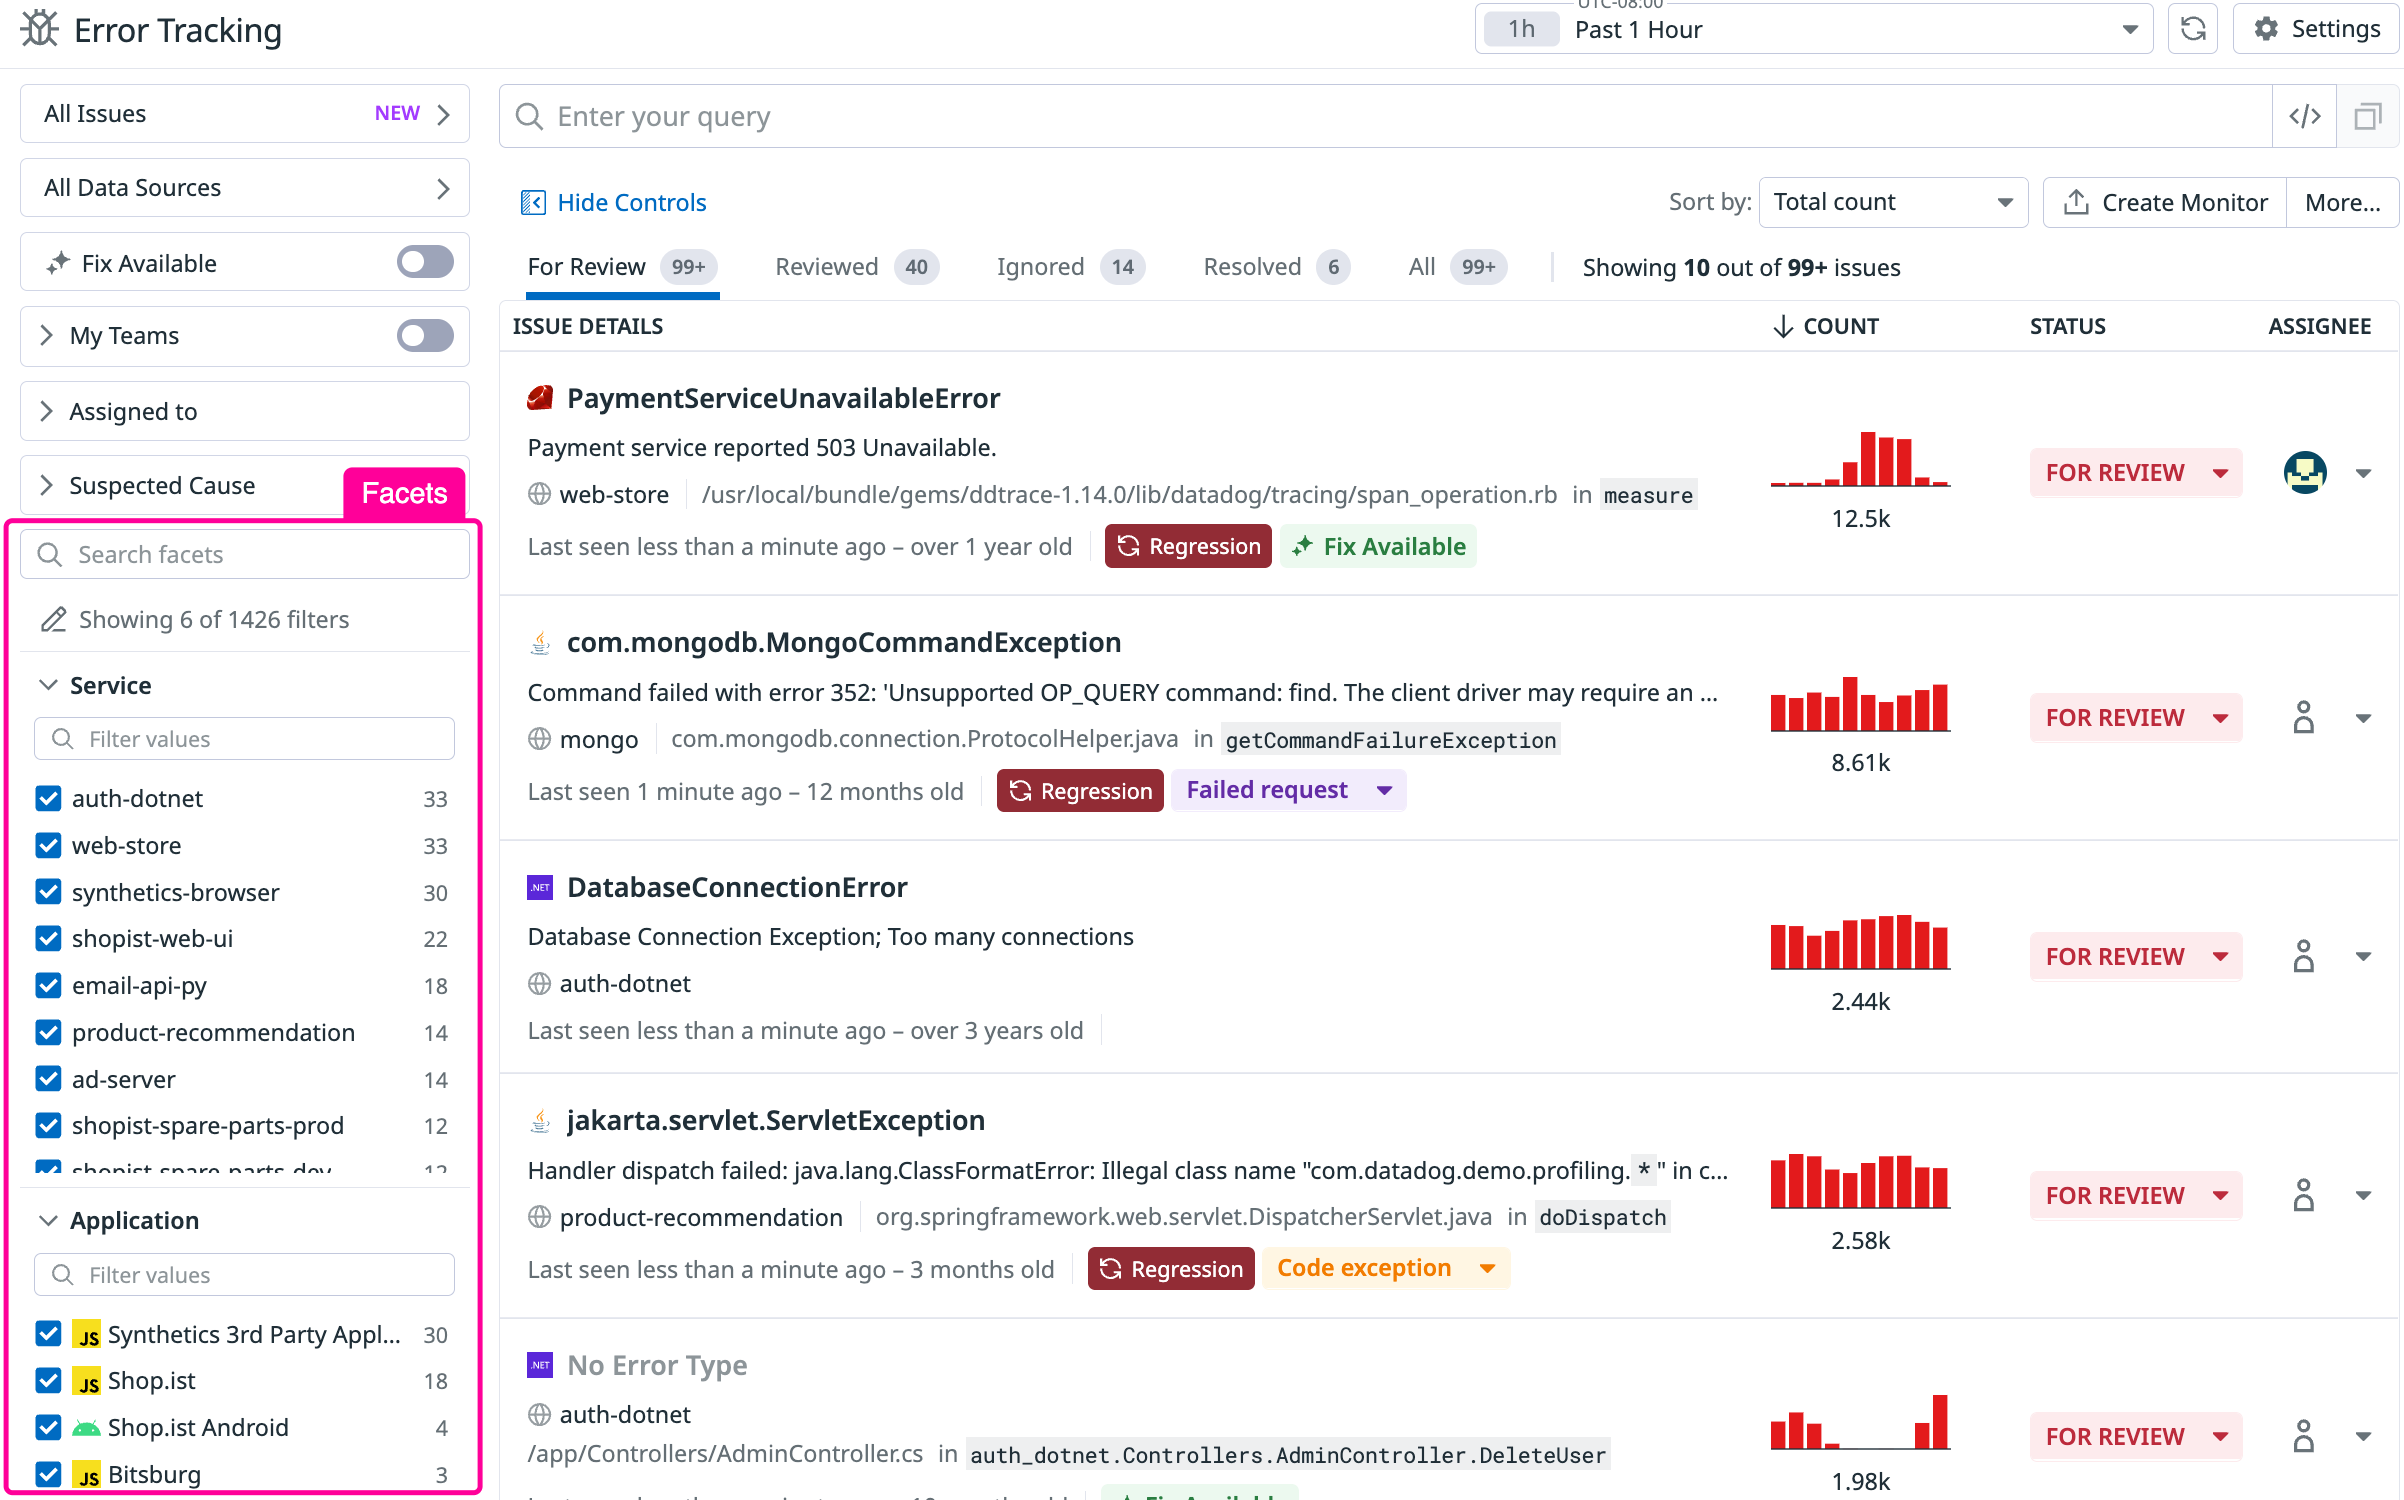
Each item listed in the Error Tracking Explorer is an issue that contains high-level information about the error, including the following:
- The error type and the error message
- The path to the file in which underlying errors are fired
- Important information about the issue’s lifetime:
- When it was first and last seen
- Graph of occurrences over time
- Number of occurrences in the selected time period
Issue are also tagged as:
Newif the issue was first seen less than two days ago and is in state FOR REVIEW (see Issue States)Regressionif the issue was RESOLVED and occurred again in a newer version (see Regression Detection)Crashif the application crashed- Having a Suspected Cause
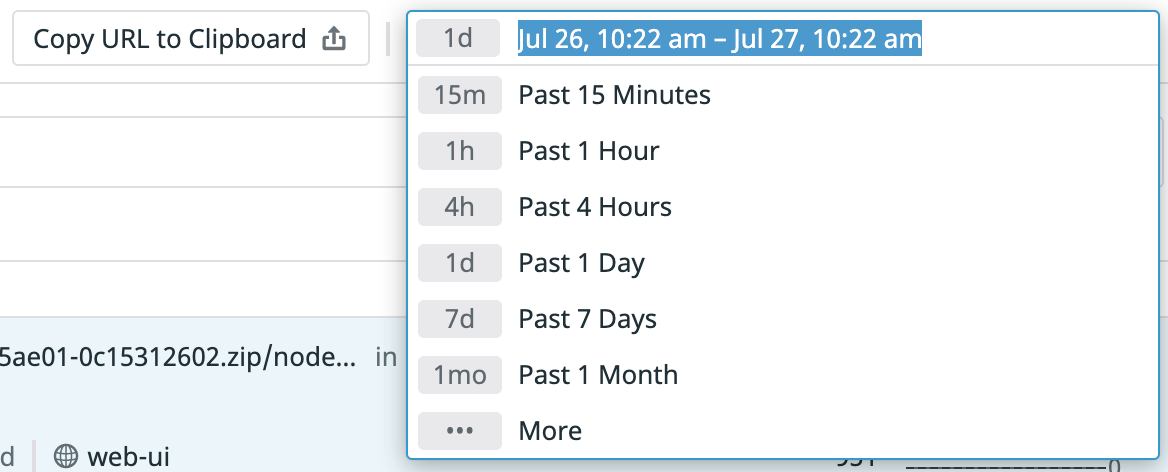
Time range
The time range appears on the top right of the Explorer as a timeline. This feature allows you to display issues having error occurrences within the selected time period. Change the time range by selecting a preset range from the dropdown.
Sorting
Order issues in the list using one of these options:
- Relevance combines multiple issue features to prioritize code related, recent, or spiking issues. Error Tracking analyzes how old issues are, occurrences over the last day, notable increase over the past hour, or if they triggered an application crash.
- Count sorts issues based on the total count of occurrences over the selected time range.
- Newest orders issues by when they were first seen.
- Impacted Sessions sorts issues by the number of impacted RUM sessions.
Facets
Error Tracking automatically indexes a predefined list of attributes from your issues and creates facets out of it. A facet displays all the distinct members of an attribute for the selected time period and provides some basic analytics, such as the number of issues represented. Facets allow you to pivot or filter your issues based on the given attribute.
Some commonly used error attributes include:
| Attribute | Description |
|---|---|
error.message | The message associated with the error. |
error.type | The type or class of the error. |
error.stack | The stack trace associated with the error. |
error.handling | Indicates whether the error was handled. APM errors are considered handled if a parent span reports a successful operation (HTTP 200, gRPC OK) or successful error handling (HTTP 400, gRPC NOT_FOUND). RUM errors are unhandled if they are not captured manually in the code. |
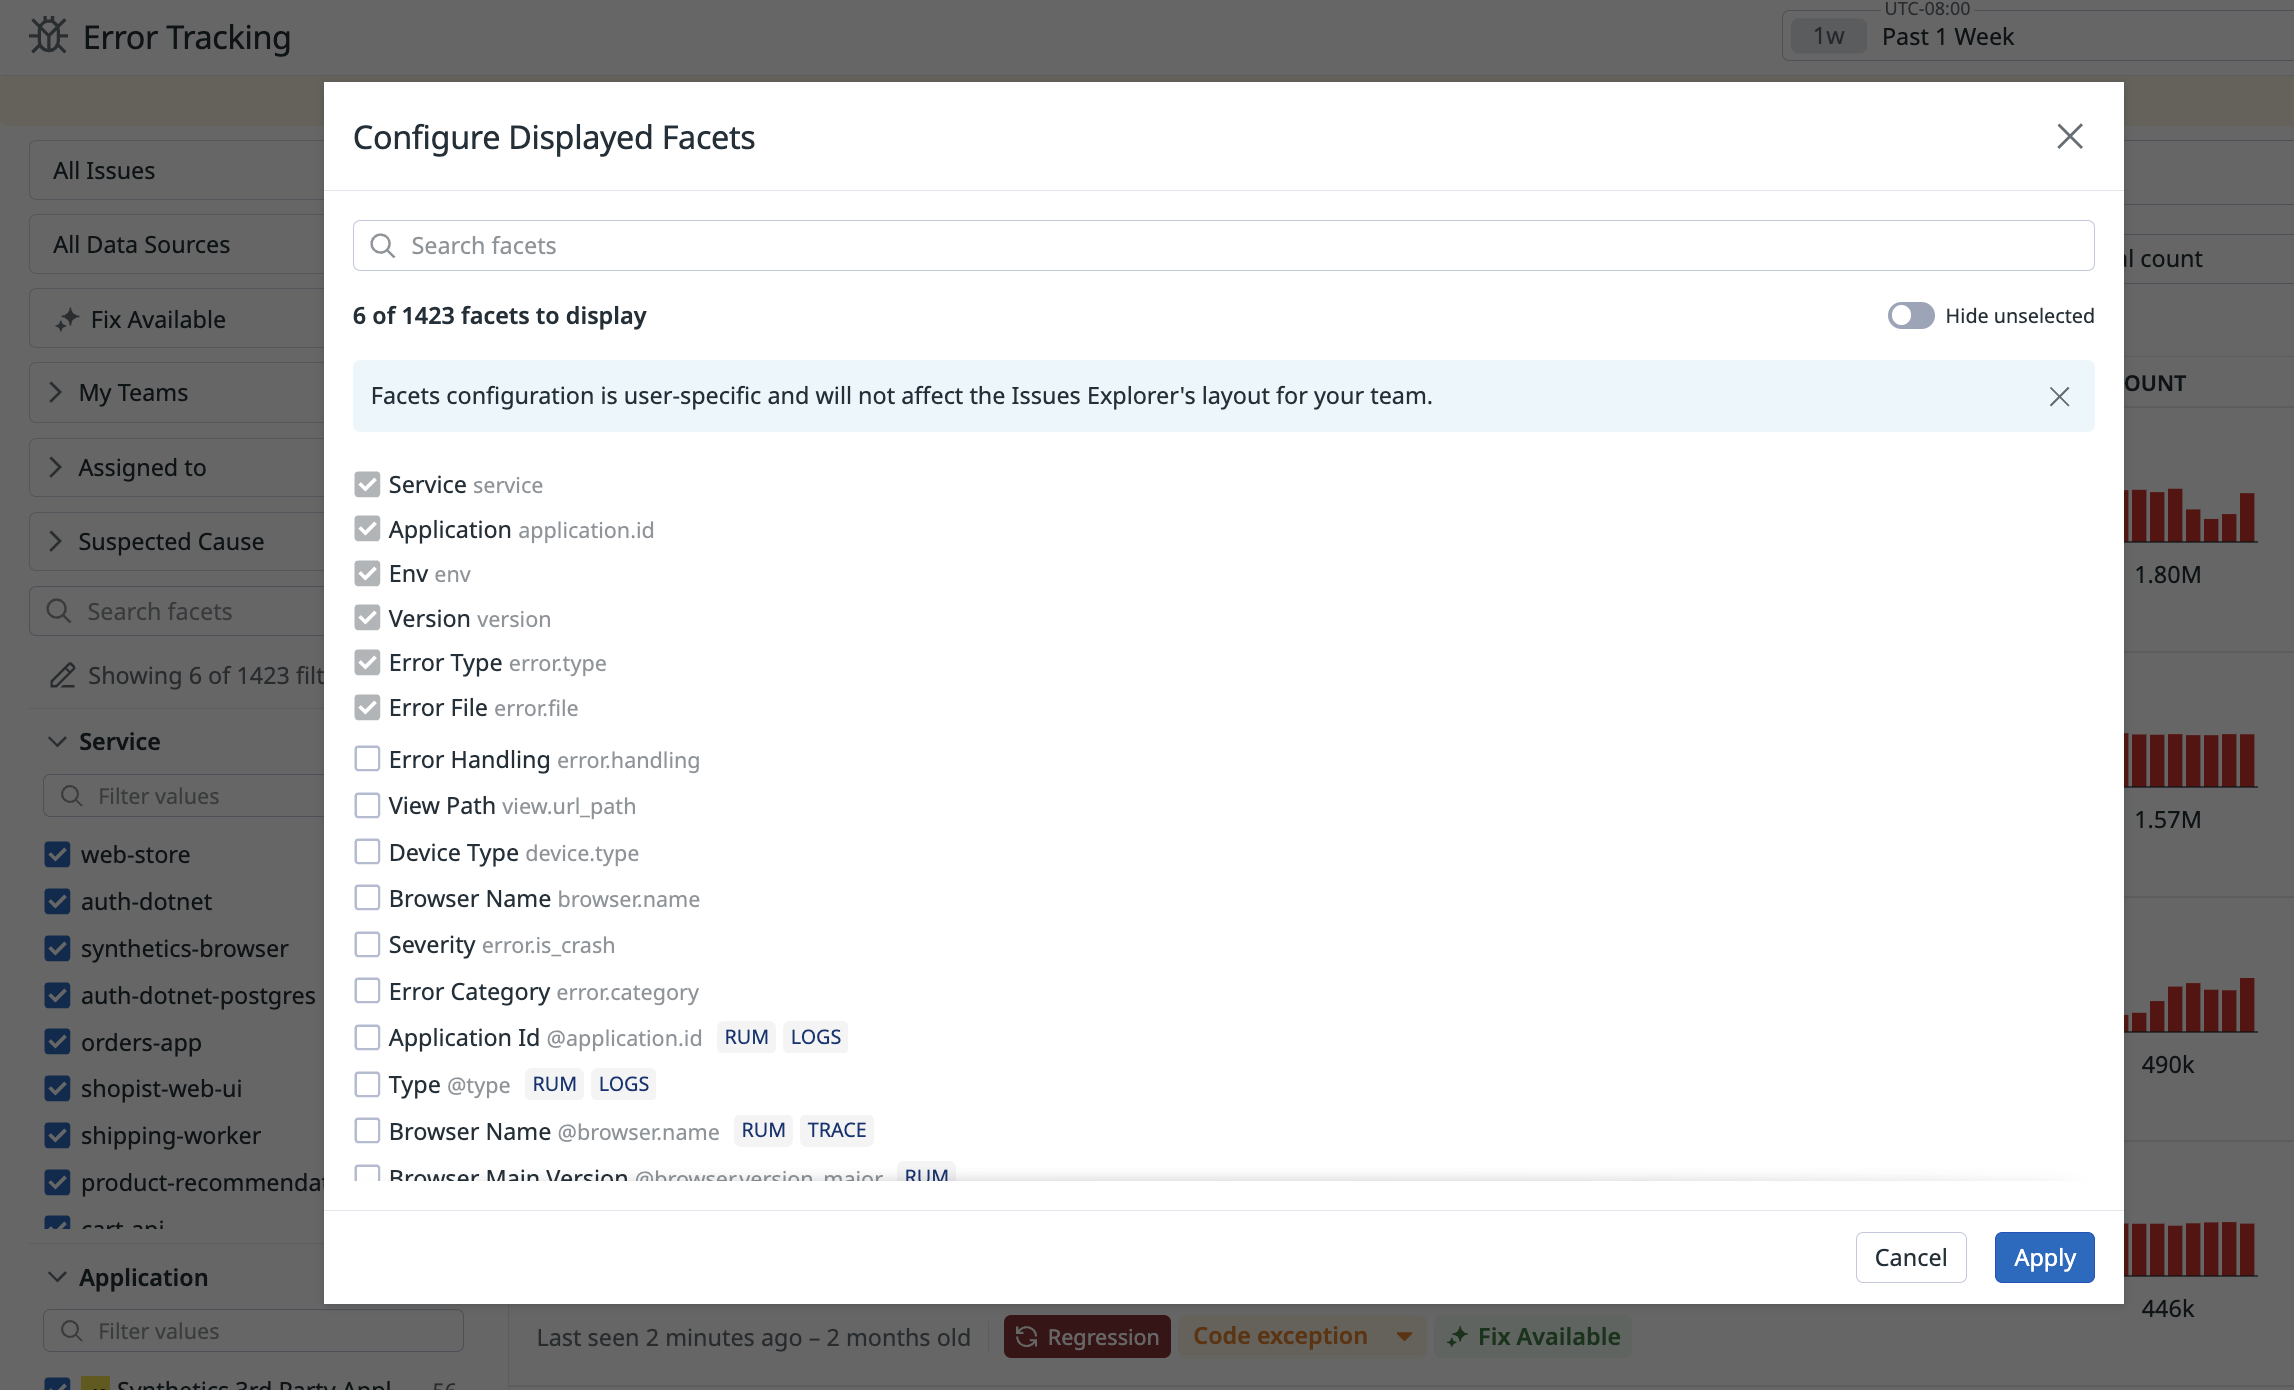
Click the Edit icon to see the list of available facets that you can show or hide from view.
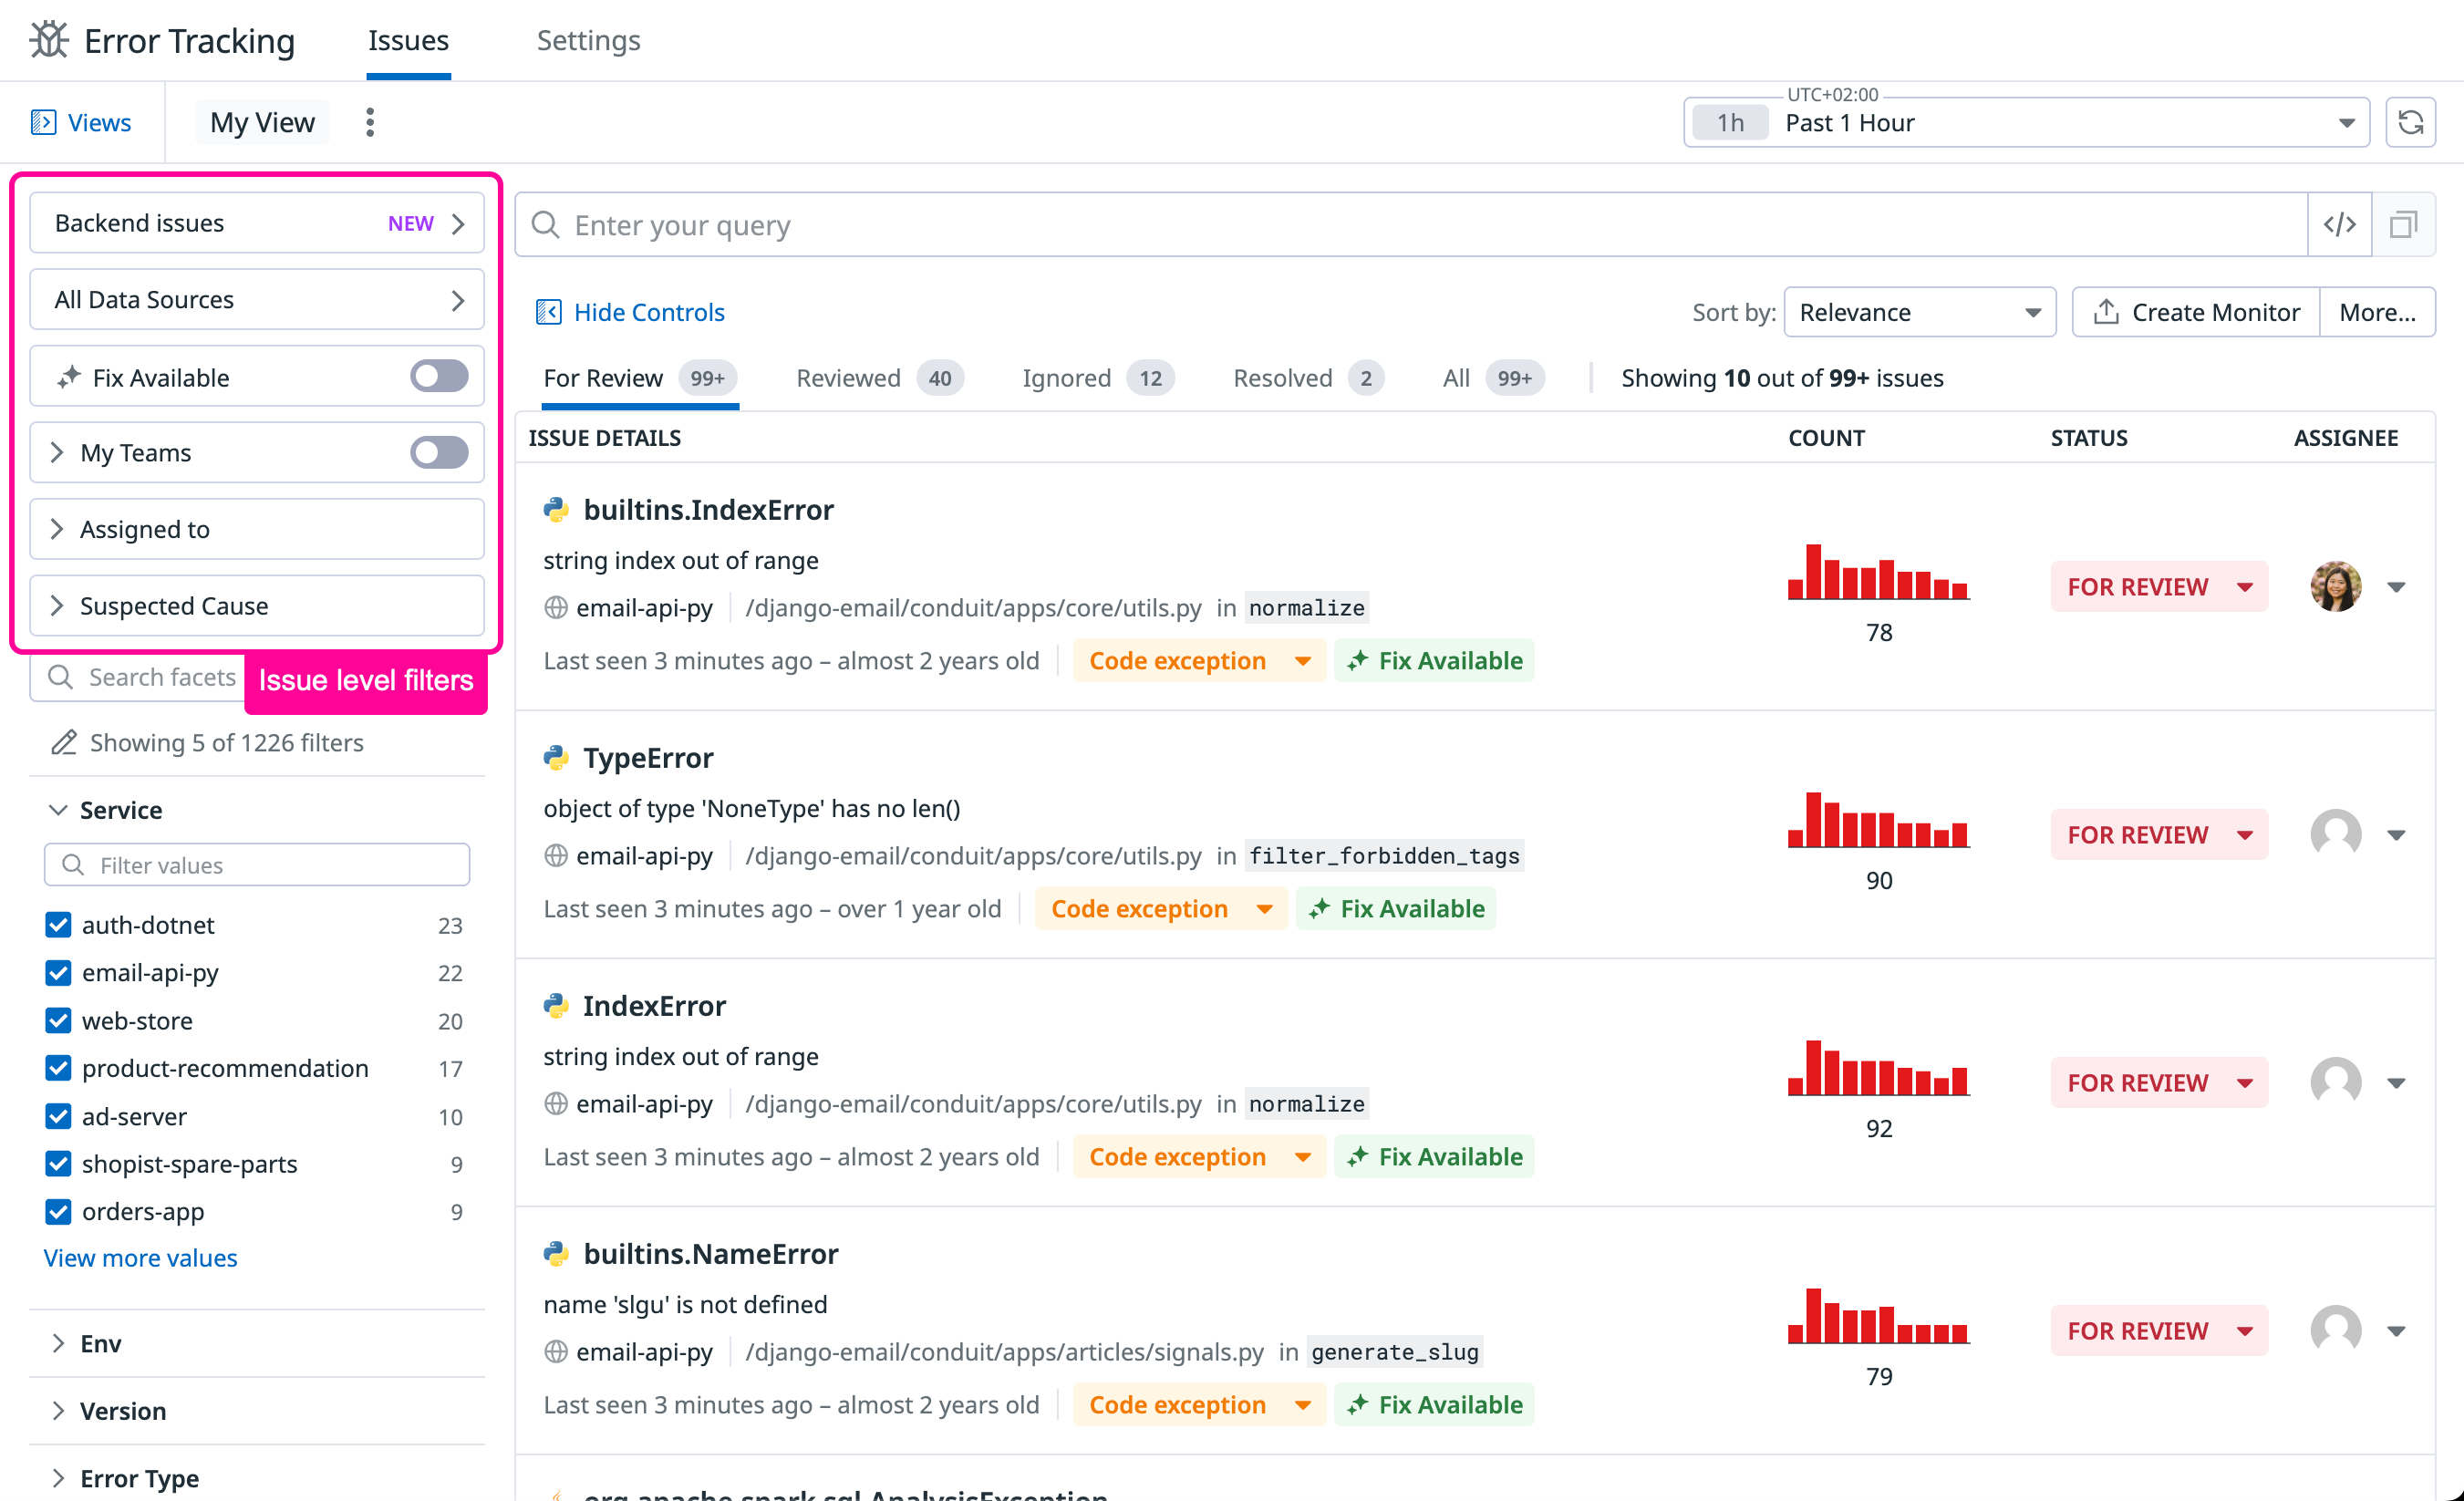
Issue level filters
In addition to error events, Error Tracking offers issue level filters to refine the list of displayed issues.
Sources
Error Tracking consolidates errors from multiple Datadog products (Rum, Logs, APM) into a unified view, allowing you to watch and troubleshoot errors across your entire stack. You can choose to display All, Browser, Mobile, or Backend issues in the explorer.
For more granular filtering, you can narrow down issues by specific log sources or by SDK and scope to a programming language.
Fix available
Display only issues that have an AI generated fix available to quickly remediate problems.
Teams filters
Issue Team Ownership helps you quickly identify issues relevant to your team by using Git CODEOWNERS and service owners.
Assigned to
Track and assign issues to yourself or the most knowledgeable team members, and easily refine the issue list by assignee.
Suspected Cause
Suspected Cause enables quicker filtering and prioritization of errors, empowering teams to address potential root causes more effectively.
Inspect an issue
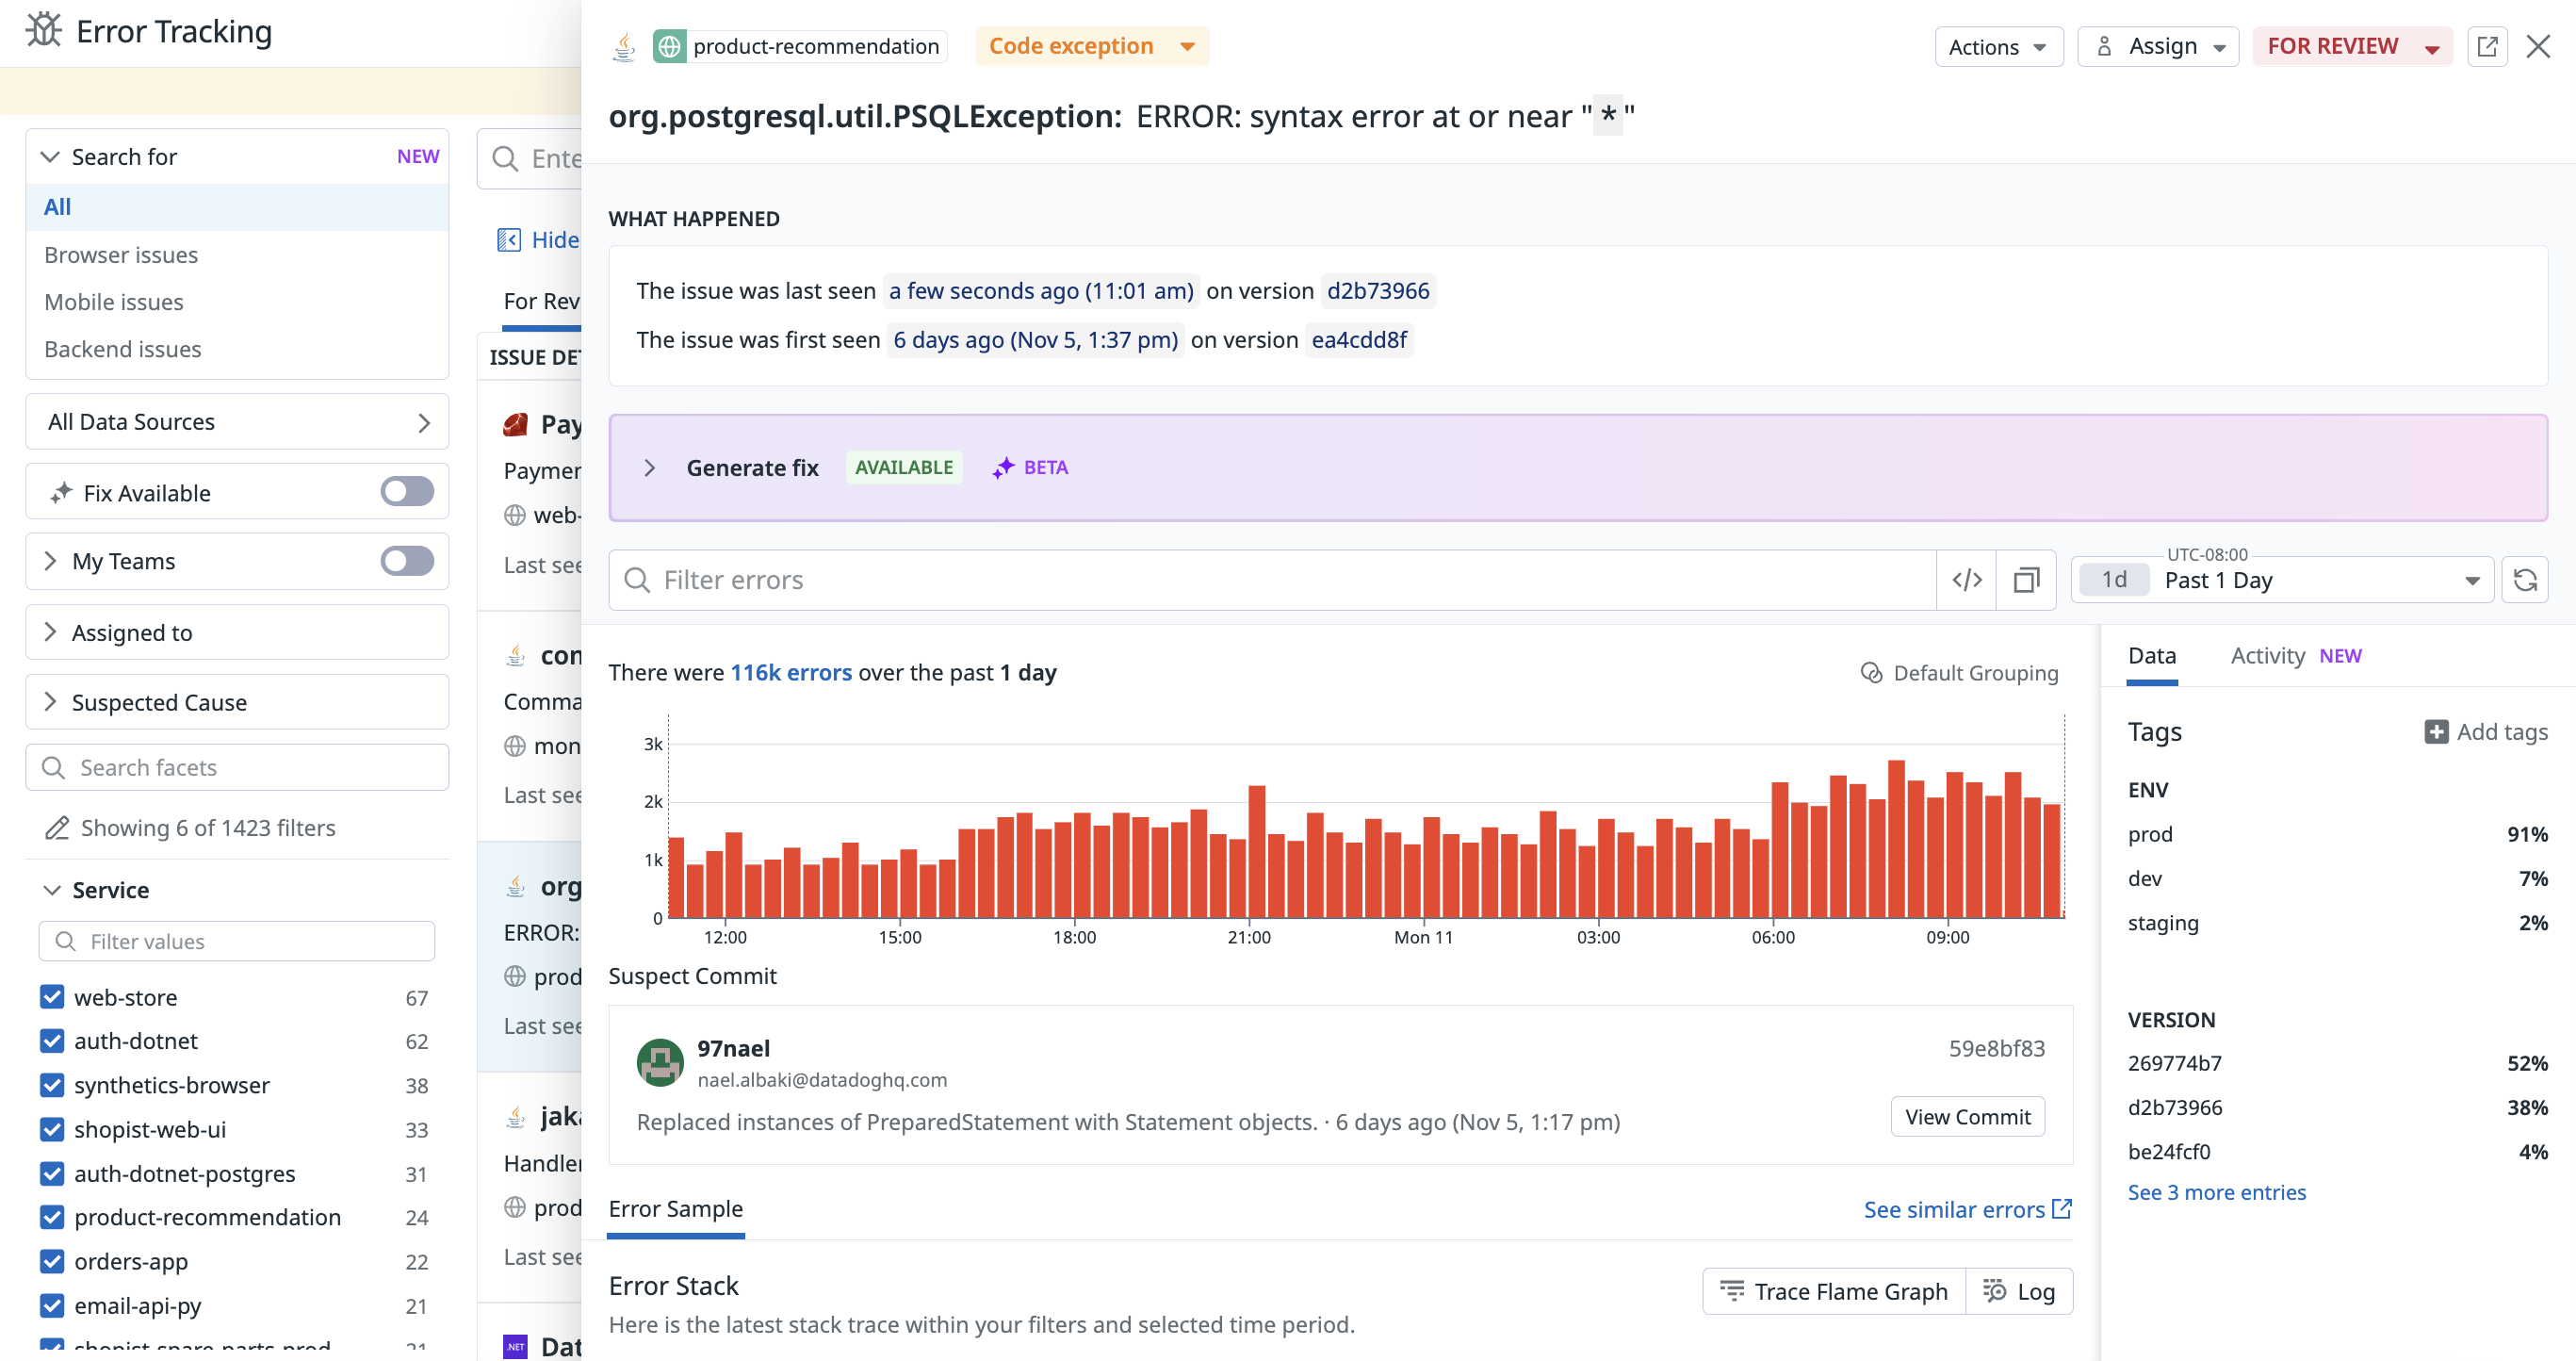
Click on any issue to open the issue panel and see more information about it.
The high-level details you need when troubleshooting an issue can be found in the upper part of the panel. From here, you can understand its lifecycle: first and last occurrence dates, total count, as well as the count over time for the given issue.
The information shown in the issue panel varies depending on the error source. For example, an issue created from APM errors shows the error span tags, such as the resource or operation name, with direct access to the related trace or to logs that are linked to it.
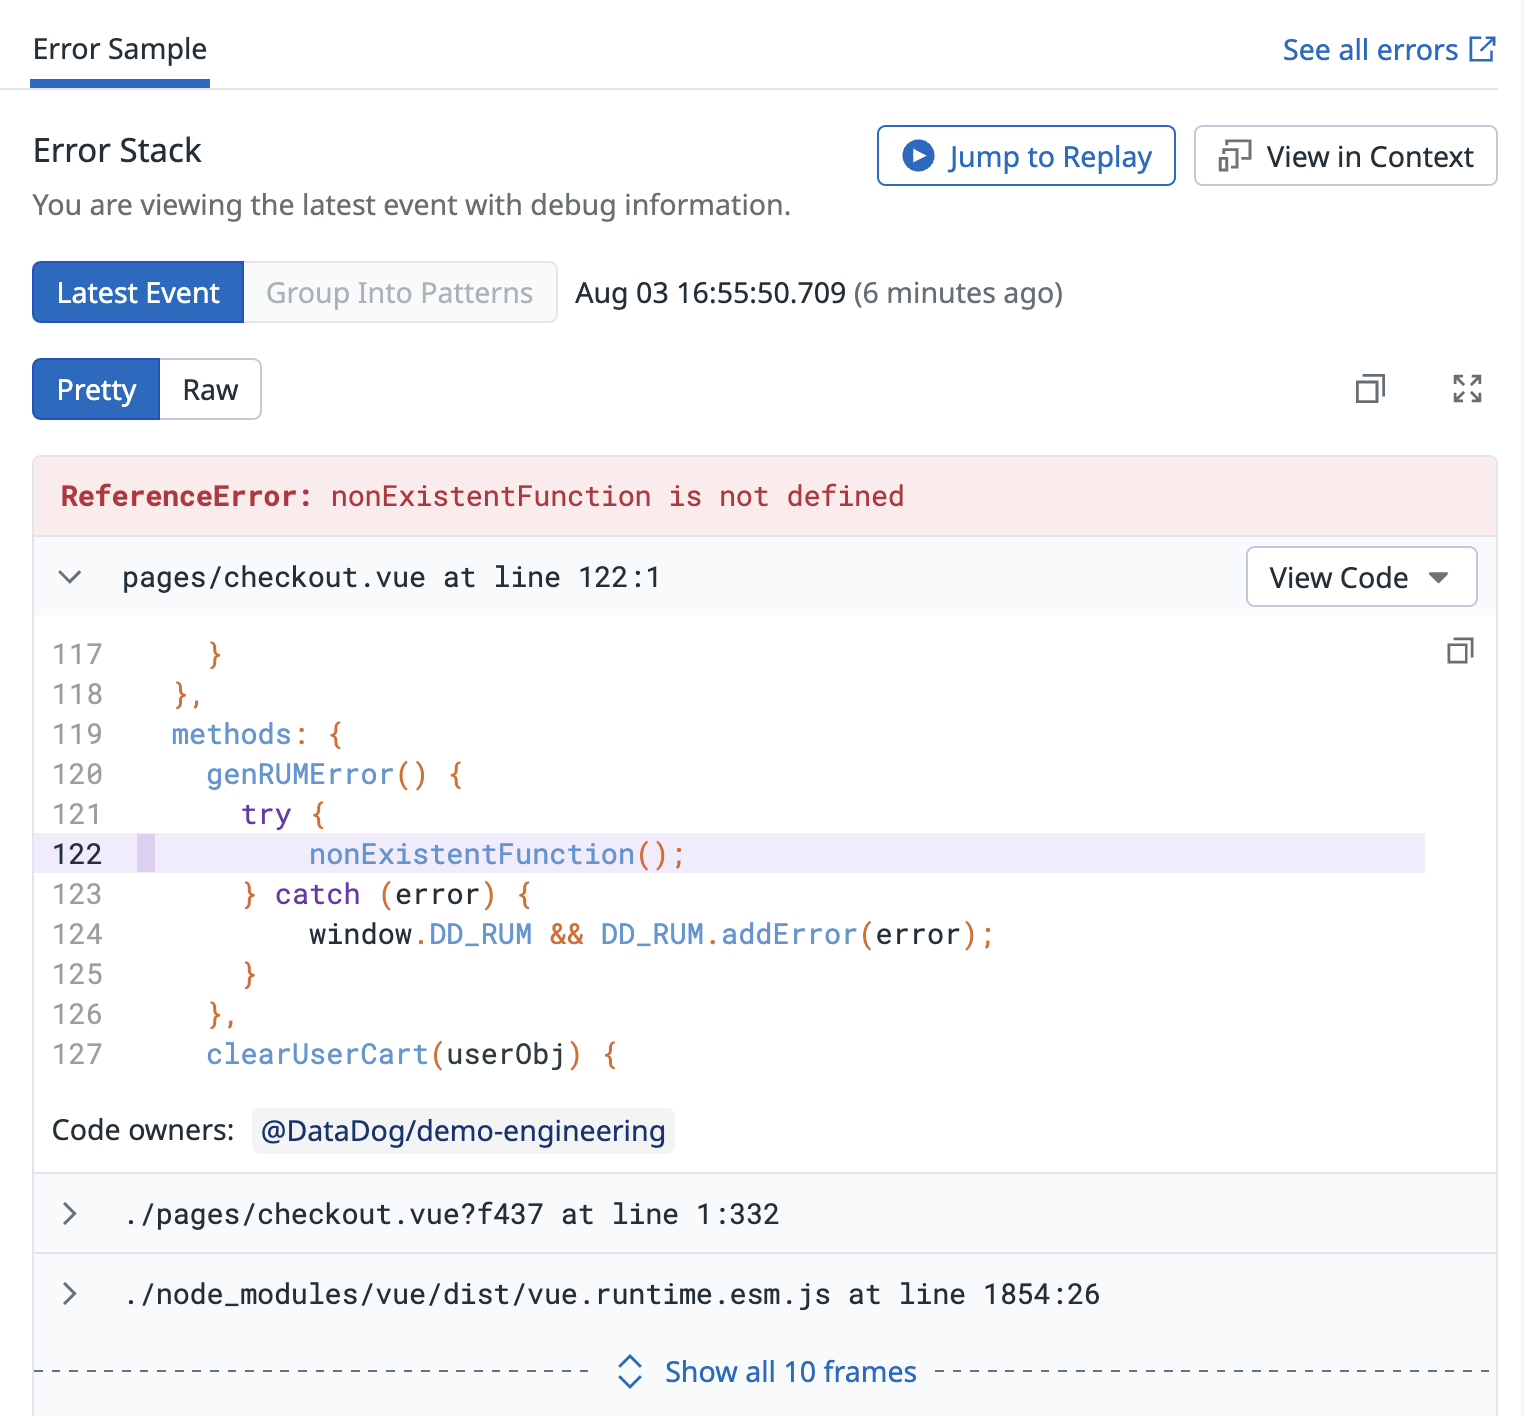
The lower part of the issue panel gives you the ability to navigate error samples from the related issue. Each error sample gives you troubleshooting information such as the stack trace of the error, and the characteristics of impacted users.
Get alerted on new or impactful errors
Seeing a new issue as soon as it happens gives you the chance to proactively identify and fix it before it becomes critical. Error Tracking monitors allow you to track any new issue or issues that have a high impact in your systems or on your users (see Error Tracking Monitors)
You can directly export your search query from the explorer to create an Error Tracking Monitor on the related scope:
Further Reading
お役に立つドキュメント、リンクや記事:
