- 重要な情報
- はじめに
- 用語集
- Standard Attributes
- ガイド
- インテグレーション
- エージェント
- OpenTelemetry
- 開発者
- Administrator's Guide
- API
- Partners
- DDSQL Reference
- モバイルアプリケーション
- CoScreen
- CoTerm
- Remote Configuration
- Cloudcraft
- アプリ内
- ダッシュボード
- ノートブック
- DDSQL Editor
- Reference Tables
- Sheets
- Watchdog
- アラート設定
- メトリクス
- Bits AI
- Internal Developer Portal
- Error Tracking
- Change Tracking
- Service Management
- Actions & Remediations
- インフラストラクチャー
- Cloudcraft
- Resource Catalog
- ユニバーサル サービス モニタリング
- Hosts
- コンテナ
- Processes
- サーバーレス
- ネットワークモニタリング
- Cloud Cost
- アプリケーションパフォーマンス
- APM
- Continuous Profiler
- データベース モニタリング
- Data Streams Monitoring
- Data Jobs Monitoring
- Data Observability
- Digital Experience
- RUM & セッションリプレイ
- Synthetic モニタリング
- Continuous Testing
- Product Analytics
- Software Delivery
- CI Visibility (CI/CDの可視化)
- CD Visibility
- Deployment Gates
- Test Visibility
- Code Coverage
- Quality Gates
- DORA Metrics
- Feature Flags
- セキュリティ
- セキュリティの概要
- Cloud SIEM
- Code Security
- クラウド セキュリティ マネジメント
- Application Security Management
- Workload Protection
- Sensitive Data Scanner
- AI Observability
- ログ管理
- Observability Pipelines(観測データの制御)
- ログ管理
- CloudPrem
- 管理
Host Metrics
このページは日本語には対応しておりません。随時翻訳に取り組んでいます。
翻訳に関してご質問やご意見ございましたら、お気軽にご連絡ください。
翻訳に関してご質問やご意見ございましたら、お気軽にご連絡ください。
Overview
To collect system metrics such as CPU, disk, and memory usage, enable the host metrics receiver in your Collector.
For more information, including supported operating systems, see the OpenTelemetry project documentation for the host metrics receiver.
Setup
Add the following lines to your Collector configuration:
processors:
  resourcedetection:
    detectors: [system]
    system:
      hostname_sources: [os]

receivers:
  hostmetrics:
    collection_interval: 10s
    scrapers:
      paging:
        metrics:
          system.paging.utilization:
            enabled: true
      cpu:
        metrics:
          system.cpu.utilization:
            enabled: true
      disk:
      filesystem:
        metrics:
          system.filesystem.utilization:
            enabled: true
      load:
      memory:
      network:
      processes:

service:
  pipelines:
    metrics:
      receivers: [hostmetrics]
      processors: [resourcedetection]
      exporters: [datadog]
Set up the host metrics receiver on each node from which metrics need to be collected. To collect host metrics from every node in your cluster, deploy the host metrics receiver as a DaemonSet collector. Add the following in the Collector configuration:
receivers:
  hostmetrics:
    collection_interval: 10s
    scrapers:
      paging:
        metrics:
          system.paging.utilization:
            enabled: true
      cpu:
        metrics:
          system.cpu.utilization:
            enabled: true
          system.cpu.physical.count:
            enabled: true
          system.cpu.logical.count:
            enabled: true
          system.cpu.frequency:
            enabled: true
      disk:
      filesystem:
        metrics:
          system.filesystem.utilization:
            enabled: true
      load:
      memory:
      network:
      processes:
Data collected
Host Metrics are collected by the host metrics receiver. For information about setting up the receiver, see OpenTelemetry Collector Datadog Exporter.
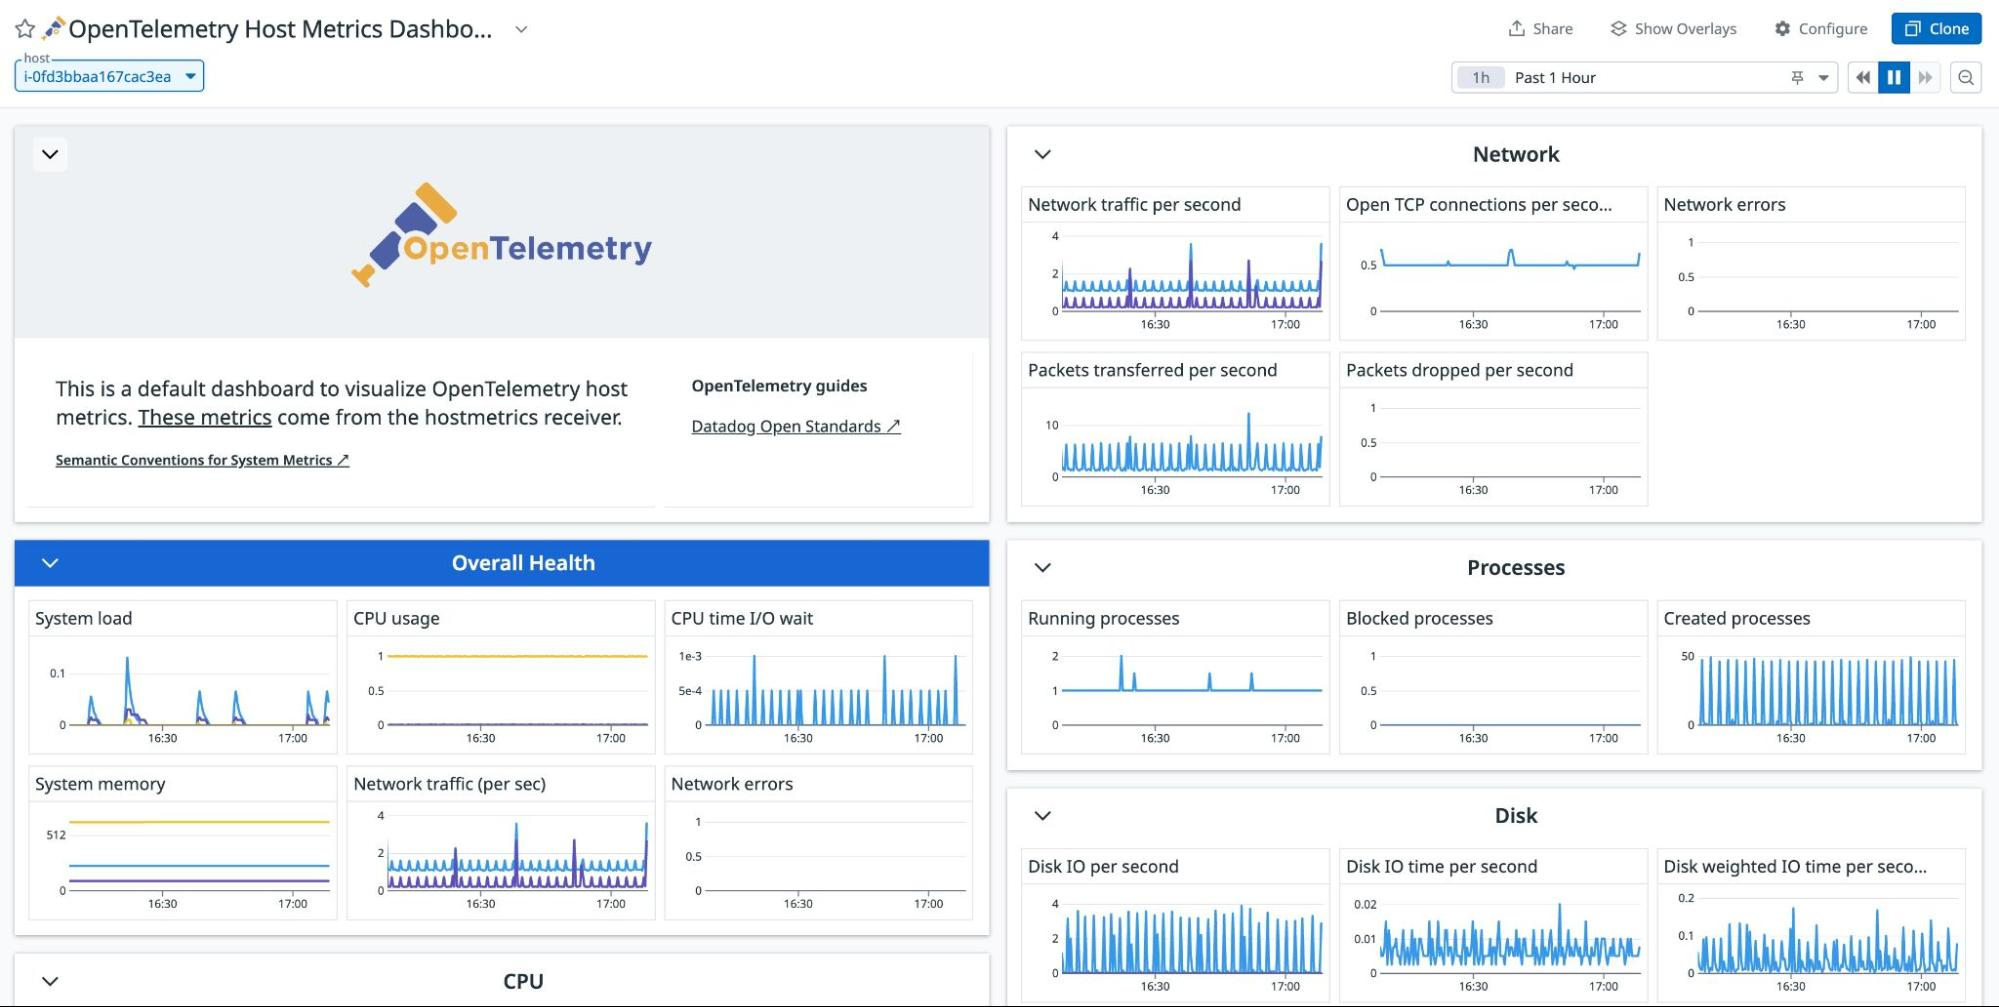
The metrics, mapped to Datadog metrics, are used in the following views:
Note: To correlate trace and host metrics, configure Unified Service Tagging attributes for each service, and set the host.name resource attribute to the corresponding underlying host for both service and collector instances.
The following table shows which Datadog host metric names are associated with corresponding OpenTelemetry host metric names, and, if applicable, what math is applied to the OTel host metric to transform it to Datadog units during the mapping.
| OTEL | DATADOG | DESCRIPTION | FILTER | TRANSFORM |
|---|---|---|---|---|
| system.cpu.load_average.15m | system.load.15 | Average CPU Load over 15 minutes. | ||
| system.cpu.load_average.1m | system.load.1 | Average CPU Load over 1 minute. | ||
| system.cpu.load_average.5m | system.load.5 | Average CPU Load over 5 minutes. | ||
| system.cpu.utilization | system.cpu.idle | Difference in system.cpu.time since the last measurement per logical CPU, divided by the elapsed time (value in interval [0,1]). | state: idle | × 100 |
| system.cpu.utilization | system.cpu.iowait | Difference in system.cpu.time since the last measurement per logical CPU, divided by the elapsed time (value in interval [0,1]). | state: wait | × 100 |
| system.cpu.utilization | system.cpu.stolen | Difference in system.cpu.time since the last measurement per logical CPU, divided by the elapsed time (value in interval [0,1]). | state: steal | × 100 |
| system.cpu.utilization | system.cpu.system | Difference in system.cpu.time since the last measurement per logical CPU, divided by the elapsed time (value in interval [0,1]). | state: system | × 100 |
| system.cpu.utilization | system.cpu.user | Difference in system.cpu.time since the last measurement per logical CPU, divided by the elapsed time (value in interval [0,1]). | state: user | × 100 |
| system.filesystem.utilization | system.disk.in_use | Fraction of filesystem bytes used. | ||
| system.filesystem.utilization | system.disk.in_use | Fraction of filesystem bytes used. | ||
| system.memory.usage | system.mem.total | Bytes of memory in use. | × 1048576 | |
| system.memory.usage | system.mem.usable | Bytes of memory in use. | state: free, cached, buffered | × 1048576 |
| system.network.io | system.net.bytes_rcvd | The number of bytes transmitted and received. | direction: receive | |
| system.network.io | system.net.bytes_sent | The number of bytes transmitted and received. | direction: transmit | |
| system.paging.usage | system.swap.free | Swap (unix) or pagefile (windows) usage. | state: free | × 1048576 |
| system.paging.usage | system.swap.used | Swap (unix) or pagefile (windows) usage. | state: used | × 1048576 |
See OpenTelemetry Metrics Mapping for more information.
Full example configuration
For a full working example configuration with the Datadog exporter, see host-metrics.yaml.
Example logging output
ResourceMetrics #1
Resource SchemaURL: https://opentelemetry.io/schemas/1.9.0
Resource attributes:
     -> k8s.pod.ip: Str(192.168.63.232)
     -> cloud.provider: Str(aws)
     -> cloud.platform: Str(aws_ec2)
     -> cloud.region: Str(us-east-1)
     -> cloud.account.id: Str(XXXXXXXXX)
     -> cloud.availability_zone: Str(us-east-1c)
     -> host.id: Str(i-07e7d48cedbec9e86)
     -> host.image.id: Str(ami-0cbbb5a8c6f670bb6)
     -> host.type: Str(m5.large)
     -> host.name: Str(ip-192-168-49-157.ec2.internal)
     -> os.type: Str(linux)
     -> kube_app_instance: Str(opentelemetry-collector-gateway)
     -> k8s.pod.name: Str(opentelemetry-collector-gateway-688585b95-l2lds)
     -> k8s.pod.uid: Str(d8063a97-f48f-4e9e-b180-8c78a56d0a37)
     -> k8s.replicaset.uid: Str(9e2d5331-f763-43a3-b0be-9d89c0eaf0cd)
     -> k8s.replicaset.name: Str(opentelemetry-collector-gateway-688585b95)
     -> k8s.deployment.name: Str(opentelemetry-collector-gateway)
     -> kube_app_name: Str(opentelemetry-collector)
     -> k8s.namespace.name: Str(otel-ds-gateway)
     -> k8s.pod.start_time: Str(2023-11-20T12:53:08Z)
     -> k8s.node.name: Str(ip-192-168-49-157.ec2.internal)
ScopeMetrics #0
ScopeMetrics SchemaURL:
InstrumentationScope otelcol/hostmetricsreceiver/memory 0.88.0-dev
Metric #0
Descriptor:
     -> Name: system.memory.usage
     -> Description: Bytes of memory in use.
     -> Unit: By
     -> DataType: Sum
     -> IsMonotonic: false
     -> AggregationTemporality: Cumulative
NumberDataPoints #0
Data point attributes:
     -> state: Str(used)
StartTimestamp: 2023-08-21 13:45:37 +0000 UTC
Timestamp: 2023-11-20 13:04:19.489045896 +0000 UTC
Value: 1153183744

