This product is not supported for your selected Datadog site. ().

This processor parses the specified JSON field into objects. For example, if you have a message field that contains stringified JSON:

{
    "foo": "bar",
    "team": "my-team",
    "message": "{\"level\":\"info\",\"timestamp\":\"2024-01-15T10:30:00Z\",\"service\":\"user-service\",\"user_id\":\"12345\",\"action\":\"login\",\"success\":true,\"ip_address\":\"192.168.1.100\"}"
    "app_id":"streaming-services",
    "ddtags": [
    "kube_service:my-service",
    "k8_deployment :your-host"
    ]
}

Use the Parse JSON processor to parse the message field so the message field has all the attributes within a nested object.

The parse json processor with message as the field to parse on

This output contains the message field with the parsed JSON:

{
    "foo": "bar",
    "team": "my-team",
    "message": {
        "action": "login",
        "ip_address": "192.168.1.100",
        "level": "info",
        "service": "user-service",
        "success": true,
        "timestamp": "2024-01-15T10:30:00Z",
        "user_id": "12345"
    }
    "app_id":"streaming-services",
    "ddtags": [
    "kube_service:my-service",
    "k8_deployment :your-host"
    ]
}

To set up this processor:

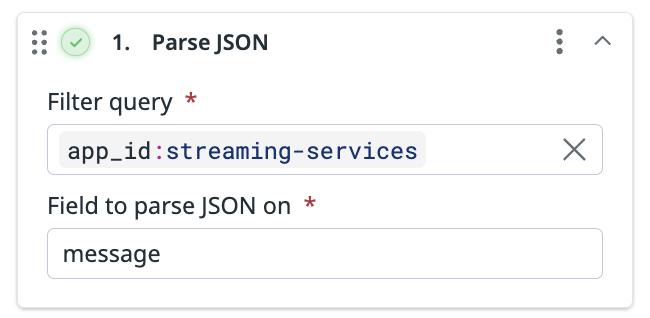
  1. Define a filter query. Only logs that match the specified filter query are processed. All logs, regardless of whether they do or do not match the filter query, are sent to the next step in the pipeline.
  2. Enter the name of the field you want to parse JSON on.
    Note: The parsed JSON overwrites what was originally contained in the field.

Filter query syntax

Each processor has a corresponding filter query in their fields. Processors only process logs that match their filter query. And for all processors except the filter processor, logs that do not match the query are sent to the next step of the pipeline. For the filter processor, logs that do not match the query are dropped.

The following are filter query examples:

  • NOT (status:debug): This filters for logs that do not have the status DEBUG.
  • status:ok service:flask-web-app: This filters for all logs with the status OK from your flask-web-app service.
    • This query can also be written as: status:ok AND service:flask-web-app.
  • host:COMP-A9JNGYK OR host:COMP-J58KAS: This filter query only matches logs from the labeled hosts.
  • user.status:inactive: This filters for logs with the status inactive nested under the user attribute.
  • http.status:[200 TO 299] or http.status:{300 TO 399}: These two filters represent the syntax to query a range for http.status. Ranges can be used across any attribute.

Learn more about writing filter queries in Observability Pipelines Search Syntax.