- 重要な情報
- はじめに
- 用語集
- Standard Attributes
- ガイド
- インテグレーション
- エージェント
- OpenTelemetry
- 開発者
- Administrator's Guide
- API
- Partners
- DDSQL Reference
- モバイルアプリケーション
- CoScreen
- CoTerm
- Remote Configuration
- Cloudcraft
- アプリ内
- ダッシュボード
- ノートブック
- DDSQL Editor
- Reference Tables
- Sheets
- Watchdog
- アラート設定
- メトリクス
- Bits AI
- Internal Developer Portal
- Error Tracking
- Change Tracking
- Service Management
- Actions & Remediations
- インフラストラクチャー
- Cloudcraft
- Resource Catalog
- ユニバーサル サービス モニタリング
- Hosts
- コンテナ
- Processes
- サーバーレス
- ネットワークモニタリング
- Cloud Cost
- アプリケーションパフォーマンス
- APM
- Continuous Profiler
- データベース モニタリング
- Data Streams Monitoring
- Data Jobs Monitoring
- Data Observability
- Digital Experience
- RUM & セッションリプレイ
- Synthetic モニタリング
- Continuous Testing
- Product Analytics
- Software Delivery
- CI Visibility (CI/CDの可視化)
- CD Visibility
- Deployment Gates
- Test Visibility
- Code Coverage
- Quality Gates
- DORA Metrics
- Feature Flags
- セキュリティ
- セキュリティの概要
- Cloud SIEM
- Code Security
- クラウド セキュリティ マネジメント
- Application Security Management
- Workload Protection
- Sensitive Data Scanner
- AI Observability
- ログ管理
- Observability Pipelines(観測データの制御)
- ログ管理
- CloudPrem
- 管理
Datadog Logs Destination
This product is not supported for your selected Datadog site. ().
このページは日本語には対応しておりません。随時翻訳に取り組んでいます。
翻訳に関してご質問やご意見ございましたら、お気軽にご連絡ください。
翻訳に関してご質問やご意見ございましたら、お気軽にご連絡ください。
Use Observability Pipelines’ Datadog Logs destination to send logs to Datadog Log Management. You can also use AWS PrivateLink to send logs from Observability Pipelines to Datadog.
Setup
Set up the Datadog Logs destination and its environment variables when you set up a pipeline. The information below is configured in the pipelines UI.
Set up the destination
There are no required setup steps.
Optional settings
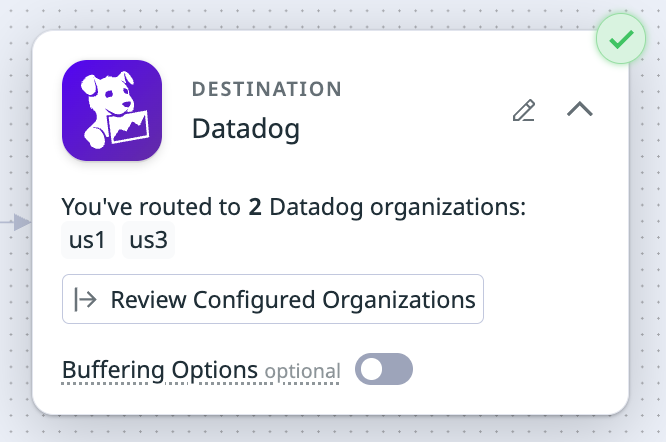
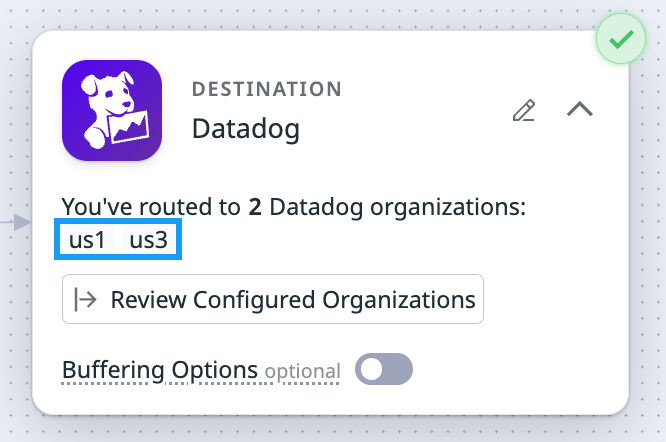
Route logs to multiple Datadog organizations
You can route logs to multiple Datadog organizations. After routing has been set up, you can view metrics for the component or specific organizations to which you are routing logs.
Note: You can route up to 100 Datadog organizations.
Click Route to Multiple Organizations to set up routing to multiple Datadog organizations.
- If you haven’t added any organizations yet, enter organization details as described in the Add a Datadog organization section.
- If you have already added organizations, you can:
- Click on an organization in the table to edit or delete it.
- Use the search bar to find a specific organization by name, filter query, or Datadog site, and then select the organization to edit or delete it.
- View metrics for an organization.
- Click Add organization to route to another Datadog organization.
Note: If you don’t set up routing to multiple Datadog organizations, logs are routed to the default Datadog organization, which is the organization that is tied to the API key when you install the Worker.
Add an organization
Logs that do not match any of the organization filters are dropped. The component metric
Data dropped (intentional) shows the number logs that do not match the filters and are dropped.- Enter a name for the organization.
- Note: The name does not have to correspond to the actual name of the Datadog organization.
- Define a filter query. Only logs that match the specified filter query are sent to the organization. See Observability Pipelines Search Syntax for more information on writing filter queries.
- Select the Datadog organization’s site.
- Enter the identifier for the API key for that Datadog organization.
- Note: Only enter the identifier for the API key. Do not enter the actual API key.
- Click Save.
Buffering
Toggle the switch to enable Buffering Options. Enable a configurable buffer on your destination to ensure intermittent latency or an outage at the destination doesn’t create immediate backpressure, and allow events to continue to be ingested from your source. Disk buffers can also increase pipeline durability by writing logs to disk, ensuring buffered logs persist through a Worker restart. See Destination buffers for more information.
- If left unconfigured, your destination uses a memory buffer with a capacity of 500 events.
- To configure a buffer on your destination:
- Select the buffer type you want to set (Memory or Disk).
- Enter the buffer size and select the unit.
- Maximum memory buffer size is 128 GB.
- Maximum disk buffer size is 500 GB.
- In the Behavior on full buffer dropdown menu, select whether you want to block events or drop new events when the buffer is full.
Set secrets
Note: If you entered identifiers for yours secrets and then choose to use environment variables, the environment variable is the identifier entered prepended with DD_OP. For example, if you entered PASSWORD_1 for the a password identifier, the environment variable for the password is DD_OP_PASSWORD_1.
There are no secret identifiers for this destination.
No environment variables required.
View metrics for the component or specific organizations
You can view metrics at the component level or organization level.
Component-level metrics
To view metrics for the overall Datadog Logs destination:
- Navigate to Observability Pipelines.
- Select your pipeline.
- Click the cog on the Datadog Logs destination and select View details.
Note: The Data dropped (intentional) metric shows logs that didn’t match any of the organizations’ filters.
Organization-level metrics
To view metrics for a specific Datadog organization:
- Navigate to Observability Pipelines.
- Select your pipeline.
- Click the Datadog Logs destination so the organizations show up.
- Click the organization you want to see metrics for.
- Click View Health Metrics.
Alternatively, you can click on Review Configured Organizations in the Datadog Logs destination, and click the graph icon in the Metrics column for the organization you are interested in.
How the destination works
Event batching
A batch of events is flushed when one of these parameters is met. See event batching for more information.
| Maximum Events | Maximum Size (MB) | Timeout (seconds) |
|---|---|---|
| 1,000 | 4.25 | 5 |
AWS PrivateLink
To send logs from Observability Pipelines to Datadog using AWS PrivateLink, see Connect to Datadog over AWS PrivateLink for setup instructions. The two endpoints you need to set up are:
- Logs (User HTTP intake):
- Remote Configuration:
Note: The obpipeline-intake.datadoghq.com endpoint is used for Live Capture and is not available as a PrivateLink endpoint.
Azure Private Link
To send logs from Observability Pipelines to Datadog using Azure Private Link, see Connect to Datadog over Azure Private Link for setup instructions. The two endpoints you need to set up are:
- Logs (User HTTP intake):
http-intake.logs.us3.datadoghq.com - Remote Configuration:
config.us3.datadoghq.com
Note: The obpipeline-intake.datadoghq.com endpoint is used for Live Capture and is not available as a Private Link endpoint.


