- 重要な情報
- はじめに
- 用語集
- Standard Attributes
- ガイド
- インテグレーション
- エージェント
- OpenTelemetry
- 開発者
- Administrator's Guide
- API
- Partners
- DDSQL Reference
- モバイルアプリケーション
- CoScreen
- CoTerm
- Remote Configuration
- Cloudcraft
- アプリ内
- ダッシュボード
- ノートブック
- DDSQL Editor
- Reference Tables
- Sheets
- Watchdog
- アラート設定
- メトリクス
- Bits AI
- Internal Developer Portal
- Error Tracking
- Change Tracking
- Service Management
- Actions & Remediations
- インフラストラクチャー
- Cloudcraft
- Resource Catalog
- ユニバーサル サービス モニタリング
- Hosts
- コンテナ
- Processes
- サーバーレス
- ネットワークモニタリング
- Cloud Cost
- アプリケーションパフォーマンス
- APM
- Continuous Profiler
- データベース モニタリング
- Data Streams Monitoring
- Data Jobs Monitoring
- Data Observability
- Digital Experience
- RUM & セッションリプレイ
- Synthetic モニタリング
- Continuous Testing
- Product Analytics
- Software Delivery
- CI Visibility (CI/CDの可視化)
- CD Visibility
- Deployment Gates
- Test Visibility
- Code Coverage
- Quality Gates
- DORA Metrics
- Feature Flags
- セキュリティ
- セキュリティの概要
- Cloud SIEM
- Code Security
- クラウド セキュリティ マネジメント
- Application Security Management
- Workload Protection
- Sensitive Data Scanner
- AI Observability
- ログ管理
- Observability Pipelines(観測データの制御)
- ログ管理
- CloudPrem
- 管理
Syslog
このページは日本語には対応しておりません。随時翻訳に取り組んでいます。
翻訳に関してご質問やご意見ございましたら、お気軽にご連絡ください。
翻訳に関してご質問やご意見ございましたら、お気軽にご連絡ください。
Overview
Network Device Monitoring (NDM) uses Syslog to provide visibility into the health and performance of your network infrastructure. By integrating your network devices with Datadog through Syslog, you can collect and analyze log data, monitor device behavior, troubleshoot issues, and maintain network stability.
Prerequisites
- Datadog Agent version 7.57 or later installed and running on a host that can receive Syslog messages from your network devices.
- Network devices configured to send Syslog messages either directly to the Datadog Agent, or through a proxy that forwards messages to the Datadog Agent.
Configuration
Ensure the following settings are enabled in your
/etc/datadog-agent/datadog.yamlfile:logs_enabled: true # enable logs collection logs_config: use_sourcehost_tag: true # adds a source_host tags to logs with the source IPCreate a Syslog listener configuration:
In
/etc/datadog-agent/conf.d/, create a directory calledsyslog.d/.In
syslog.d/, create a file namedconf.yamlwith the following:logs: - type: udp port: 514 source: syslog service: <service> # optional tagport: The port the Agent listens on for Syslog messages. Default is 514.type: Set toudportcpbased on your device configuration.source: Custom source name for these logs in Datadog. Usesyslogto correlate with NDM devices.service: Optional service name for unified service tagging.
Restart the Datadog Agent to apply the changes.
sudo systemctl restart datadog-agent
Ensure the following settings are enabled in your
C:\ProgramData\Datadog\datadog.yamlfile:logs_enabled: true # enable logs collection logs_config: use_sourcehost_tag: true # adds a source_host tags to logs with the source IPCreate a Syslog listener configuration:
In
C:\ProgramData\Datadog\conf.d\, create a directory calledsyslog.d/.In
syslog.d/, create a file namedconf.yamlwith the following:logs: - type: udp port: 514 source: syslog service: <service> # optional tagport: The port the Agent listens on for Syslog messages. Default is 514.protocol: Set toudportcpbased on your device configuration.source: Custom source name for these logs in Datadog. Usesyslogto correlate with NDM devices.service: Optional service name for unified service tagging.
Restart the Datadog Agent service from the Services console to apply the changes.
Ensure the following settings are enabled in your
/etc/datadog-agent/datadog.yamlfile in your Docker volume:logs_enabled: true # enable logs collection logs_config: use_sourcehost_tag: true # adds a source_host tags to logs with the source IPCreate a Syslog listener configuration:
Mount a volume to
/etc/datadog-agent/conf.d/and create a directory calledsyslog.d/.In
syslog.d/, create a file namedconf.yamlwith the following:logs: - type: udp port: 514 source: syslog service: <service> # optional tagport: The port the Agent listens on for Syslog messages. Default is 514.protocol: Set toudportcpbased on your device configuration.source: Custom source name for these logs in Datadog. Usesyslogto correlate with NDM devices.service: Optional service name for unified service tagging.
Restart the Docker container where the Agent is installed to apply the changes.
Log parsing
After you complete the above steps, Syslog can start sending log data to Datadog. To ensure NDM correctly associates these logs with your monitored network devices, set up a custom log parsing pipeline that populates the syslog_ip tag with each device’s source IP address.
Note: NDM associates logs with devices when source:syslog AND the syslog_ip tag matches one of the device’s IP addresses.
Choose the appropriate scenario based on your network configuration:
When network devices send Syslog messages directly to the Datadog Agent, the Agent’s use_sourcehost_tag: true setting automatically adds a source_host tag containing the sender’s IP address.
To create the syslog_ip tag, remap the source_host tag using a Log Processing Pipeline:
- In Datadog, navigate to Logs > Log Configuration > Pipelines.
- Create a pipeline or select an existing one.
- Add a Log Remapper processor with the following configuration:
- Source of the tag:
source_host - Target tag:
syslog_ip
- Source of the tag:
When network devices send Syslog through a proxy (such as rsyslog or syslog-ng), the source_host tag reflects the proxy’s IP address instead of the original device’s IP.
To create the syslog_ip tag:
- Configure the proxy to include the original source IP in the Syslog message payload.
- rsyslog example: Use a template like
$template CustomFormat,"%fromhost-ip% %msg%\n"to prepend the source IP to each message.
- rsyslog example: Use a template like
- Create a Log Processing Pipeline to extract and map the IP address:
- In Datadog, navigate to Logs > Log Configuration > Pipelines.
- Create a pipeline or select an existing one.
- Add a Grok Parser processor to extract the IP address from the message into a temporary attribute (for example,
@temp_ip). - Add a Log Remapper processor with the following configuration:
- Source of the attribute:
@temp_ip(or your chosen attribute name) - Target tag:
syslog_ip - Preserve source attribute: Uncheck this option to remove the temporary attribute
- Source of the attribute:
For more information, see the Datadog Log Pipelines documentation.
Verify Syslog messages
After your network devices are configured and the Datadog Agent is running, you can verify that Syslog data is being collected and sent to Datadog:
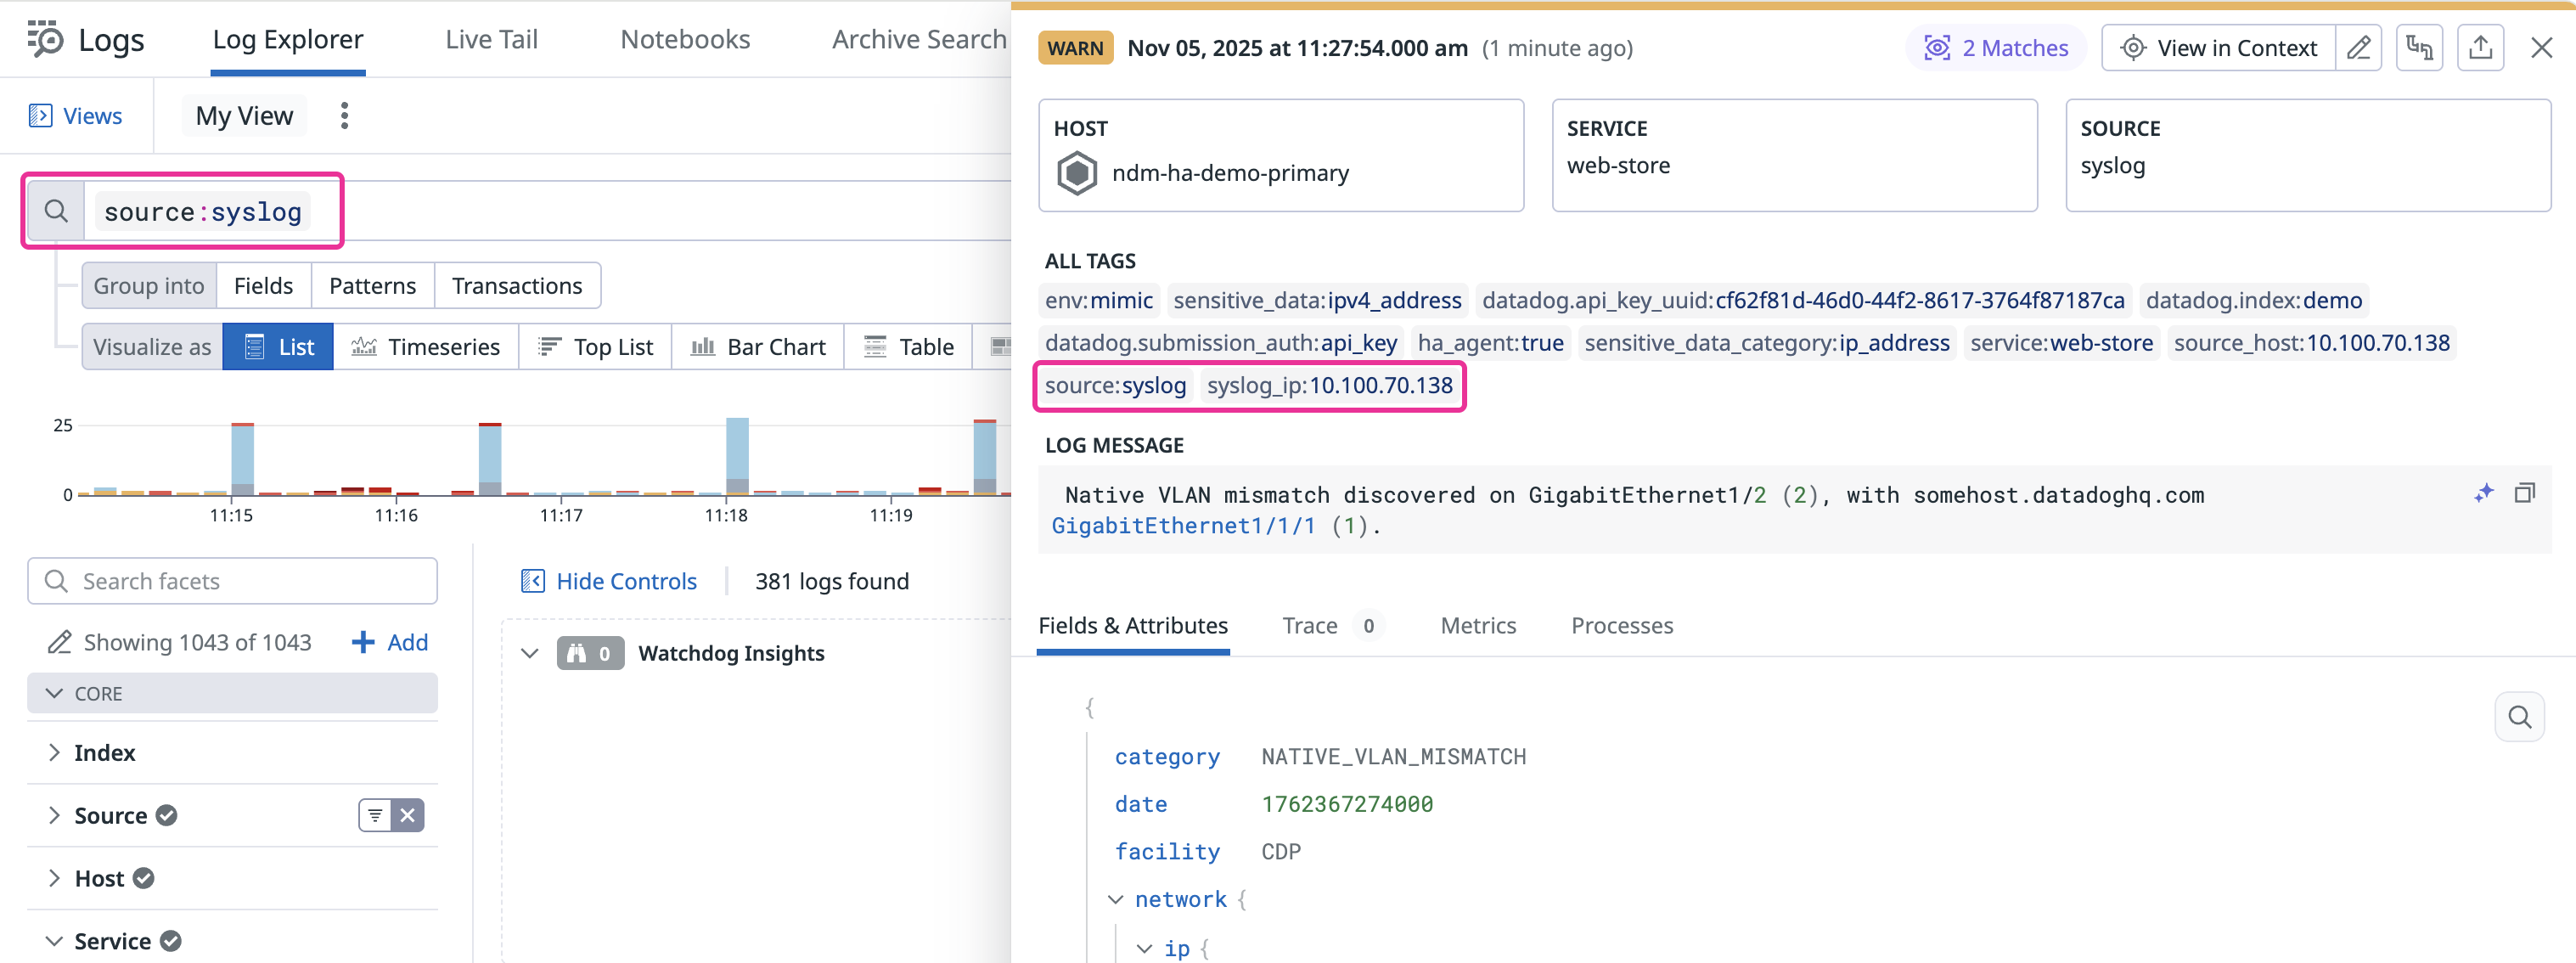
Navigate to the Log Explorer in your Datadog account.
In the search bar, filter by
source:syslog(or whatever source you specified in yourconf.yamlfile). You should see your network device Syslog messages appearing in the Log Explorer.Verify
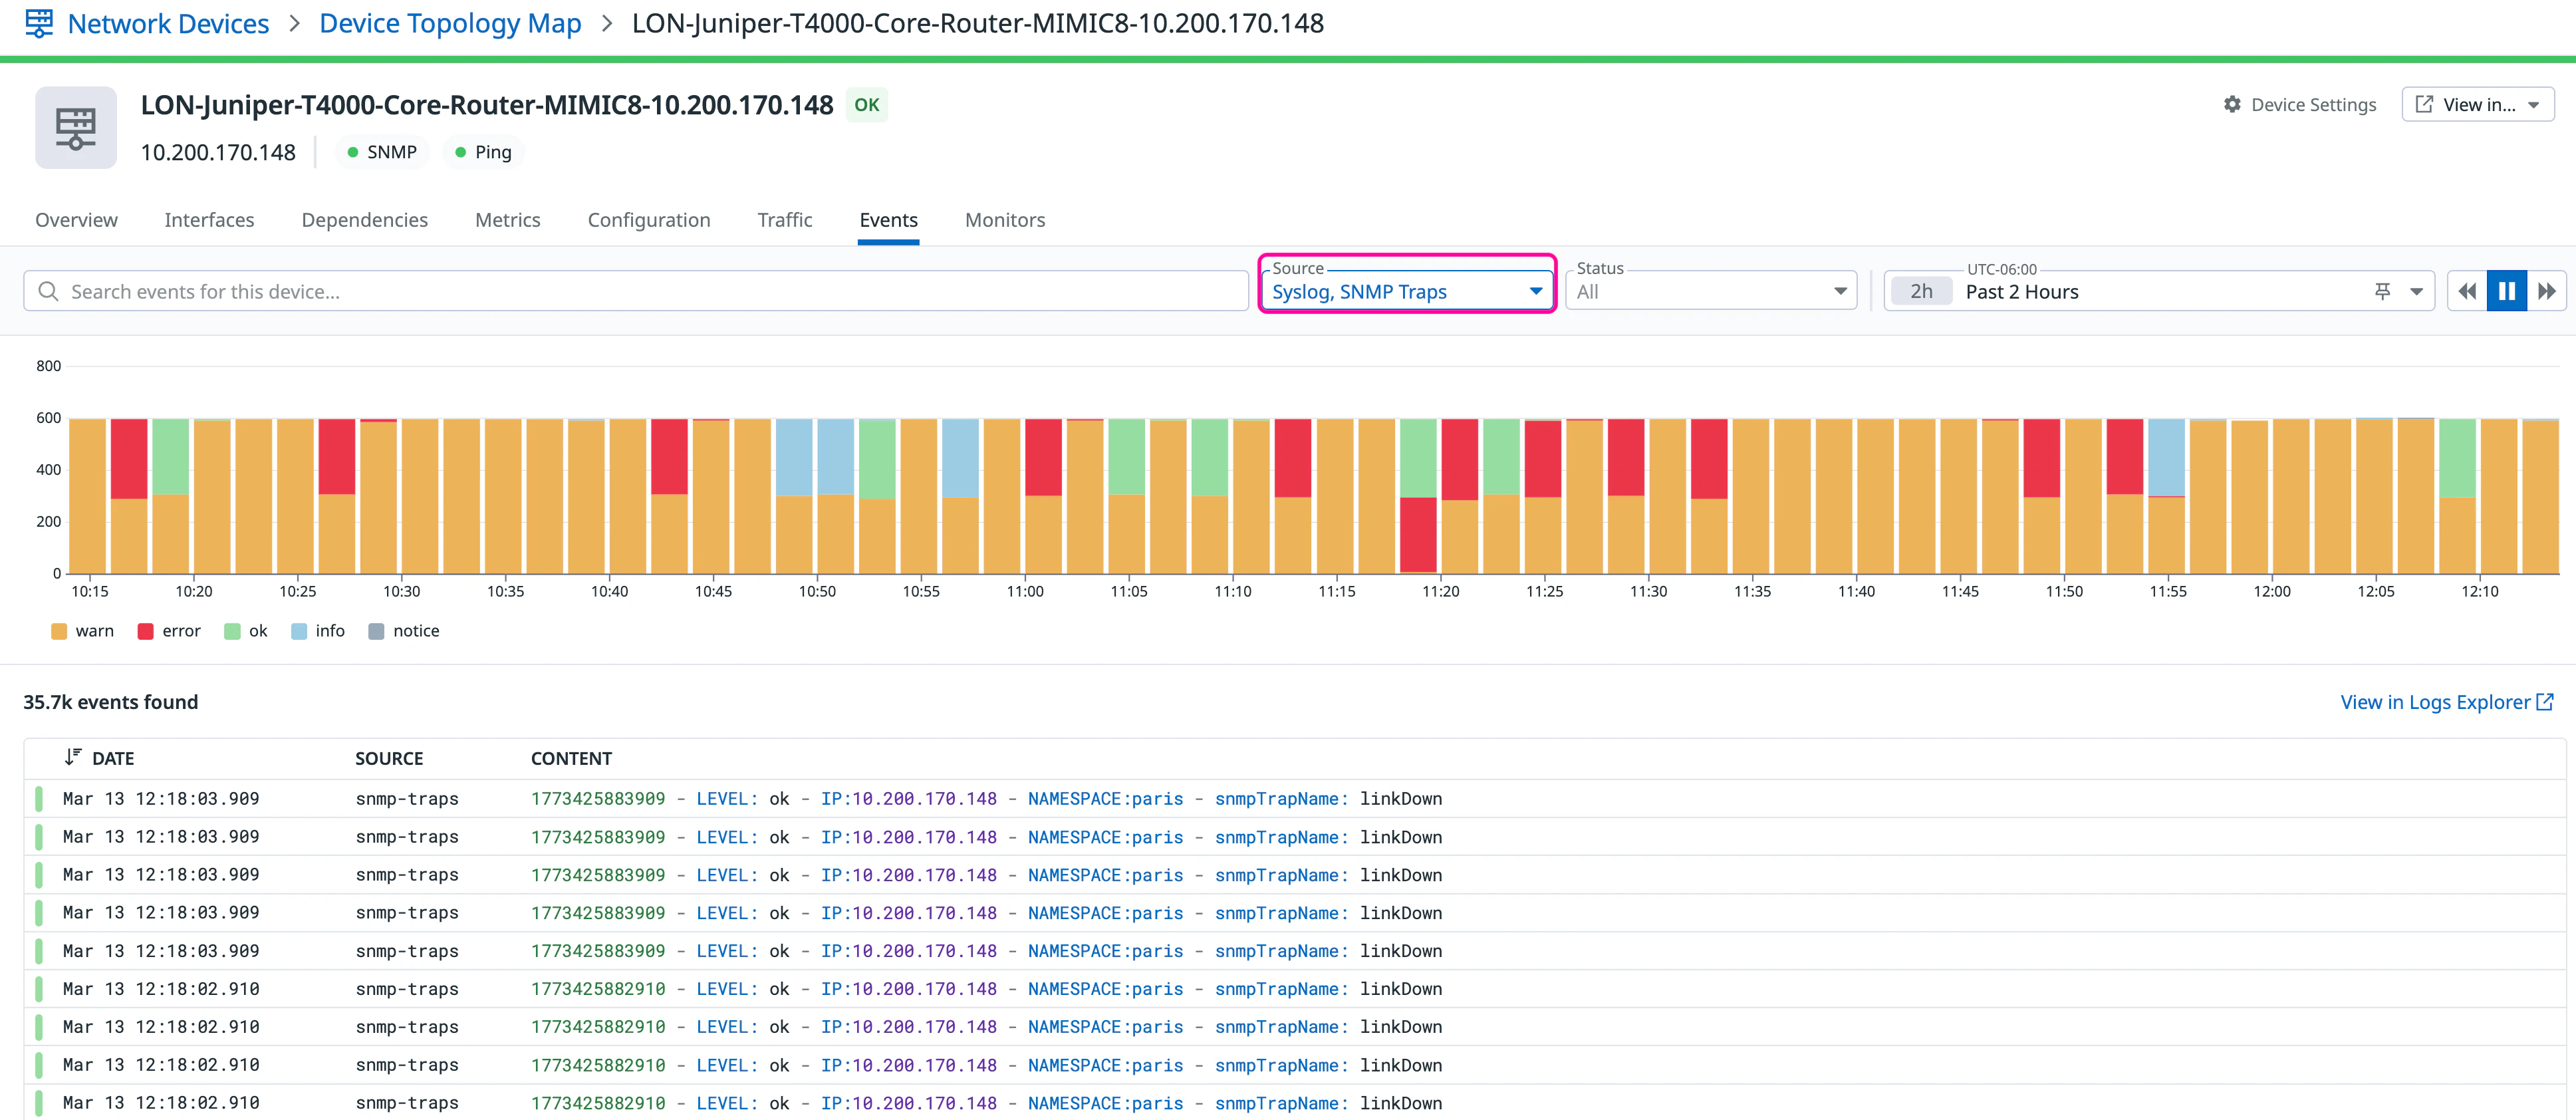
syslog_ip: Ensure that thesyslog_iptag is present and correctly populated with the network device’s IP address for each relevant log entry.Optionally, to observe Syslog messages in NDM, navigate to Infrastructure > Network Devices.
- Select a device that is configured to send Syslog messages.
- In the NDM device view, click the Events tab. Syslog messages and SNMP traps are combined in a single view. Use the filters to narrow results by event type.


