- 重要な情報
- はじめに
- 用語集
- Standard Attributes
- ガイド
- インテグレーション
- エージェント
- OpenTelemetry
- 開発者
- Administrator's Guide
- API
- Partners
- DDSQL Reference
- モバイルアプリケーション
- CoScreen
- CoTerm
- Remote Configuration
- Cloudcraft
- アプリ内
- ダッシュボード
- ノートブック
- DDSQL Editor
- Reference Tables
- Sheets
- Watchdog
- アラート設定
- メトリクス
- Bits AI
- Internal Developer Portal
- Error Tracking
- Change Tracking
- Service Management
- Actions & Remediations
- インフラストラクチャー
- Cloudcraft
- Resource Catalog
- ユニバーサル サービス モニタリング
- Hosts
- コンテナ
- Processes
- サーバーレス
- ネットワークモニタリング
- Cloud Cost
- アプリケーションパフォーマンス
- APM
- Continuous Profiler
- データベース モニタリング
- Data Streams Monitoring
- Data Jobs Monitoring
- Data Observability
- Digital Experience
- RUM & セッションリプレイ
- Synthetic モニタリング
- Continuous Testing
- Product Analytics
- Software Delivery
- CI Visibility (CI/CDの可視化)
- CD Visibility
- Deployment Gates
- Test Visibility
- Code Coverage
- Quality Gates
- DORA Metrics
- Feature Flags
- セキュリティ
- セキュリティの概要
- Cloud SIEM
- Code Security
- クラウド セキュリティ マネジメント
- Application Security Management
- Workload Protection
- Sensitive Data Scanner
- AI Observability
- ログ管理
- Observability Pipelines(観測データの制御)
- ログ管理
- CloudPrem
- 管理
Monitor aggregators
このページは日本語には対応しておりません。随時翻訳に取り組んでいます。
翻訳に関してご質問やご意見ございましたら、お気軽にご連絡ください。
翻訳に関してご質問やご意見ございましたら、お気軽にご連絡ください。
Overview
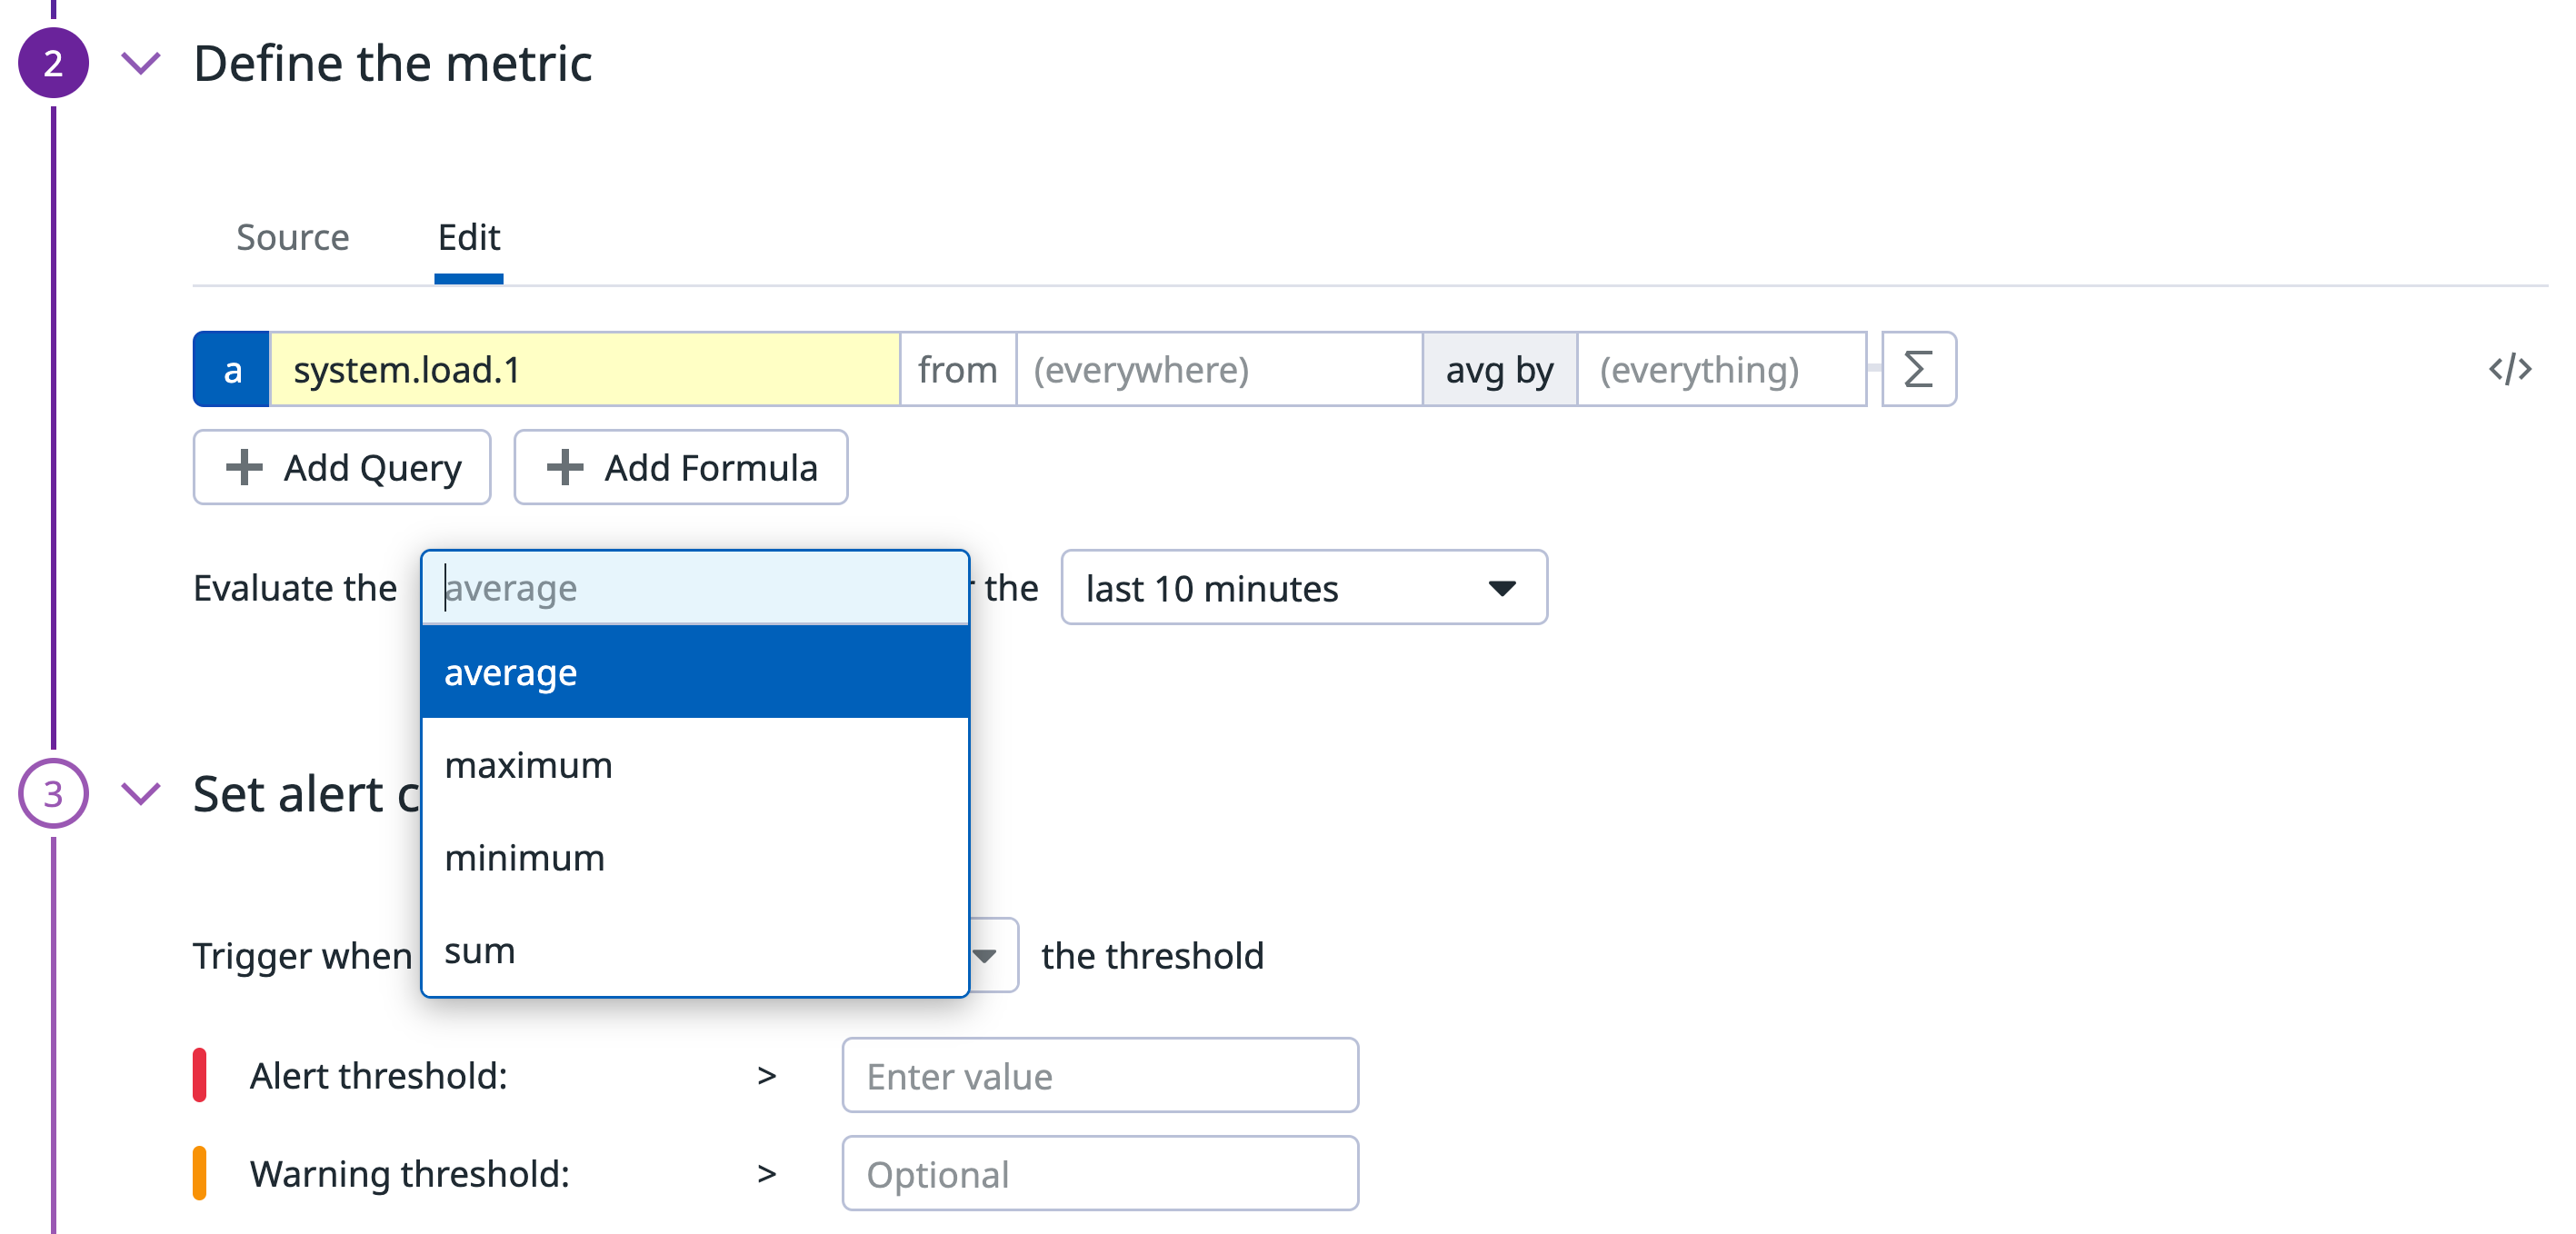
Configure your monitor query to send alerts based on how the data is aggregated with one of the four aggregation methods: average, maximum, minimum, and sum. For this guide, take the same example metric values over a 10 minute evaluation window and apply the different aggregators to see how each monitor would react.
All the examples assume that:
- Queries are calculated with the
classic_eval_path. - The monitor alerts when the values are above a certain threshold.
Average
The monitor takes the values in the evaluation window and calculates the average of all the data points. This average value is compared to the defined threshold. A common use case for this aggregator is checking if the metric data is too high or too low.
Example
You want a monitor to send a notification when the average over the past 10 minutes goes over 30. What state is the monitor in at minute 3:10?
$$(\10+15+12+8+11+14+13+25+37+45+50)/11 = 22$$
Answer
OK state, this monitor is not going to alert.
Maximum and above
The monitor takes the values in the evaluation window and compares each value against the defined threshold. If any single data point in the evaluation window is above the threshold, the monitor will alert.
For monitors configured to alert when below the threshold, the behavior is reversed.
Example
You want a monitor to send a notification if at any point in the last 10 minutes the value of the metric is above 40. What state is the monitor in at minute 3:10?
You want a monitor to send a notification if at any point in the last 10 minutes the value of the metric is above 50. What state is the monitor in at minute 3:10?
Answer
ALERT state, the last two values in the past 10 minutes are 45 and 50. This monitor is going to alert.
OK state, the threshold is 50 and the last value is not above 50. This monitor is not going to alert.
Minimum and above
The monitor takes the values in the evaluation window and compares each value against the defined threshold. All values in the window must be above the threshold. If the minimum value is above the threshold, that means all points in the window are also above the threshold.
For monitors that are configured to alert when below the threshold, the behavior is reversed.
Example
You want a monitor to alert if the minimum metric value is above 10 at any point in the last 10 minutes. What state is the monitor in at minute 3:10?
Answer
OK state, the value at 3:00 (10) and 3:03 (8) is NOT above 10.
Sum
The monitor takes the values in the evaluation window and compares the sum value against the defined threshold. This aggregator adds the value of each data point, not the number of data points. A use case would be for a metric that counts occurrences of errors or restarts. This is why as_count() metrics have to use the sum aggregator. For more information, see the as_count() in monitor evaluations guide.
Example
You want a monitor to send a notification when the sum of values over the past 10 minutes goes over 250. What state is this monitor in at minute 3:10?
$$10+15+12+8+11+14+13+25+37+45+50 = 240$$
Answer
OK state, this monitor is not going to alert.
Visualizing aggregators
You can see different results depending on the aggregation method you are using in your query and your evaluation aggregation. The aggregation methods below use the same metric. You can see how each method affects the way the metric is aggregated in a timeseries.
| Aggregation | Resulting graph |
|---|---|
Average (avg by): average value of the metric | |
Maximum (max by): maximum value of the metric | |
Minimum (min by): minimum value of the metric | |
Sum (sum by): total of all metric values added up |
Further Reading
お役に立つドキュメント、リンクや記事:

![Example metric values over a 10 minute evaluation window [10, 15, 12, 8, 11, 14, 13, 25, 37, 45, 50]](https://datadog-docs.imgix.net/images/monitors/guide/monitor_aggregators/metric_values_example.6afd8f227193b49343de20dbaab6bdca.png?auto=format)


