- 重要な情報
- はじめに
- 用語集
- Standard Attributes
- ガイド
- インテグレーション
- エージェント
- OpenTelemetry
- 開発者
- Administrator's Guide
- API
- Partners
- DDSQL Reference
- モバイルアプリケーション
- CoScreen
- CoTerm
- Remote Configuration
- Cloudcraft
- アプリ内
- ダッシュボード
- ノートブック
- DDSQL Editor
- Reference Tables
- Sheets
- Watchdog
- アラート設定
- メトリクス
- Bits AI
- Internal Developer Portal
- Error Tracking
- Change Tracking
- Service Management
- Actions & Remediations
- インフラストラクチャー
- Cloudcraft
- Resource Catalog
- ユニバーサル サービス モニタリング
- Hosts
- コンテナ
- Processes
- サーバーレス
- ネットワークモニタリング
- Cloud Cost
- アプリケーションパフォーマンス
- APM
- Continuous Profiler
- データベース モニタリング
- Data Streams Monitoring
- Data Jobs Monitoring
- Data Observability
- Digital Experience
- RUM & セッションリプレイ
- Synthetic モニタリング
- Continuous Testing
- Product Analytics
- Software Delivery
- CI Visibility (CI/CDの可視化)
- CD Visibility
- Deployment Gates
- Test Visibility
- Code Coverage
- Quality Gates
- DORA Metrics
- Feature Flags
- セキュリティ
- セキュリティの概要
- Cloud SIEM
- Code Security
- クラウド セキュリティ マネジメント
- Application Security Management
- Workload Protection
- Sensitive Data Scanner
- AI Observability
- ログ管理
- Observability Pipelines(観測データの制御)
- ログ管理
- CloudPrem
- 管理
Logs Cost Attribution
このページは日本語には対応しておりません。随時翻訳に取り組んでいます。
翻訳に関してご質問やご意見ございましたら、お気軽にご連絡ください。
翻訳に関してご質問やご意見ございましたら、お気軽にご連絡ください。
Overview
Datadog provides log usage information through the Log Estimated Usage dashboard, the Plan and Usage section in the app, and the available logs usage metrics. However, there might be situations where you want visibility into more granular cost attribution data, such as for specific teams.
This guide walks you through the steps on how to create custom metrics and a dashboard to see your log cost attribution for different teams. You can also use this process for other attributes, such as departments, projects, products, regions, and so on.
- Configure custom tags.
- Generate custom log metrics with those tags.
- Create widgets in a dashboard for the custom log metrics.
Create a new log pipeline
Create a new log pipeline that filters to logs for which you want to attribute costs. For this example, filter to the subset of logs that you want to breakdown by team.
- Navigate to Logs Pipelines.
- Click Add a new pipeline.
- Enter the filter for logs you want to attribute costs.
- Enter a name for the pipeline. For example,
Cost attribution by team. - Optionally, add tags and a description.
- Click Create.
Leave the new pipeline at the end of the list of pipelines. This lets the logs go through the other pipelines so that those tags and attributes are created first.
Add all processors you create for this cost attribution example to the new pipeline.
Add a team tag
Datadog recommends that you use one of these tagging methods to add the team tag to logs before ingestion.
However, if you need to configure the tag during ingestion, follow these steps to create and add a team tag.
You can use this process to create the attributes you want for breaking down your log usage (for example, by departments, products, regions, and so forth).
Create a new team attribute
Use a Category Processor to create a new team attribute for your logs.
- Navigate to the new pipeline and click Add processor.
- Select Category Processor for the processor type.
- Enter a name for the processor. For example, “Create team attribute”.
- Enter
teamin the Set target category attribute field. This creates ateamattribute. - In the Populate category section, add a category for each team. For example, to add the tag
team:service_ato log events that matchservice:aandenv:prod:- Enter
service:aandenv:prodin the All events that match field. - Enter
service_ain the Appear under the value name field. - Click Add.
- Enter
- Add the other teams as separate categories.
- Click Create.
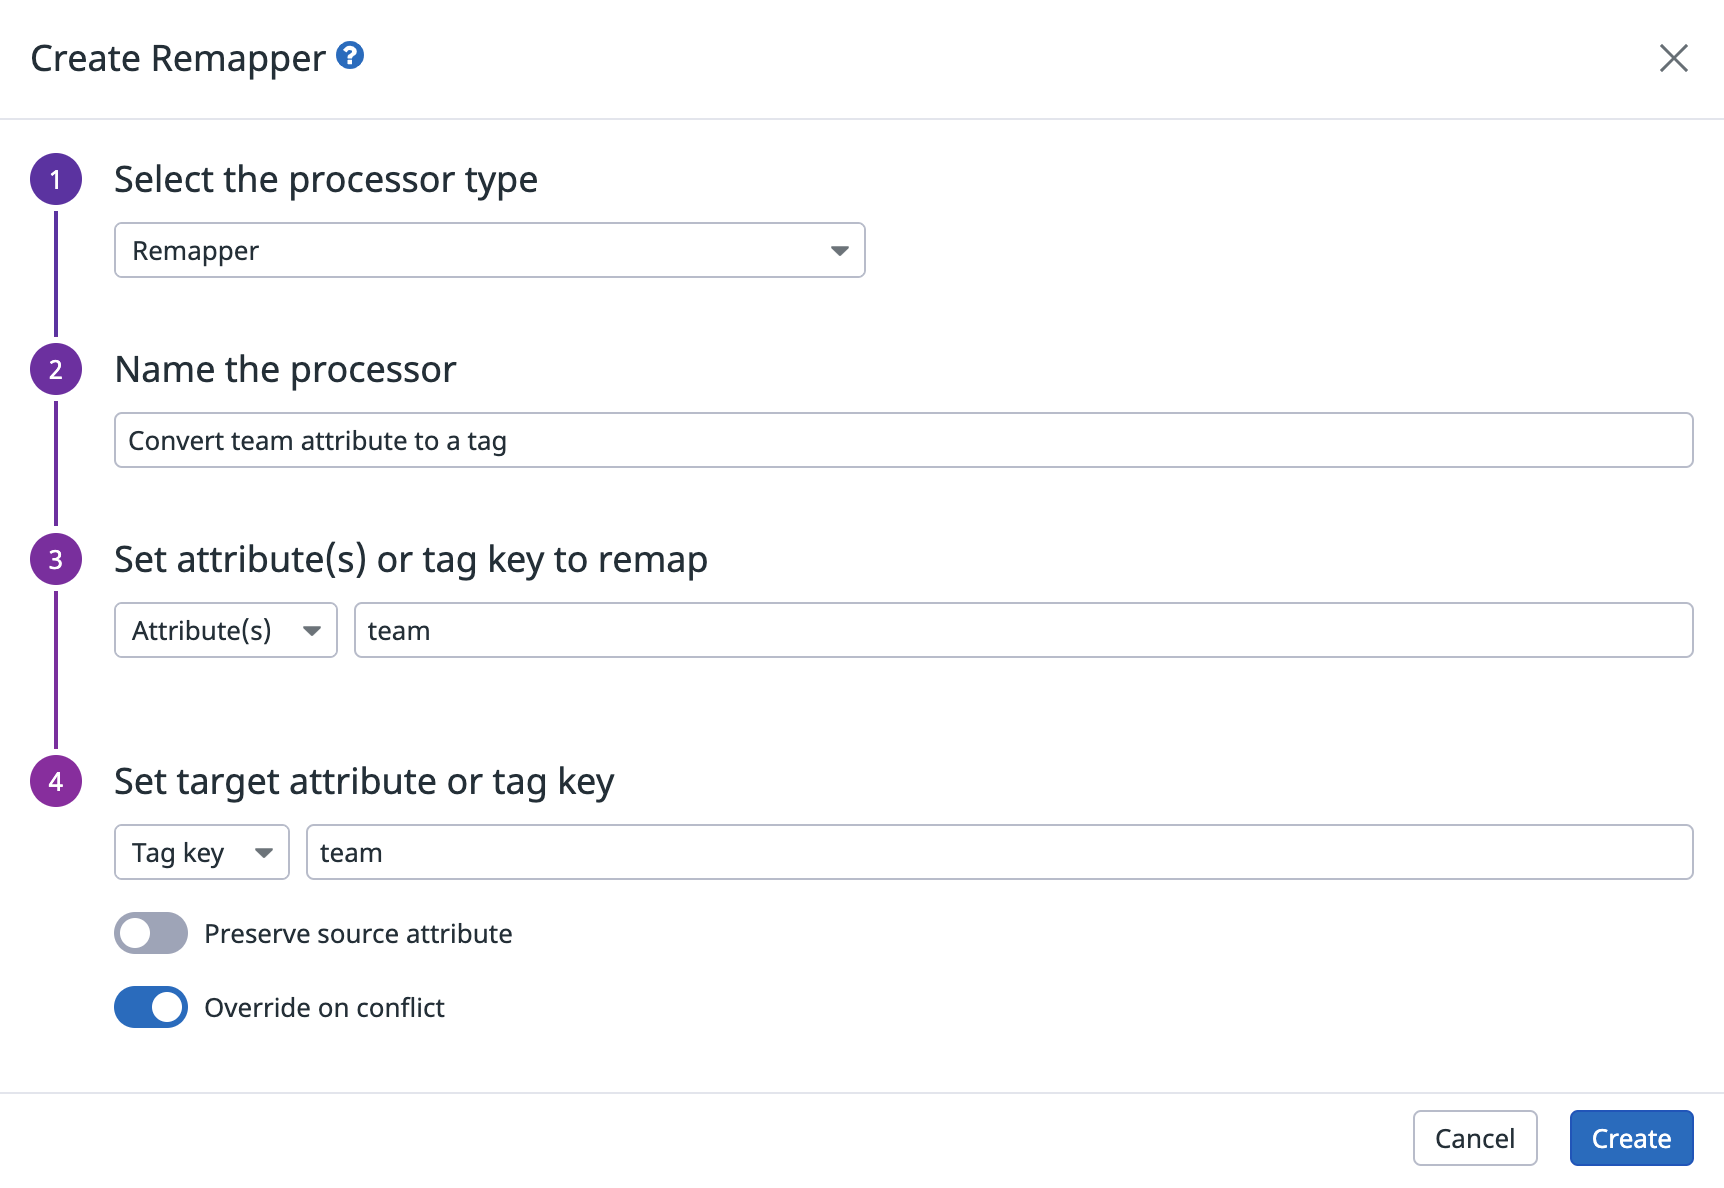
Create a remapper to convert the team attribute to a tag
- Navigate to the pipeline and click Add processor.
- Select Remapper for the processor type.
- Enter a name for the processor. For example, “Convert team attribute to tag”.
- In the Set attribute(s) or tag key to remap section, select Attribute(s) and enter
team. - In the Set target attribute or tag key section, select Tag key and enter
team. - Disable Preserve source attribute to make sure the attribute is removed and only the tag is kept.
- Enable Override on conflict.
- Click Create.
Configure custom tags
Create custom tags so you can organize custom log usage metrics into categories that are relevant to your use case. For this example, create the following tags:
retention_periodfor indicating the number of days for which logs are retained in Datadog indexes.online_archivesfor indicating whether logs have been routed to Online Archives.sdsfor indicating whether logs have been scanned by the Sensitive Data Scanner.
Create a retention_period tag
Datadog recommends that you set up the
retention_period tag even if your indexes all have the same retention period. This makes sure that if you start using multiple retention periods, all logs are tagged with its retention period.retention_period is the number of days your logs are retained in Datadog indexes. Since indexing billing costs are incurred based on the number of days that the logs are retained, use the retention_period tag to associate each log with its retention period to see cost attribution.
Datadog recommends using the following method to configure the retention_period tag:
- Create a new
index_nameattribute. - Create a new
retention_periodattribute. - Create a Remapper to convert the
retention_periodattribute to a tag.
Create a new index_name attribute
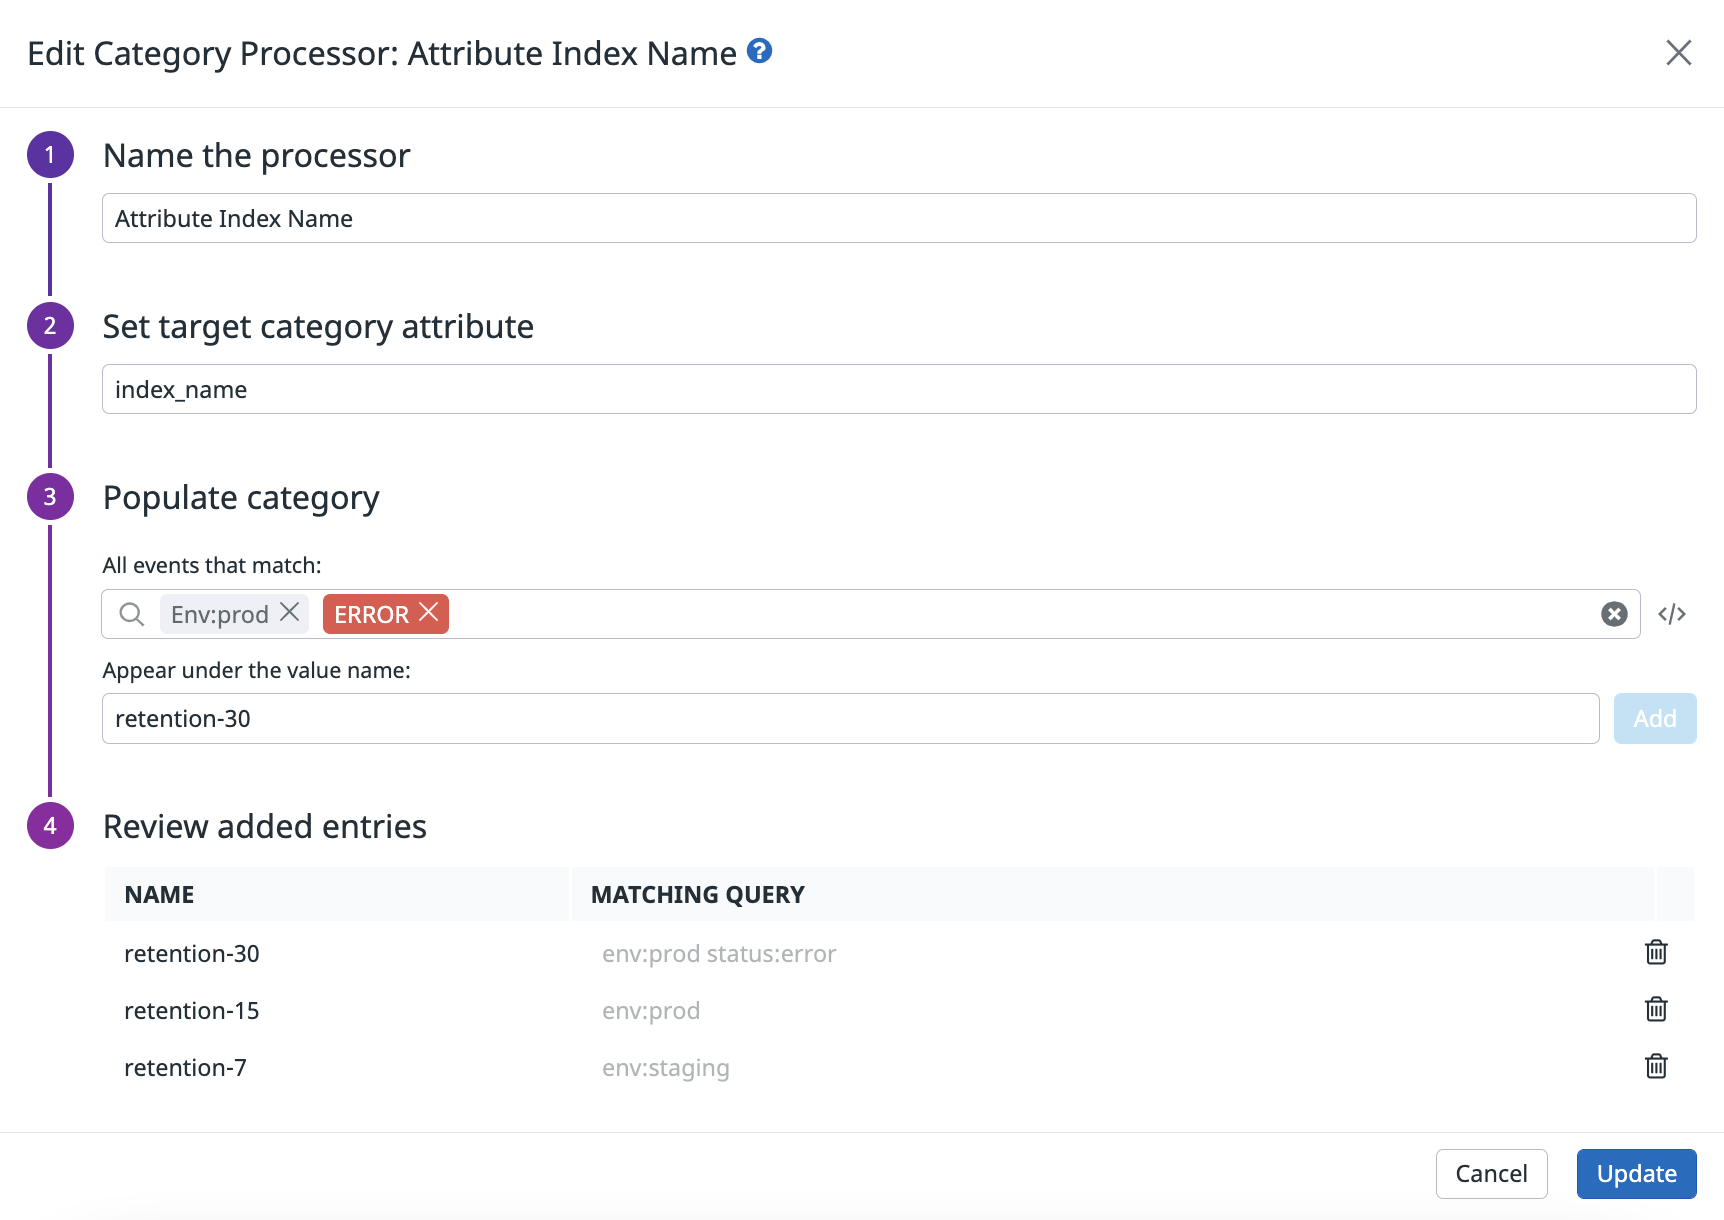
Use a Category Processor to create a new index_name attribute for identifying the index to which the logs are routed.
- Navigate to the pipeline previously created and click Add processor.
- Select Category Processor for the processor type.
- Enter a name for the processor. For example, “Create index_name attribute”.
- Enter index_name in the Set target category attribute field. This creates an
index_nameattribute. - Add a category for each index. For example, if you have an index named
retention-7for all logs tagged withenv:staging:Then, in the Populate category section:- Enter
env:stagingin the All events that match field. - Enter
retention-7in the Appear under the value name field. - Click Add.
- Enter
- Add the other indexes as separate categories.
- Click Create.
Create a new retention_period attribute
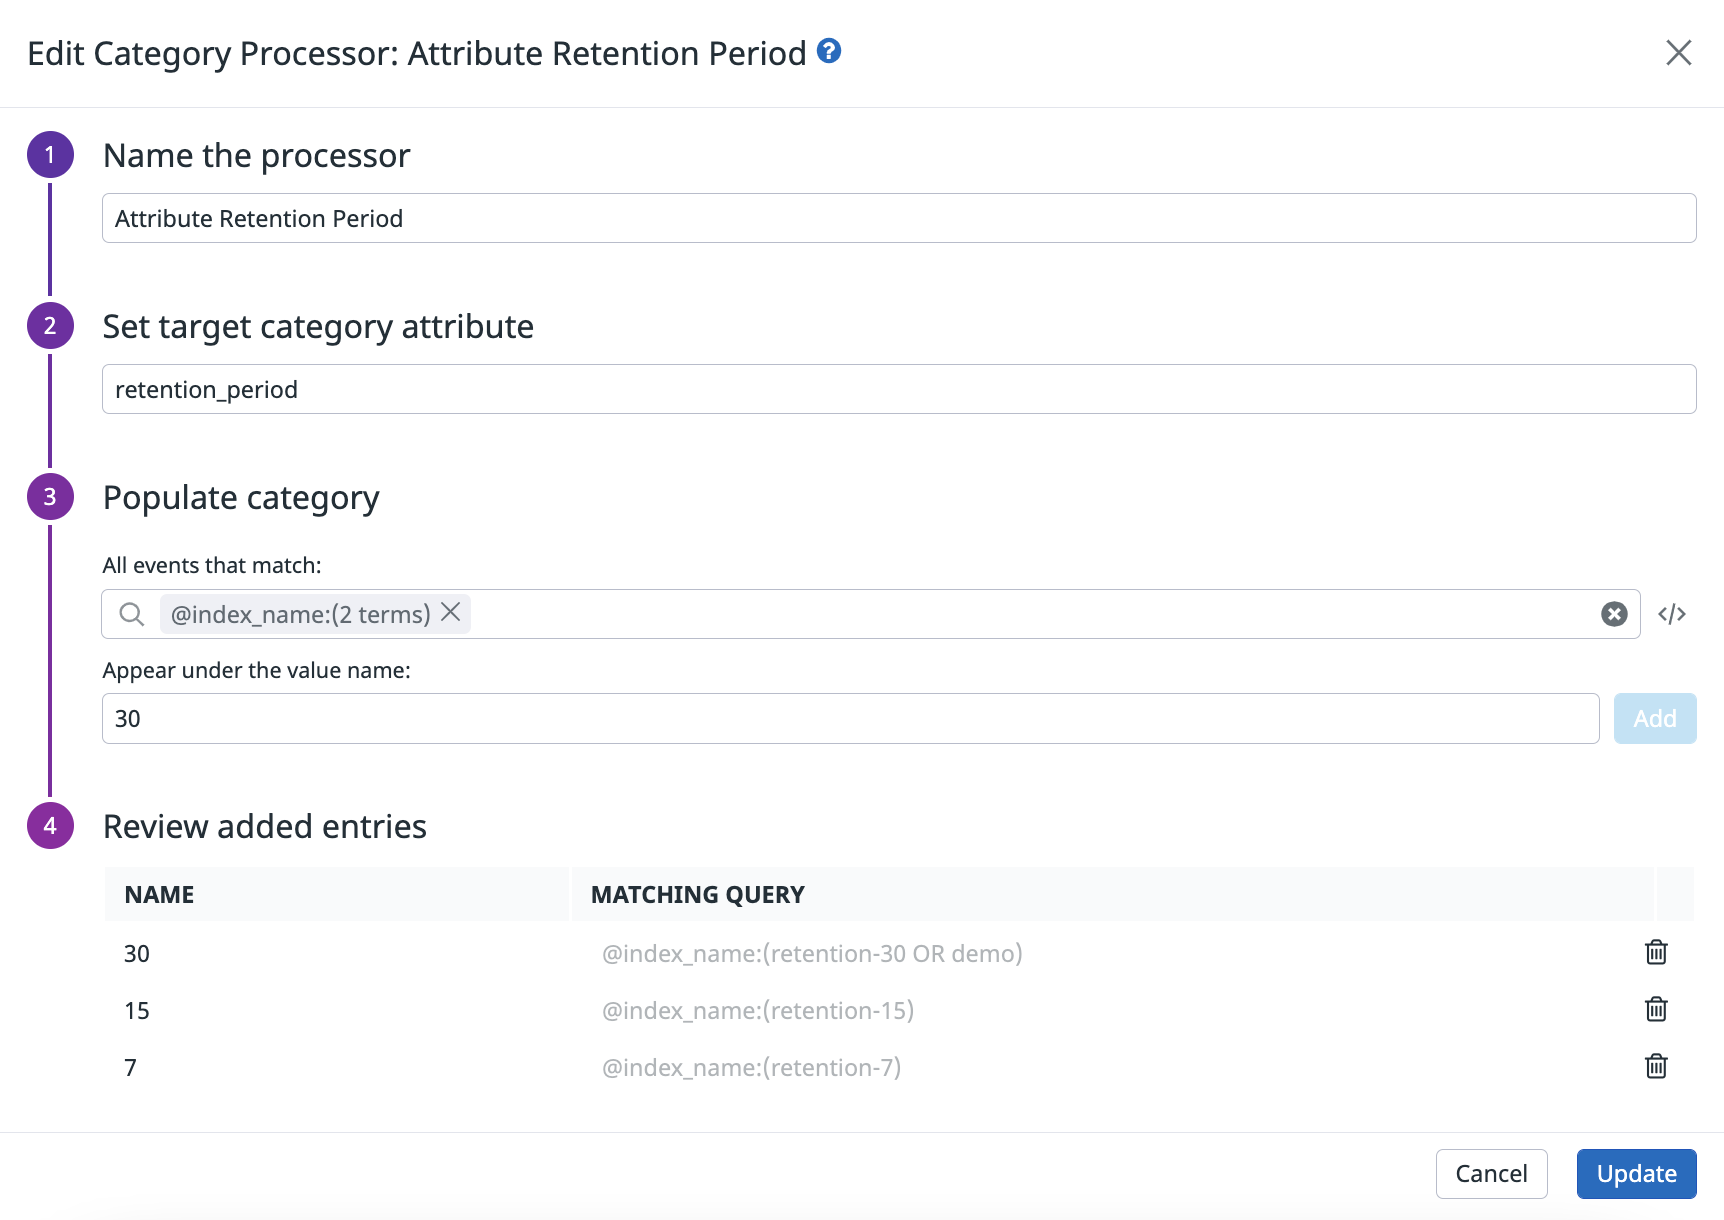
Use a Category Processor to create a new retention_period attribute to associate the index with its retention period.
- Navigate to the pipeline and click Add processor.
- Select Category Processor for the processor type.
- Enter a name for the processor. For example, “Create retention_period attribute”.
- Enter
retention_periodin the Set target category attribute field. This creates aretention_periodattribute. - Add a category for each retention period. For example, if you have a 7-day retention index named
retention-7, then in the Populate category section:- Enter
@index_name:(retention-7)in the All events that match field. - Enter
7in the Appear under the value name field. - Click Add.
- Enter
- Add the other retention periods as separate categories.
- Click Create.
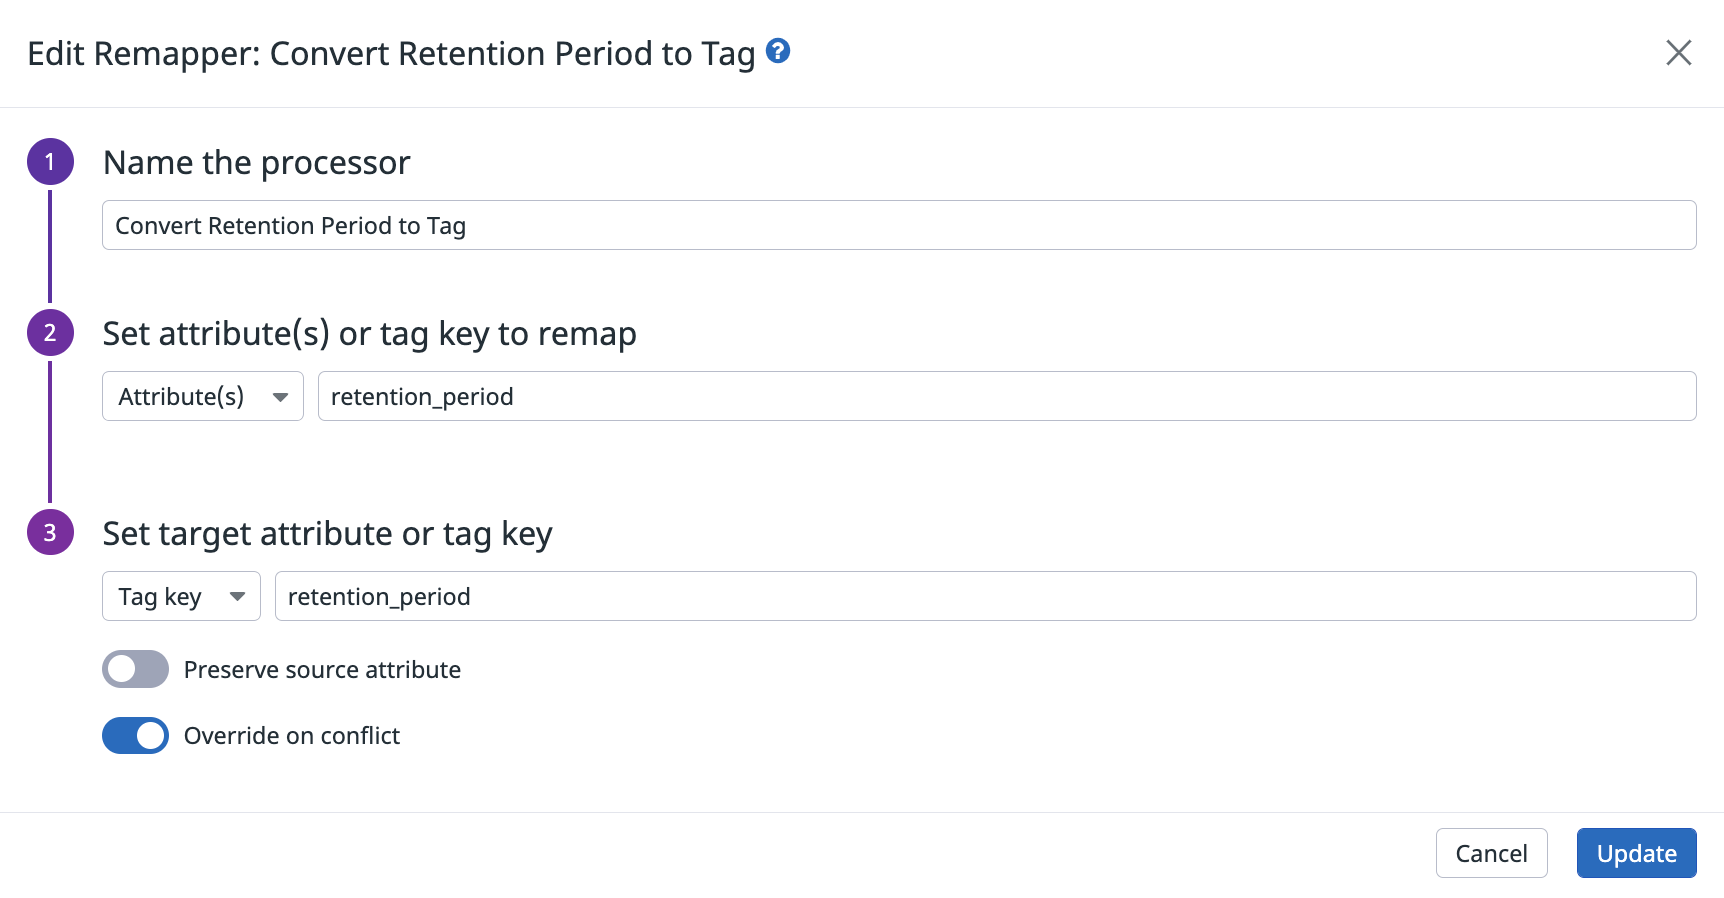
Create a remapper to convert the retention_period attribute to a tag
- Navigate to the pipeline and click Add processor.
- Select Remapper for the processor type.
- Enter a name for the processor. For example, “Convert retention_period attribute to tag”.
- In the Set attribute(s) or tag key to remap section, select Attribute(s) and enter
retention_period. - In the Set target attribute or tag key section, select Tag key and enter
retention_period. - Disable Preserve source attribute to make sure the attribute is removed and only the tag is kept.
- Enable Override on conflict.
- Click Create.
Create an online_archives tag
Datadog recommends that you set up the
online_archives tag even if none of your indexes have online archives enabled. This ensures that if you start using Online Archives, the relevant logs are tagged with online_archives.The online_archives tag indicates whether or not your logs have been routed to Online Archives. Since Online Archives are charged differently than standard indexing, use the online_archives tag to determine which logs have been routed to Online Archives and see cost attribution.
Datadog recommends using the following method to configure the online_archive tag:
Create an online_archives attribute
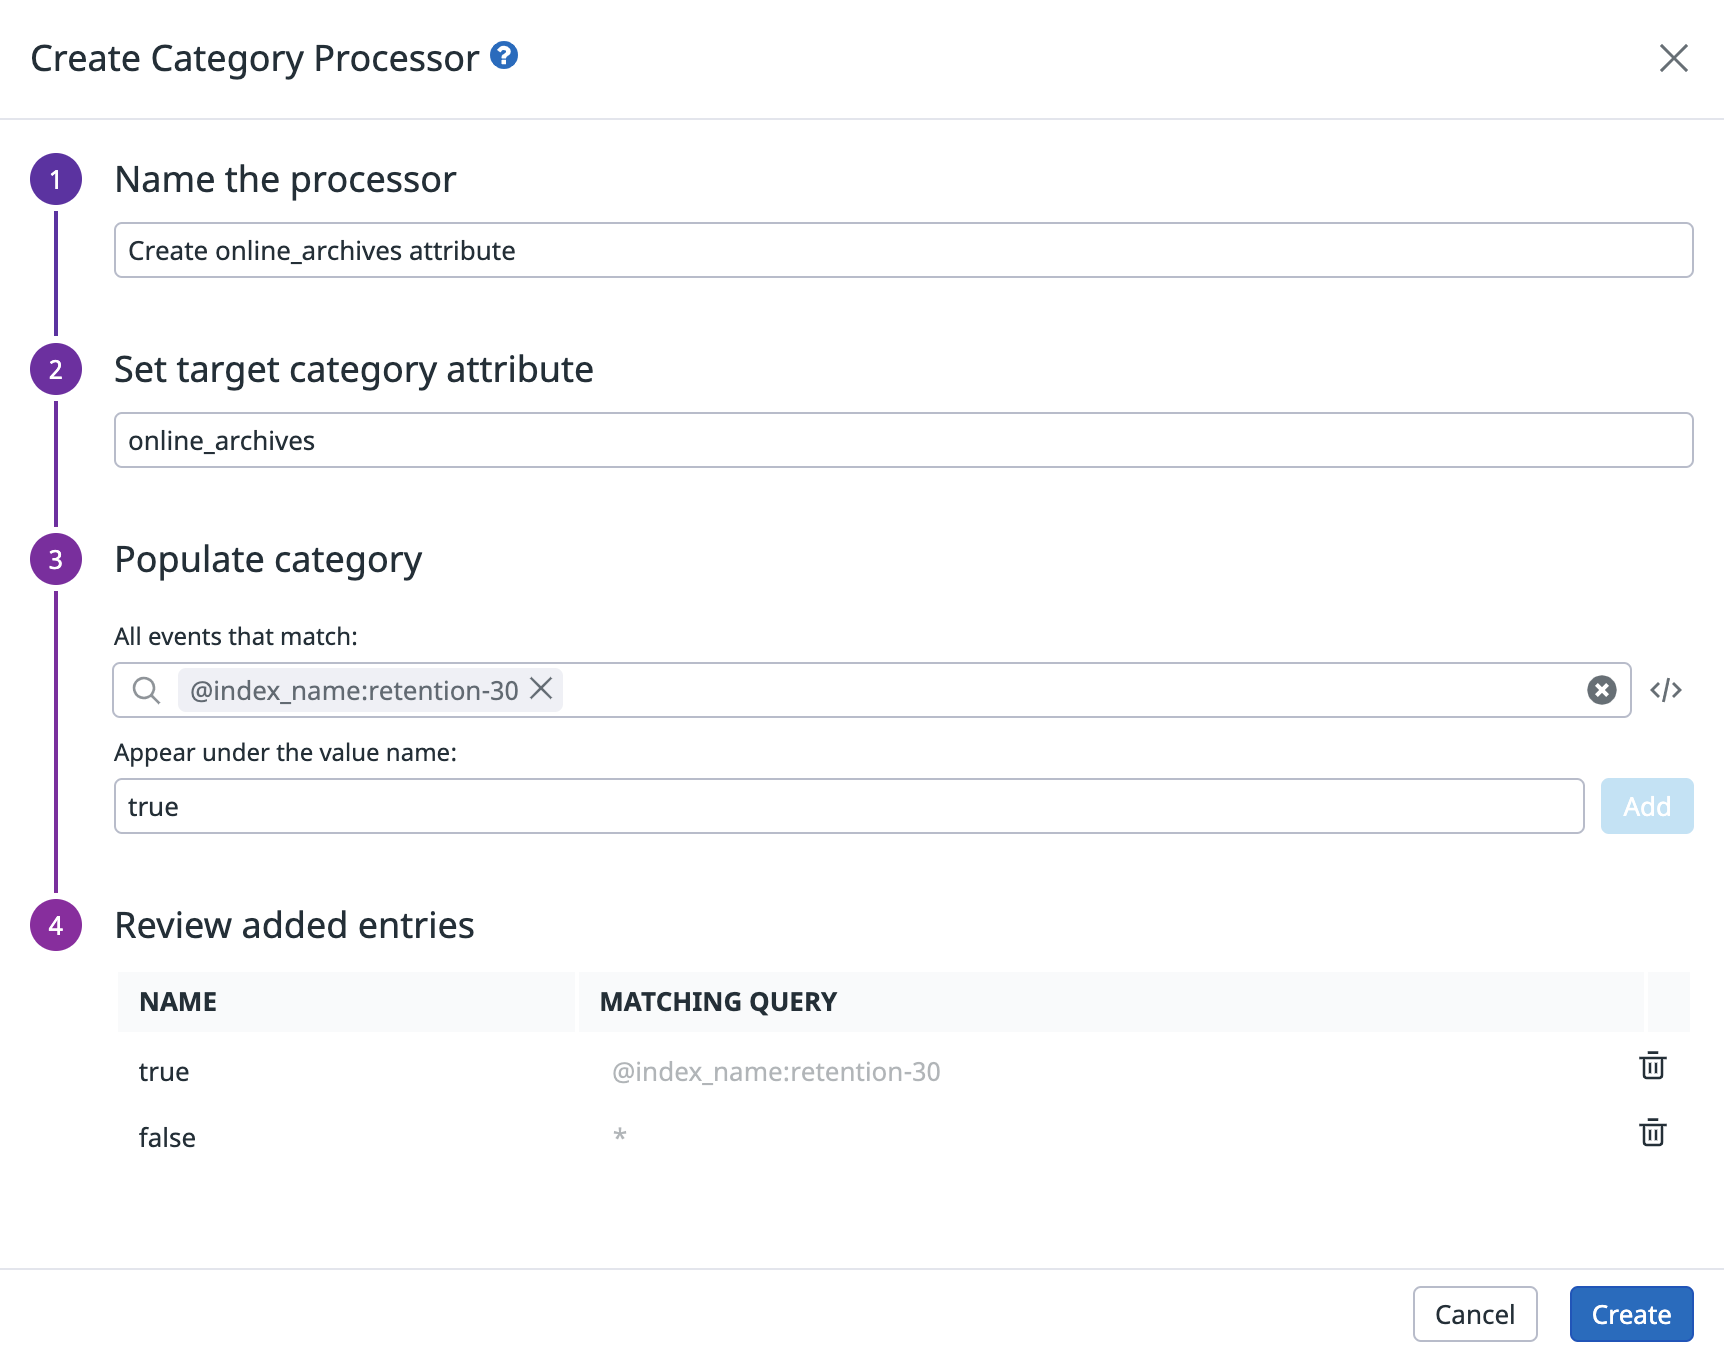
Use a Category Processor to create a new online_archives attribute to indicate whether or not the associated index has Online Archives enabled.
- Navigate to the pipeline previously created and click Add processor.
- Select Category Processor for the processor type.
- Enter a name for the processor. For example, “Create online_archives attribute”. This creates an
online_archivesattribute. - In the Populate category section, add two categories:
- In the first category, the value
trueis assigned to all indexes with Online Archives enabled. For example, if logs in the index namedretention-30go into Online Archives:- Enter
@index_name:(retention-30)in the All events that match field. - Enter
truein the Appear under the value name field. - Click Add.
- Enter
- In the second category, the value
falseis assigned to all other indexes.- Enter
*in the All events that match field. - Enter
falsein the Appear under the value name field. - Click Add.
- Enter
- In the first category, the value
- Click Create.
Create a Remapper to convert the online_archives attribute to a tag
- Navigate to the pipeline and click Add processor.
- Select Remapper for the processor type.
- Enter a name for the processor. For example, “Convert online_archives attribute to tag”.
- In the Set attribute(s) or tag key to remap section, select Attribute(s) and enter
online_archives. - In the Set target attribute or tag key section, select Tag key and enter
online_archives. - Disable Preserve source attribute to make sure the attribute is removed and only the tag is kept.
- Enable Override on conflict.
- Click Create.
The order of categories in a Category Processor is important. The attribute is assigned the value of the first category for which the log matches the matching query, with the same logic as the indexes. For this reason, be sure that the matching queries and the order of the index Category Processor are the same as the actual order of the indexes, and that the category `true` is always checked before `false` in the Online Archives Category Processor.
If the index configurations are changed, you need to update the processor configuration to reflect the change.
If the index configurations are changed, you need to update the processor configuration to reflect the change.
Datadog highly recommends automating this process by using the Datadog API endpoints to automatically retrieve and update the configuration.
Create a sds tag
Datadog recommends that you still set up the
sds tag even if you are not using the Sensitive Data Scanner. This makes sure that if you start using Sensitive Data Scanner, all the relevant logs are tagged with sds.The sds tag indicates whether or not your logs have been scanned by the Sensitive Data Scanner. Use the sds tag to estimate the costs associated with the specific usage of Sensitive Data Scanner.
For the Sensitive Data Scanner, billed usage is based on the volume of logs scanned, so it matches a scanning group, not a scanning rule. Therefore, you need to create a proxy scanning rule in each scanning group with a regex to match all logs. This ensures that all scanned logs are tagged.
- Go to the Sensitive Data Scanner.
- In each scanning group:
- Click Add Scanning Rule.
- Enter
.in the Define Regex to match field to match all logs. - Select Entire Event in the Scan the entire event or a portion of it field.
- Enter
sds:truein the Add tags field. - Leave Define action on match on No action.
- Enter a name for the scanning rule. For example, “Create sds tag”.
- Click Create.
Generate custom logs metrics
Datadog provides a set of logs usage metrics so that you can see estimated usage. However, since these metrics cannot be modified, you can generate custom logs metrics for your specific log usage cases instead.
Since usage is measured either in gigabytes (GB) or in millions of events depending on the product, you need to generate two different metrics:
- A metric that counts the number of bytes ingested.
- A metric that counts the number of events ingested.
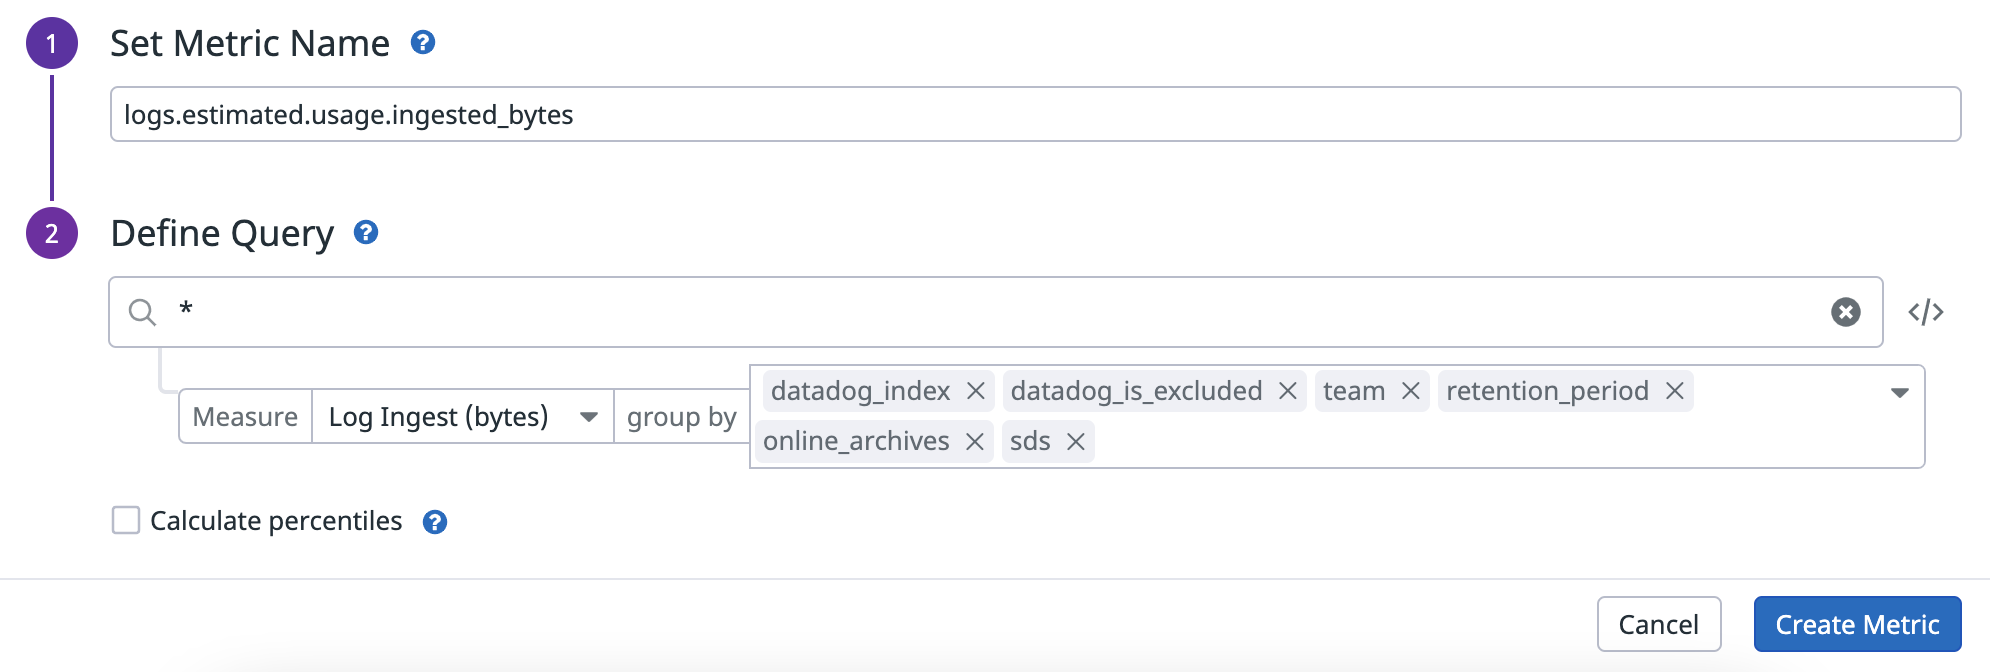
When setting up custom metrics, the tags in the group by field are the dimensions of your metric. Use these fields to filter and aggregate the metrics once they are generated. Make sure to include the following tags in the group by field:
datadog_index, if the log is routed, the tag contains the name of the index to which the log is routed.datadog_is_excludedindicates whether the log is rejected by an exclusion filter in the routed index.- All the custom tags you have configured above (
team,retention_period,online_archives, andsds).
See Generate a log-based metric for instructions on generating the metrics.
It is crucial that you ensure all relevant tags are included in the metric's dimensions because updating a metric's configuration (such as changing the query filters, dimensions, and so on) is not retroactively applied to logs that have already been ingested.
Create a dashboard using the custom logs metrics
There are several ways to use the generated custom log metrics in Datadog. The metrics can be displayed in dashboards, alerted on, used in Notebooks, queried in the Metrics Explorer, and more.
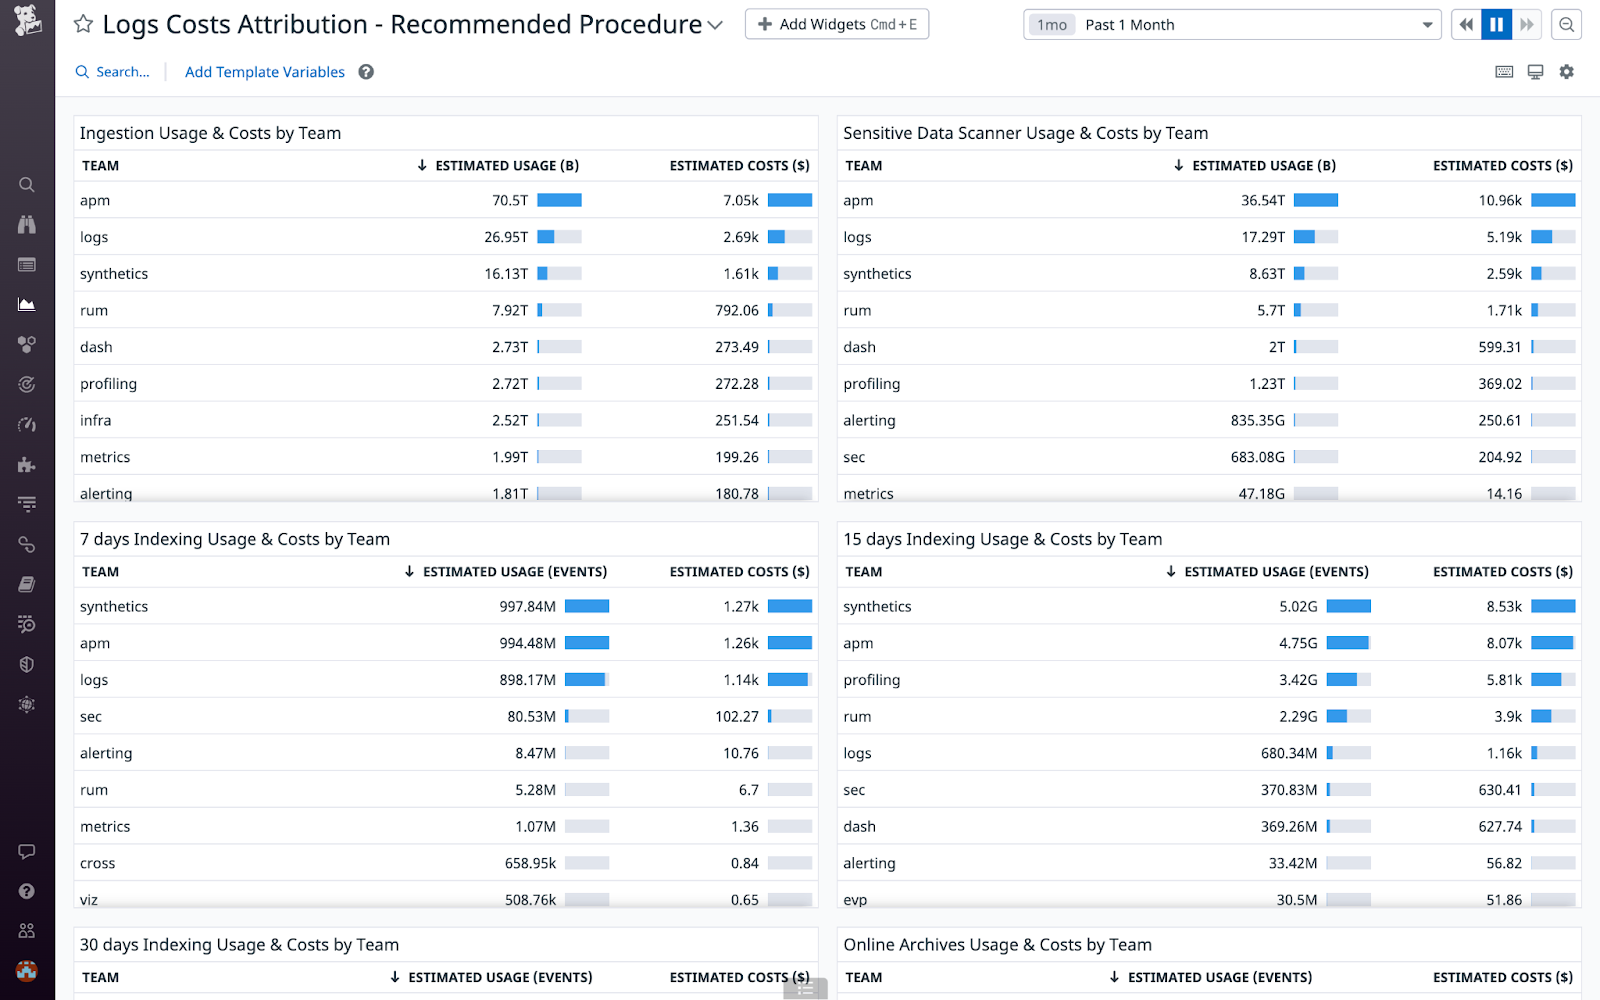
Datadog recommends that you create a dashboard with a table widget for each of the following products to track their usage:
- Log Ingestion
- Sensitive Data Scanner for logs
- Log Indexing by retention periods (3, 7, 15, 30 days, and so on)
- Online Archives
To create a new dashboard:
- Navigate to the Dashboards list.
- Click New Dashboard in the upper right.
- Enter a dashboard name.
- Click New Dashboard.
Create a widget for Log Ingestion usage
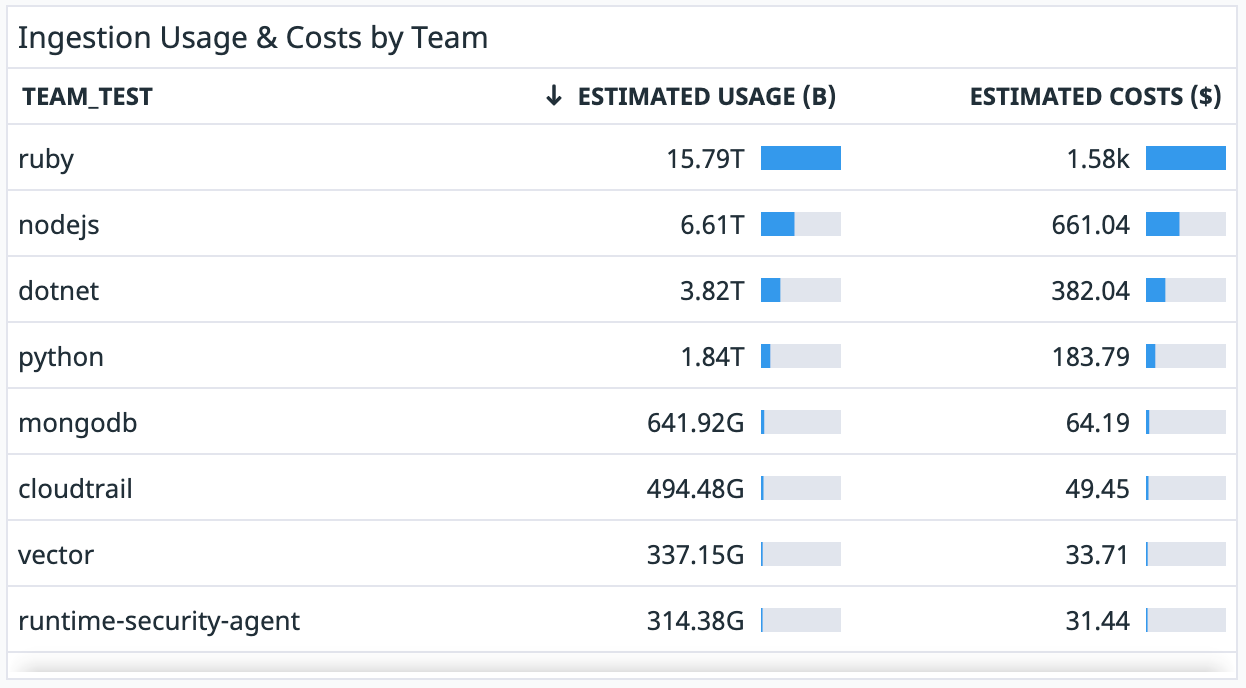
Datadog recommends that you configure the table widget for Log Ingestion in the following way:
- In the dashboard, click Add Widgets.
- Select the Table widget.
- In the Metrics field, select the bytes count metric that you generated earlier to count the number of bytes ingested.
- Select the sum by field and add the
teamtag to show the usage in bytes by team. You can also add other tags for your different cost buckets, for example, thehosttag to see usage by host. - Add the following formula to convert usage into costs:
Usage in gigabytes*Unit cost for Log Ingestion.
Note: If your contractual price per gigabyte changes, you need to update the formula manually. - Click Save.
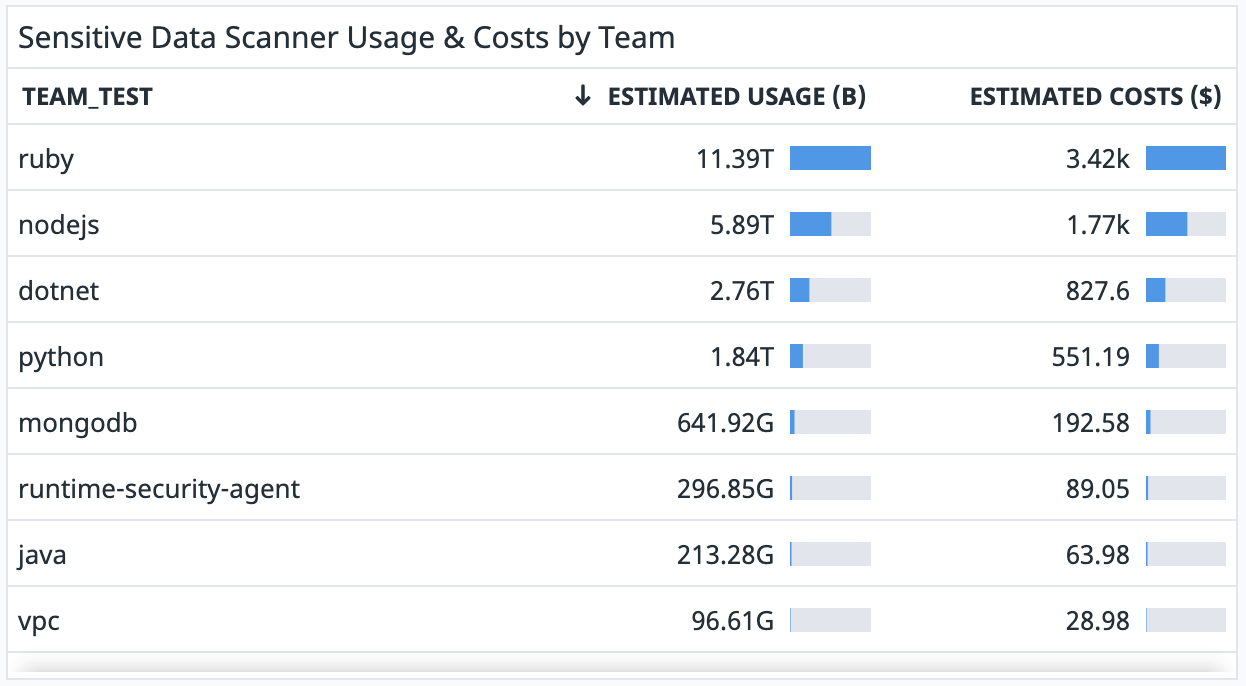
Create a widget for Sensitive Data Scanner
Datadog recommends that you configure the table widget for the Sensitive Data Scanner in the following way:
- In the dashboard, click Add Widgets.
- Select the Table widget.
- In the Metrics field, select the bytes count metric that you generated earlier to count the number of bytes ingested.
- In the from field, enter
sds:trueto filter only for logs that have been scanned by the Sensitive Data Scanner. - Select the sum by field and add the
teamtag to show the usage in bytes by team. You can also add other tags for your different cost buckets. - Add the following formula to convert usage into costs:
Usage in gigabytes*Unit cost for the Sensitive Data Scanner.
Note: If your contractual price per gigabyte changes, you need to update the formula manually. - Click Save.
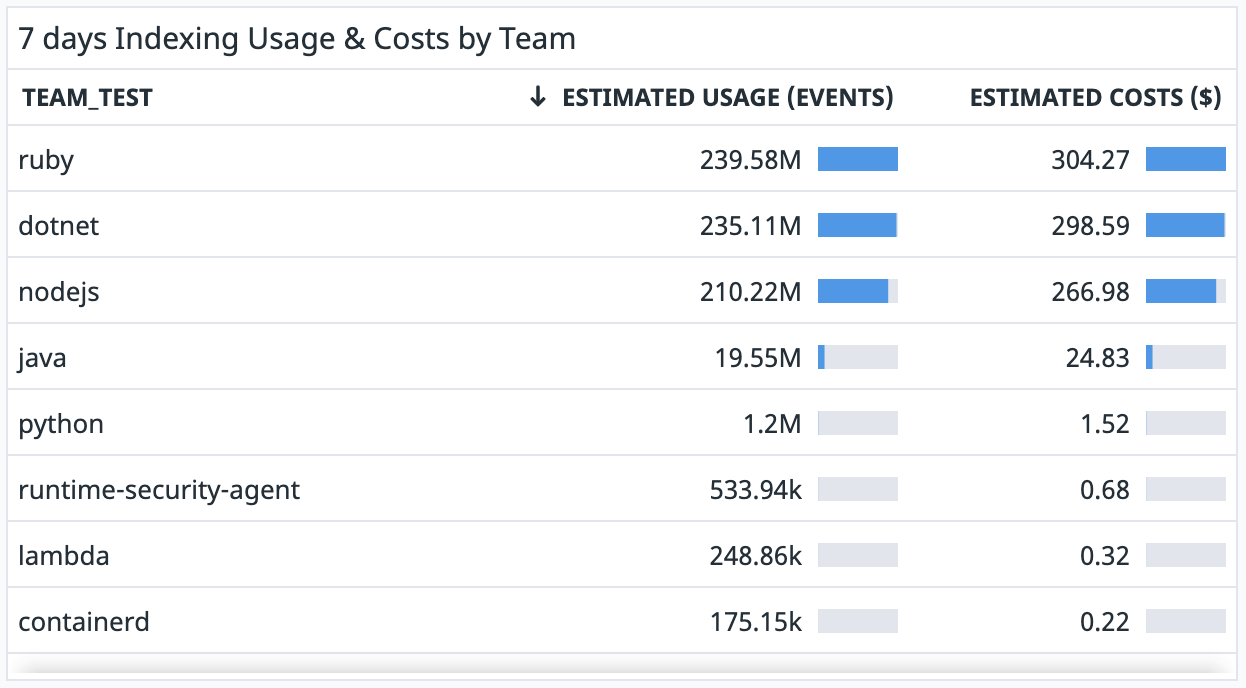
Create a widget for Log Indexing usage
Since indexing is charged based on the number of days the logs are retained, create one widget for each retention period.
Datadog recommends that you configure the table widget for Log Indexing in the following way:
- In the dashboard, click Add Widgets.
- Select the Table widget.
- Select the events count metric that you generated earlier to count the number of events ingested.
- In the from field, add the following:
datadog_index:*to filter to only logs that have been routed to indexes.datadog_is_excluded:falseto filter to only logs that have not matched any exclusion filter.retention_period:7to filter to only logs that are retained for 7 days. You don’t need to add this tag if you have the same retention period for all your indexes and therefore did not set up this tag earlier. If you have additionalretention_periodtags, create a separate widget for each one.
- Select the sum by field, and add the
teamtag to show the usage in events, by team. You can also add other tags for your different cost buckets. - Add the following formula to convert usage into costs:
Usage in millions of events*Unit cost for 7 days of retention. If your contractual price per million of events changes, you need to update the formula manually. - Click Save.
Create widgets for each retention_period tag.
Create a widget for Online Archives usage
When Online Archives is enabled for an index, logs are duplicated and go into both:
- Exclusion filters, logs are indexed only if they pass through exclusion filters.
- Online Archives directly.
Therefore, exclusion filters do not apply to logs that go into the Online Archives.
Based on that information, Datadog recommends that you configure the table widget for Online Archives in the following way:
- In the dashboard, click Add Widgets.
- Select the Table widget.
- In the Metrics field, select the events count metric you generated earlier that counts the number of events ingested.
- In the from field, add the following:
datadog_index:*to filter to only logs that have been routed to indexes.online_archives:trueto filter to only logs that have also been routed to Online Archives.
- Select the sum by field and add the
teamtag to show the usage in events by team. You can also add tags for different cost buckets. - Add the following formula to convert usage into cost:
Usage in millions of events*Unit cost for Online Archives.
Note: If your contractual price per million of events changes, you need to update the formula manually. - Click Save.
Create a widget for total usage and costs
You can aggregate all products into a single widget to get visibility into the total usage and costs. Datadog recommends that you configure the table widget in the following way:
- In the dashboard, click Add Widgets.
- Select the Table widget.
- Add all queries and formulas created in the other widgets to this widget:
- Click Save.
