概要
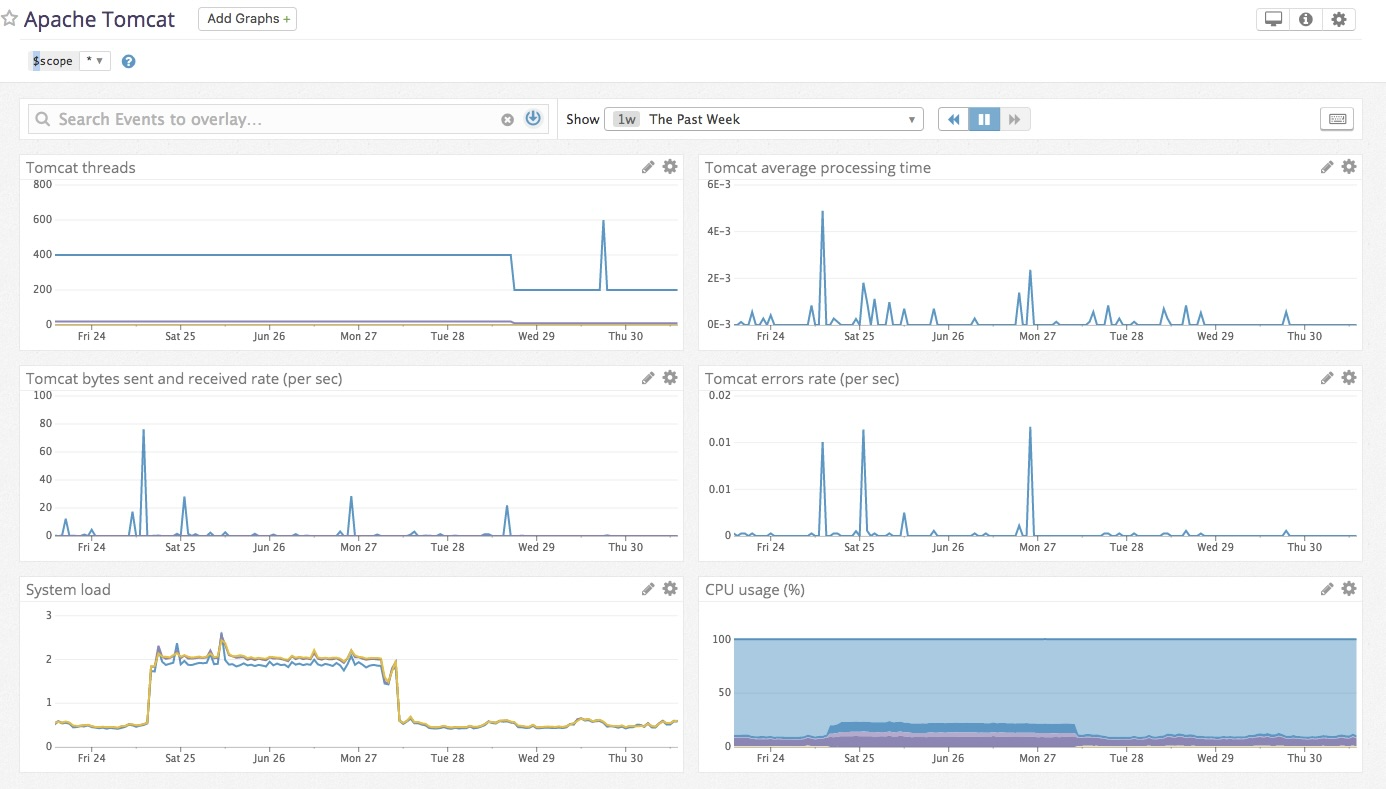
このチェックは、次のような Tomcat メトリクスを収集します。
- 全体的なアクティビティメトリクス: エラー数、リクエスト数、処理時間など
- スレッドプールメトリクス: スレッド数、ビジースレッド数など
- サーブレット処理時間
セットアップ
インストール
Tomcat チェックは Datadog Agent パッケージに含まれています。Tomcat サーバーに追加でインストールする必要はありません。
このチェックは JMX ベースなので、Tomcat サーバーで JMX リモートを有効にする必要があります。この方法については、Tomcat の監視と管理の手順に従ってください。
構成
ホスト
ホストで実行中の Agent に対してこのチェックを構成するには
Tomcat のメトリクスとログを収集するには、Agent のコンフィギュレーションディレクトリのルートにある conf.d/ フォルダーの tomcat.d/conf.yaml ファイルを編集します。使用可能なすべてのコンフィギュレーションオプションについては、tomcat.d/conf.yaml のサンプルを参照してください。
Agent を再起動します。
JMX ベースのすべてのチェックで使用可能なコンフィギュレーションオプションのリストについては、JMX チェックに関するドキュメントを参照してください。
メトリクスのリスト
conf パラメーターは、インテグレーションによって収集されるメトリクスのリストです。次の 2 つのキーのみが許可されます。
include (必須): フィルターの辞書。これらのフィルターに一致する属性は、exclude フィルターにも一致している場合を除き、収集されます (以下を参照)。exclude (任意): フィルターの辞書。これらのフィルターに一致する属性は収集されません。
特定の Bean に対して、メトリクスは次のようにタグ付けされます。
mydomain:attr0=val0,attr1=val1
この例では、メトリクスは mydomain (Bean 内の属性によっては多少異なる) になり、タグ attr0:val0、attr1:val1、domain:mydomain が付きます。
include キー内の指定したエイリアスが_キャメルケース_として書式設定されている場合、_スネークケース_に変換されます。たとえば MyMetricName は、Datadog では my_metric_name と表示されます。
属性フィルター
attribute フィルターは、次の 2 種類の値を受け入れます。
ログ収集
ログを Datadog に送信する際、Tomcat は log4j ロガーを使用します。バージョン 8.0 より前の Tomcat では、log4j がデフォルトで構成されています。バージョン 8.0+ の Tomcat では、Tomcat を構成し log4j を使用する必要があります。Log4 の使用を参照してください。この手順の初めに、以下の要領で $CATALINA_BASE/lib ディレクトリにある log4j.properties ファイルを編集します。
  log4j.rootLogger = INFO, CATALINA

  # Define all the appenders
  log4j.appender.CATALINA = org.apache.log4j.DailyRollingFileAppender
  log4j.appender.CATALINA.File = /var/log/tomcat/catalina.log
  log4j.appender.CATALINA.Append = true

  # Roll-over the log once per day
  log4j.appender.CATALINA.layout = org.apache.log4j.PatternLayout
  log4j.appender.CATALINA.layout.ConversionPattern = %d{yyyy-MM-dd HH:mm:ss} %-5p [%t] %c{1}:%L - %m%n

  log4j.appender.LOCALHOST = org.apache.log4j.DailyRollingFileAppender
  log4j.appender.LOCALHOST.File = /var/log/tomcat/localhost.log
  log4j.appender.LOCALHOST.Append = true
  log4j.appender.LOCALHOST.layout = org.apache.log4j.PatternLayout
  log4j.appender.LOCALHOST.layout.ConversionPattern = %d{yyyy-MM-dd HH:mm:ss} %-5p [%t] %c{1}:%L - %m%n

  log4j.appender.MANAGER = org.apache.log4j.DailyRollingFileAppender
  log4j.appender.MANAGER.File = /var/log/tomcat/manager.log
  log4j.appender.MANAGER.Append = true
  log4j.appender.MANAGER.layout = org.apache.log4j.PatternLayout
  log4j.appender.MANAGER.layout.ConversionPattern = %d{yyyy-MM-dd HH:mm:ss} %-5p [%t] %c{1}:%L - %m%n

  log4j.appender.HOST-MANAGER = org.apache.log4j.DailyRollingFileAppender
  log4j.appender.HOST-MANAGER.File = /var/log/tomcat/host-manager.log
  log4j.appender.HOST-MANAGER.Append = true
  log4j.appender.HOST-MANAGER.layout = org.apache.log4j.PatternLayout
  log4j.appender.HOST-MANAGER.layout.ConversionPattern = %d{yyyy-MM-dd HH:mm:ss} %-5p [%t] %c{1}:%L - %m%n

  log4j.appender.CONSOLE = org.apache.log4j.ConsoleAppender
  log4j.appender.CONSOLE.layout = org.apache.log4j.PatternLayout
  log4j.appender.CONSOLE.layout.ConversionPattern = %d{yyyy-MM-dd HH:mm:ss} %-5p [%t] %c{1}:%L - %m%n

  # Configure which loggers log to which appenders
  log4j.logger.org.apache.catalina.core.ContainerBase.[Catalina].[localhost] = INFO, LOCALHOST
  log4j.logger.org.apache.catalina.core.ContainerBase.[Catalina].[localhost].[/manager] =\
    INFO, MANAGER
  log4j.logger.org.apache.catalina.core.ContainerBase.[Catalina].[localhost].[/host-manager] =\
    INFO, HOST-MANAGER
そして、Tomcat ドキュメント の残りの手順に従い log4j を構成します。
Datadog のインテグレーションパイプラインは、デフォルトで、次の変換パターンをサポートします。
  %d{yyyy-MM-dd HH:mm:ss} %-5p %c{1}:%L - %m%n
  %d [%t] %-5p %c - %m%n
フォーマットが異なる場合は、インテグレーションパイプラインを複製して編集します。Tomcat のログ機能については、Tomcat のログを参照してください。
Datadog Agent で、ログの収集はデフォルトで無効になっています。以下のように、datadog.yaml ファイルでこれを有効にします。
Tomcat のログの収集を開始するには、次の構成ブロックを tomcat.d/conf.yaml ファイルに追加します。
logs:
  - type: file
    path: /var/log/tomcat/*.log
    source: tomcat
    service: "<SERVICE>"
    #To handle multi line that starts with yyyy-mm-dd use the following pattern
    #log_processing_rules:
    #  - type: multi_line
    #    name: log_start_with_date
    #    pattern: \d{4}\-(0?[1-9]|1[012])\-(0?[1-9]|[12][0-9]|3[01])
path パラメーターと service パラメーターの値を変更し、環境に合わせて構成します。使用可能なすべてのコンフィギュレーションオプションについては、サンプル tomcat.yaml を参照してください。
Agent を再起動します。
検証
Agent の status サブコマンドを実行し、Checks セクションで tomcat を探します。
収集データ
メトリクス
| |
|---|
tomcat.bytes_rcvd
(gauge) | Bytes per second received by all request processors.
Shown as byte |
tomcat.bytes_sent
(gauge) | Bytes per second sent by all the request processors.
Shown as byte |
tomcat.error_count
(gauge) | The number of errors per second on all request processors.
Shown as error |
tomcat.jdbc.connection_pool.active
(gauge) | The number of established connections in the pool that are in use. |
tomcat.jdbc.connection_pool.idle
(gauge) | The number of established connections in the pool that are idle. |
tomcat.jdbc.connection_pool.max_active
(gauge) | The maximum number of open connections. |
tomcat.jdbc.connection_pool.max_idle
(gauge) | The maximum number of idle connections. |
tomcat.jdbc.connection_pool.min_idle
(gauge) | The minimum number of idle connections. |
tomcat.jdbc.connection_pool.size
(gauge) | The number of established connections in the pool, idle and in use. |
tomcat.jsp.count
(gauge) | The number of JSPs per second that have been loaded in the web module.
Shown as page |
tomcat.jsp.reload_count
(gauge) | The number of JSPs per second that have been reloaded in the web module.
Shown as page |
tomcat.max_time
(gauge) | The longest request processing time (in milliseconds).
Shown as millisecond |
tomcat.min_time
(gauge) | The shortest request processing time (in milliseconds).
Shown as millisecond |
tomcat.processing_time
(gauge) | The sum of request processing times across all requests handled by the request processors (in milliseconds) per second. |
tomcat.request_count
(gauge) | The number of requests per second across all request processors.
Shown as request |
tomcat.servlet.error_count
(gauge) | The number of erroneous requests received by the servlet per second.
Shown as error |
tomcat.servlet.max_time
(gauge) | The maximum processing time of a request
Shown as millisecond |
tomcat.servlet.min_time
(gauge) | The minimum processing time of a request
Shown as millisecond |
tomcat.servlet.processing_time
(gauge) | The sum of request processing times across all requests to the servlet (in milliseconds) per second. |
tomcat.servlet.request_count
(gauge) | The number of requests received by the servlet per second.
Shown as request |
tomcat.string_cache.access_count
(gauge) | The number of accesses to the string cache per second.
Shown as get |
tomcat.string_cache.cache_size
(gauge) | The size of the String cache
Shown as byte |
tomcat.string_cache.hit_count
(gauge) | The number of string cache hits per second.
Shown as hit |
tomcat.string_cache.max_size
(gauge) | The maximum size of the String cache
Shown as byte |
tomcat.threads.busy
(gauge) | The number of threads that are in use.
Shown as thread |
tomcat.threads.count
(gauge) | The number of threads managed by the thread pool.
Shown as thread |
tomcat.threads.max
(gauge) | The maximum number of allowed worker threads.
Shown as thread |
tomcat.threads.min
(gauge) | The minimum number of allowed worker threads.
Shown as thread |
tomcat.web.cache.hit_count
(gauge) | The number of web resource cache hits per second.
Shown as hit |
tomcat.web.cache.lookup_count
(gauge) | The number of lookups to the web resource cache per second.
Shown as get |
イベント
Tomcat チェックには、イベントは含まれません。
サービスチェック
tomcat.can_connect
Returns CRITICAL if the Agent is unable to connect to and collect metrics from the monitored Tomcat instance, WARNING if no metrics are collected, and OK otherwise.
Statuses: ok, critical, warning
トラブルシューティング
tomcat.* メトリクスの欠落
Datadog Agent は、Datadog Agent のバージョン 7.49.0 以降で、Bean ドメイン名として Catalina または Tomcat を持つ JMX メトリクスを収集します。古いバージョンでは、Catalina を Bean ドメイン名とするメトリクスのみを収集します。
スタンドアロンの Tomcat デプロイでは、Catalina ドメイン配下にメトリクスがありますが、組み込み Tomcat デプロイ (Spring Boot など) では、Tomcat ドメイン配下にメトリクスがあります。
Datadog Agent のバージョンが 7.49.0 より古く、公開されている Tomcat のメトリクスのプレフィックスが Tomcat など異なる Bean ドメイン名の場合は、metrics.yaml ファイルから tomcat.d/conf.yaml ファイルの conf セクションにデフォルトのメトリクスをコピーし、該当する Bean ドメイン名を使用するように domain フィルターを変更します。
- include:
    domain: Tomcat
    type: ThreadPool
    attribute:
      maxThreads:
        alias: tomcat.threads.max
        metric_type: gauge
      currentThreadCount:
        alias: tomcat.threads.count
        metric_type: gauge
      currentThreadsBusy:
        alias: tomcat.threads.busy
        metric_type: gauge
詳細については、JMX Check ドキュメントを参照してください。
使用可能なメトリクスを表示するコマンド
datadog-agent jmx コマンドを使用すると、JMXFetch インテグレーションのトラブルシューティングコマンドを実行できます。Linux システムでは、Datadog Agent が正しいユーザーとして実行されるように、コマンドの前に sudo -u dd-agent を付ける必要があります。
datadog-agent jmx collect
datadog-agent jmx collect を実行すると、現在の構成に基づいてメトリクスの収集が開始され、コンソールに表示されます。
datadog-agent jmx list
datadog-agent jmx list には、利用可能なサブコマンドが多くあります。
collected - 現在のインスタンスの構成で実際に収集される属性を一覧表示します。everything - JMXFetch でサポートされているタイプを持つすべての属性を一覧表示します。limited - インスタンスの構成のいずれかに一致するが、収集可能なメトリクス数を超えるため収集されない属性を一覧表示します。matching - インスタンスの構成の少なくとも 1 つに一致する属性を一覧表示します。not-matching - インスタンスの構成のいずれにも一致しない属性を一覧表示します。with-metrics - インスタンスの構成の少なくとも 1 つに一致する属性とメトリクスデータを一覧表示します。with-rate-metrics - インスタンスの構成の少なくとも 1 つに一致する属性とメトリクスデータを一覧表示します (レートおよびカウンターを含む)。
その他の参考資料
お役に立つドキュメント、リンクや記事: