Supported OS Linux Windows Mac OS

インテグレーションバージョン6.4.0

To find out if this integration is available in your organization, see your Datadog Integrations page or ask your organization administrator.

To initiate an exception request to enable this integration for your organization, email support@ddog-gov.com.

Data Jobs Monitoring は、Spark および Databricks のジョブやクラスターを監視、トラブルシューティング、コスト最適化するのに役立ちます。

このページでは、Spark のメトリクスおよびログの取り込み方法のみを説明します。
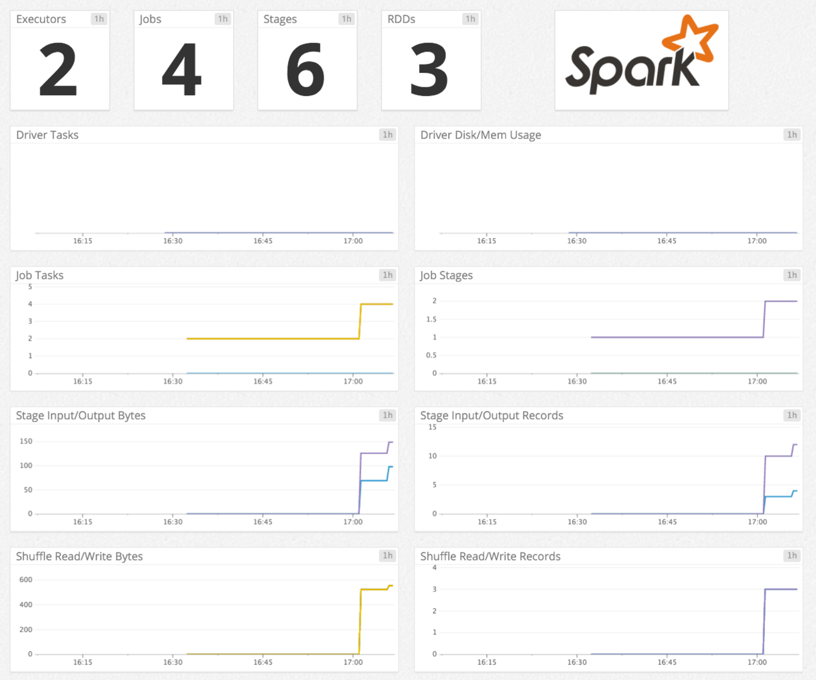
Spark のグラフ

概要

このチェックは、Datadog Agent を通じて Spark を監視します。以下の Spark メトリクスを収集します。

  • ドライバーとエグゼキューター: RDD ブロック、使用メモリ量、使用ディスク容量、処理時間など
  • RDD: パーティション数、使用メモリ量、使用ディスク容量。
  • タスク: アクティブなタスク数、スキップされたタスク数、失敗したタスク数、合計タスク数。
  • ジョブの状態: アクティブなジョブ数、完了したジョブ数、スキップされたジョブ数、失敗したジョブ数。

セットアップ

インストール

Spark チェックは Datadog Agent パッケージに含まれています。Mesos マスター(Mesos の Spark)、YARN ResourceManager(YARN の Spark)、Spark マスター(Spark Standalone)に追加でインストールする必要はありません。

構成

ホスト

ホストで実行中の Agent に対してこのチェックを構成するには

  1. Agent のコンフィギュレーションディレクトリのルートにある conf.d/ フォルダーの spark.d/conf.yaml ファイルを編集します。以下のパラメーターは、更新が必要な場合があります。使用可能なすべてのコンフィギュレーションオプションの詳細については、サンプル spark.d/conf.yaml を参照してください。

    init_config:
    
    instances:
      - spark_url: http://localhost:8080 # Spark master web UI
        #   spark_url: http://<Mesos_master>:5050 # Mesos master web UI
        #   spark_url: http://<YARN_ResourceManager_address>:8088 # YARN ResourceManager address
    
        spark_cluster_mode: spark_yarn_mode # default
        #   spark_cluster_mode: spark_mesos_mode
        #   spark_cluster_mode: spark_yarn_mode
        #   spark_cluster_mode: spark_driver_mode
    
        # required; adds a tag 'cluster_name:<CLUSTER_NAME>' to all metrics
        cluster_name: "<CLUSTER_NAME>"
        # spark_pre_20_mode: true   # if you use Standalone Spark < v2.0
        # spark_proxy_enabled: true # if you have enabled the spark UI proxy
    
  2. Agent を再起動します

コンテナ化

コンテナ環境の場合は、オートディスカバリーのインテグレーションテンプレートのガイドを参照して、次のパラメーターを適用してください。

パラメーター
<INTEGRATION_NAME>spark
<INIT_CONFIG>空白または {}
<INSTANCE_CONFIG>{"spark_url": "%%host%%:8080", "cluster_name":"<CLUSTER_NAME>"}

ログ収集

  1. Datadog Agent で、ログの収集はデフォルトで無効になっています。以下のように、datadog.yaml ファイルでこれを有効にします。

     logs_enabled: true
    
  2. spark.d/conf.yaml ファイルのコメントを解除して、ログコンフィギュレーションブロックを編集します。環境に基づいて、 typepathservice パラメーターの値を変更してください。使用可能なすべての構成オプションの詳細については、サンプル spark.d/conf.yaml を参照してください。

     logs:
       - type: file
         path: <LOG_FILE_PATH>
         source: spark
         service: <SERVICE_NAME>
         # To handle multi line that starts with yyyy-mm-dd use the following pattern
         # log_processing_rules:
         #   - type: multi_line
         #     pattern: \d{4}\-(0?[1-9]|1[012])\-(0?[1-9]|[12][0-9]|3[01])
         #     name: new_log_start_with_date
    
  3. Agent を再起動します

Docker 環境のログを有効にするには、Docker ログ収集を参照してください。

検証

Agent の status サブコマンドを実行し、Checks セクションで spark を探します。

収集データ

メトリクス

spark.driver.active_tasks
(count)
Number of active tasks in the driver
Shown as task
spark.driver.completed_tasks
(count)
Number of completed tasks in the driver
Shown as task
spark.driver.disk_used
(count)
Amount of disk used in the driver
Shown as byte
spark.driver.failed_tasks
(count)
Number of failed tasks in the driver
Shown as task
spark.driver.max_memory
(count)
Maximum memory used in the driver
Shown as byte
spark.driver.mem.total_off_heap_storage
(count)
Total available off heap memory for storage
Shown as byte
spark.driver.mem.total_on_heap_storage
(count)
Total available on heap memory for storage
Shown as byte
spark.driver.mem.used_off_heap_storage
(count)
Used off heap memory currently for storage
Shown as byte
spark.driver.mem.used_on_heap_storage
(count)
Used on heap memory currently for storage
Shown as byte
spark.driver.memory_used
(count)
Amount of memory used in the driver
Shown as byte
spark.driver.peak_mem.direct_pool
(count)
Peak memory that the JVM is using for direct buffer pool
Shown as byte
spark.driver.peak_mem.jvm_heap_memory
(count)
Peak memory usage of the heap that is used for object allocation
Shown as byte
spark.driver.peak_mem.jvm_off_heap_memory
(count)
Peak memory usage of non-heap memory that is used by the Java virtual machine
Shown as byte
spark.driver.peak_mem.major_gc_count
(count)
Total major GC count
Shown as byte
spark.driver.peak_mem.major_gc_time
(count)
Elapsed total major GC time
Shown as millisecond
spark.driver.peak_mem.mapped_pool
(count)
Peak memory that the JVM is using for mapped buffer pool
Shown as byte
spark.driver.peak_mem.minor_gc_count
(count)
Total minor GC count
Shown as byte
spark.driver.peak_mem.minor_gc_time
(count)
Elapsed total minor GC time
Shown as millisecond
spark.driver.peak_mem.off_heap_execution
(count)
Peak off heap execution memory in use
Shown as byte
spark.driver.peak_mem.off_heap_storage
(count)
Peak off heap storage memory in use
Shown as byte
spark.driver.peak_mem.off_heap_unified
(count)
Peak off heap memory (execution and storage)
Shown as byte
spark.driver.peak_mem.on_heap_execution
(count)
Peak on heap execution memory in use
Shown as byte
spark.driver.peak_mem.on_heap_storage
(count)
Peak on heap storage memory in use
Shown as byte
spark.driver.peak_mem.on_heap_unified
(count)
Peak on heap memory (execution and storage)
Shown as byte
spark.driver.peak_mem.process_tree_jvm
(count)
Virtual memory size
Shown as byte
spark.driver.peak_mem.process_tree_jvm_rss
(count)
Resident Set Size: number of pages the process has in real memory
Shown as byte
spark.driver.peak_mem.process_tree_other
(count)
Virtual memory size for other kind of process
Shown as byte
spark.driver.peak_mem.process_tree_other_rss
(count)
Resident Set Size for other kind of process
Shown as byte
spark.driver.peak_mem.process_tree_python
(count)
Virtual memory size for Python
Shown as byte
spark.driver.peak_mem.process_tree_python_rss
(count)
Resident Set Size for Python
Shown as byte
spark.driver.rdd_blocks
(count)
Number of RDD blocks in the driver
Shown as block
spark.driver.total_duration
(count)
Time spent in the driver
Shown as millisecond
spark.driver.total_input_bytes
(count)
Number of input bytes in the driver
Shown as byte
spark.driver.total_shuffle_read
(count)
Number of bytes read during a shuffle in the driver
Shown as byte
spark.driver.total_shuffle_write
(count)
Number of shuffled bytes in the driver
Shown as byte
spark.driver.total_tasks
(count)
Number of total tasks in the driver
Shown as task
spark.executor.active_tasks
(count)
Number of active tasks in the application’s executors
Shown as task
spark.executor.completed_tasks
(count)
Number of completed tasks in the application’s executors
Shown as task
spark.executor.count
(count)
Number of executors
Shown as task
spark.executor.disk_used
(count)
Amount of disk space used by persisted RDDs in the application’s executors
Shown as byte
spark.executor.failed_tasks
(count)
Number of failed tasks in the application’s executors
Shown as task
spark.executor.id.active_tasks
(count)
Number of active tasks in this executor
Shown as task
spark.executor.id.completed_tasks
(count)
Number of completed tasks in this executor
Shown as task
spark.executor.id.disk_used
(count)
Amount of disk space used by persisted RDDs in this executor
Shown as byte
spark.executor.id.failed_tasks
(count)
Number of failed tasks in this executor
Shown as task
spark.executor.id.max_memory
(count)
Total amount of memory available for storage for this executor
Shown as byte
spark.executor.id.mem.total_off_heap_storage
(count)
Total available off heap memory for storage
Shown as byte
spark.executor.id.mem.total_on_heap_storage
(count)
Total available on heap memory for storage
Shown as byte
spark.executor.id.mem.used_off_heap_storage
(count)
Used off heap memory currently for storage
Shown as byte
spark.executor.id.mem.used_on_heap_storage
(count)
Used on heap memory currently for storage
Shown as byte
spark.executor.id.memory_used
(count)
Amount of memory used for cached RDDs in this executor.
Shown as byte
spark.executor.id.peak_mem.direct_pool
(count)
Peak memory that the JVM is using for direct buffer pool
Shown as byte
spark.executor.id.peak_mem.jvm_heap_memory
(count)
Peak memory usage of the heap that is used for object allocation
Shown as byte
spark.executor.id.peak_mem.jvm_off_heap_memory
(count)
Peak memory usage of non-heap memory that is used by the Java virtual machine
Shown as byte
spark.executor.id.peak_mem.major_gc_count
(count)
Total major GC count
Shown as byte
spark.executor.id.peak_mem.major_gc_time
(count)
Elapsed total major GC time
Shown as millisecond
spark.executor.id.peak_mem.mapped_pool
(count)
Peak memory that the JVM is using for mapped buffer pool
Shown as byte
spark.executor.id.peak_mem.minor_gc_count
(count)
Total minor GC count
Shown as byte
spark.executor.id.peak_mem.minor_gc_time
(count)
Elapsed total minor GC time
Shown as millisecond
spark.executor.id.peak_mem.off_heap_execution
(count)
Peak off heap execution memory in use
Shown as byte
spark.executor.id.peak_mem.off_heap_storage
(count)
Peak off heap storage memory in use
Shown as byte
spark.executor.id.peak_mem.off_heap_unified
(count)
Peak off heap memory (execution and storage)
Shown as byte
spark.executor.id.peak_mem.on_heap_execution
(count)
Peak on heap execution memory in use
Shown as byte
spark.executor.id.peak_mem.on_heap_storage
(count)
Peak on heap storage memory in use
Shown as byte
spark.executor.id.peak_mem.on_heap_unified
(count)
Peak on heap memory (execution and storage)
Shown as byte
spark.executor.id.peak_mem.process_tree_jvm
(count)
Virtual memory size
Shown as byte
spark.executor.id.peak_mem.process_tree_jvm_rss
(count)
Resident Set Size: number of pages the process has in real memory
Shown as byte
spark.executor.id.peak_mem.process_tree_other
(count)
Virtual memory size for other kind of process
Shown as byte
spark.executor.id.peak_mem.process_tree_other_rss
(count)
Resident Set Size for other kind of process
Shown as byte
spark.executor.id.peak_mem.process_tree_python
(count)
Virtual memory size for Python
Shown as byte
spark.executor.id.peak_mem.process_tree_python_rss
(count)
Resident Set Size for Python
Shown as byte
spark.executor.id.rdd_blocks
(count)
Number of persisted RDD blocks in this executor
Shown as block
spark.executor.id.total_duration
(count)
Time spent by the executor executing tasks
Shown as millisecond
spark.executor.id.total_input_bytes
(count)
Total number of input bytes in the executor
Shown as byte
spark.executor.id.total_shuffle_read
(count)
Total number of bytes read during a shuffle in the executor
Shown as byte
spark.executor.id.total_shuffle_write
(count)
Total number of shuffled bytes in the executor
Shown as byte
spark.executor.id.total_tasks
(count)
Total number of tasks in this executor
Shown as task
spark.executor.max_memory
(count)
Max memory across all executors working for a particular application
Shown as byte
spark.executor.mem.total_off_heap_storage
(count)
Total available off heap memory for storage
Shown as byte
spark.executor.mem.total_on_heap_storage
(count)
Total available on heap memory for storage
Shown as byte
spark.executor.mem.used_off_heap_storage
(count)
Used off heap memory currently for storage
Shown as byte
spark.executor.mem.used_on_heap_storage
(count)
Used on heap memory currently for storage
Shown as byte
spark.executor.memory_used
(count)
Amount of memory used for cached RDDs in the application’s executors
Shown as byte
spark.executor.peak_mem.direct_pool
(count)
Peak memory that the JVM is using for direct buffer pool
Shown as byte
spark.executor.peak_mem.jvm_heap_memory
(count)
Peak memory usage of the heap that is used for object allocation
Shown as byte
spark.executor.peak_mem.jvm_off_heap_memory
(count)
Peak memory usage of non-heap memory that is used by the Java virtual machine
Shown as byte
spark.executor.peak_mem.major_gc_count
(count)
Total major GC count
Shown as byte
spark.executor.peak_mem.major_gc_time
(count)
Elapsed total major GC time
Shown as millisecond
spark.executor.peak_mem.mapped_pool
(count)
Peak memory that the JVM is using for mapped buffer pool
Shown as byte
spark.executor.peak_mem.minor_gc_count
(count)
Total minor GC count
Shown as byte
spark.executor.peak_mem.minor_gc_time
(count)
Elapsed total minor GC time
Shown as millisecond
spark.executor.peak_mem.off_heap_execution
(count)
Peak off heap execution memory in use
Shown as byte
spark.executor.peak_mem.off_heap_storage
(count)
Peak off heap storage memory in use
Shown as byte
spark.executor.peak_mem.off_heap_unified
(count)
Peak off heap memory (execution and storage)
Shown as byte
spark.executor.peak_mem.on_heap_execution
(count)
Peak on heap execution memory in use
Shown as byte
spark.executor.peak_mem.on_heap_storage
(count)
Peak on heap storage memory in use
Shown as byte
spark.executor.peak_mem.on_heap_unified
(count)
Peak on heap memory (execution and storage)
Shown as byte
spark.executor.peak_mem.process_tree_jvm
(count)
Virtual memory size
Shown as byte
spark.executor.peak_mem.process_tree_jvm_rss
(count)
Resident Set Size: number of pages the process has in real memory
Shown as byte
spark.executor.peak_mem.process_tree_other
(count)
Virtual memory size for other kind of process
Shown as byte
spark.executor.peak_mem.process_tree_other_rss
(count)
Resident Set Size for other kind of process
Shown as byte
spark.executor.peak_mem.process_tree_python
(count)
Virtual memory size for Python
Shown as byte
spark.executor.peak_mem.process_tree_python_rss
(count)
Resident Set Size for Python
Shown as byte
spark.executor.rdd_blocks
(count)
Number of persisted RDD blocks in the application’s executors
Shown as block
spark.executor.total_duration
(count)
Time spent by the application’s executors executing tasks
Shown as millisecond
spark.executor.total_input_bytes
(count)
Total number of input bytes in the application’s executors
Shown as byte
spark.executor.total_shuffle_read
(count)
Total number of bytes read during a shuffle in the application’s executors
Shown as byte
spark.executor.total_shuffle_write
(count)
Total number of shuffled bytes in the application’s executors
Shown as byte
spark.executor.total_tasks
(count)
Total number of tasks in the application’s executors
Shown as task
spark.executor_memory
(count)
Maximum memory available for caching RDD blocks in the application’s executors
Shown as byte
spark.job.count
(count)
Number of jobs
Shown as task
spark.job.num_active_stages
(count)
Number of active stages in the application
Shown as stage
spark.job.num_active_tasks
(count)
Number of active tasks in the application
Shown as task
spark.job.num_completed_stages
(count)
Number of completed stages in the application
Shown as stage
spark.job.num_completed_tasks
(count)
Number of completed tasks in the application
Shown as task
spark.job.num_failed_stages
(count)
Number of failed stages in the application
Shown as stage
spark.job.num_failed_tasks
(count)
Number of failed tasks in the application
Shown as task
spark.job.num_skipped_stages
(count)
Number of skipped stages in the application
Shown as stage
spark.job.num_skipped_tasks
(count)
Number of skipped tasks in the application
Shown as task
spark.job.num_tasks
(count)
Number of tasks in the application
Shown as task
spark.rdd.count
(count)
Number of RDDs
spark.rdd.disk_used
(count)
Amount of disk space used by persisted RDDs in the application
Shown as byte
spark.rdd.memory_used
(count)
Amount of memory used in the application’s persisted RDDs
Shown as byte
spark.rdd.num_cached_partitions
(count)
Number of in-memory cached RDD partitions in the application
spark.rdd.num_partitions
(count)
Number of persisted RDD partitions in the application
spark.stage.count
(count)
Number of stages
Shown as task
spark.stage.disk_bytes_spilled
(count)
Max size on disk of the spilled bytes in the application’s stages
Shown as byte
spark.stage.executor_run_time
(count)
Time spent by the executor in the application’s stages
Shown as millisecond
spark.stage.input_bytes
(count)
Input bytes in the application’s stages
Shown as byte
spark.stage.input_records
(count)
Input records in the application’s stages
Shown as record
spark.stage.memory_bytes_spilled
(count)
Number of bytes spilled to disk in the application’s stages
Shown as byte
spark.stage.num_active_tasks
(count)
Number of active tasks in the application’s stages
Shown as task
spark.stage.num_complete_tasks
(count)
Number of complete tasks in the application’s stages
Shown as task
spark.stage.num_failed_tasks
(count)
Number of failed tasks in the application’s stages
Shown as task
spark.stage.output_bytes
(count)
Output bytes in the application’s stages
Shown as byte
spark.stage.output_records
(count)
Output records in the application’s stages
Shown as record
spark.stage.shuffle_read_bytes
(count)
Number of bytes read during a shuffle in the application’s stages
Shown as byte
spark.stage.shuffle_read_records
(count)
Number of records read during a shuffle in the application’s stages
Shown as record
spark.stage.shuffle_write_bytes
(count)
Number of shuffled bytes in the application’s stages
Shown as byte
spark.stage.shuffle_write_records
(count)
Number of shuffled records in the application’s stages
Shown as record
spark.streaming.statistics.avg_input_rate
(gauge)
Average streaming input data rate
Shown as byte
spark.streaming.statistics.avg_processing_time
(gauge)
Average application’s streaming batch processing time
Shown as millisecond
spark.streaming.statistics.avg_scheduling_delay
(gauge)
Average application’s streaming batch scheduling delay
Shown as millisecond
spark.streaming.statistics.avg_total_delay
(gauge)
Average application’s streaming batch total delay
Shown as millisecond
spark.streaming.statistics.batch_duration
(gauge)
Application’s streaming batch duration
Shown as millisecond
spark.streaming.statistics.num_active_batches
(gauge)
Number of active streaming batches
Shown as job
spark.streaming.statistics.num_active_receivers
(gauge)
Number of active streaming receivers
Shown as object
spark.streaming.statistics.num_inactive_receivers
(gauge)
Number of inactive streaming receivers
Shown as object
spark.streaming.statistics.num_processed_records
(count)
Number of processed streaming records
Shown as record
spark.streaming.statistics.num_received_records
(count)
Number of received streaming records
Shown as record
spark.streaming.statistics.num_receivers
(gauge)
Number of streaming application’s receivers
Shown as object
spark.streaming.statistics.num_retained_completed_batches
(count)
Number of retained completed application’s streaming batches
Shown as job
spark.streaming.statistics.num_total_completed_batches
(count)
Total number of completed application’s streaming batches
Shown as job
spark.structured_streaming.input_rate
(gauge)
Average streaming input data rate
Shown as record
spark.structured_streaming.latency
(gauge)
Average latency for the structured streaming application.
Shown as millisecond
spark.structured_streaming.processing_rate
(gauge)
Number of received streaming records per second
Shown as row
spark.structured_streaming.rows_count
(gauge)
Count of rows.
Shown as row
spark.structured_streaming.used_bytes
(gauge)
Number of bytes used in memory.
Shown as byte

イベント

Spark チェックには、イベントは含まれません。

サービスチェック

spark.resource_manager.can_connect

Returns CRITICAL if the Agent is unable to connect to the Spark instance’s ResourceManager. Returns OK otherwise.

Statuses: ok, critical

spark.application_master.can_connect

Returns CRITICAL if the Agent is unable to connect to the Spark instance’s ApplicationMaster. Returns OK otherwise.

Statuses: ok, critical

spark.standalone_master.can_connect

Returns CRITICAL if the Agent is unable to connect to the Spark instance’s Standalone Master. Returns OK otherwise.

Statuses: ok, critical

spark.mesos_master.can_connect

Returns CRITICAL if the Agent is unable to connect to the Spark instance’s Mesos Master. Returns OK otherwise.

Statuses: ok, critical

トラブルシューティング

Amazon EMR 上の Spark

Amazon EMR 上の Spark のメトリクスを受信するには、ブートストラップアクションを使用して Datadog Agent をインストールします。

Agent v5 の場合は、各 EMR ノードに正しい値が指定された /etc/dd-agent/conf.d/spark.yaml 構成ファイルを作成します。

Agent v6/7 の場合は、各 EMR ノードに正しい値が指定された /etc/datadog-agent/conf.d/spark.d/conf.yaml 構成ファイルを作成します。

チェックは成功したが、メトリクスは収集されない

Spark インテグレーションは、実行中のアプリに関するメトリクスのみを収集します。現在実行中のアプリがない場合、チェックはヘルスチェックを送信するだけです。

その他の参考資料

お役に立つドキュメント、リンクや記事: