概要
PlanetScale は、Datadog にメトリクスをプッシュして、データベースの使用量とパフォーマンスの把握を支援することができます。
セットアップ
以下の手順に従って、Datadog にメトリクスをプッシュするために PlanetScale の組織を構成してください。
- Datadog 組織設定で、Datadog API キーを作成します。
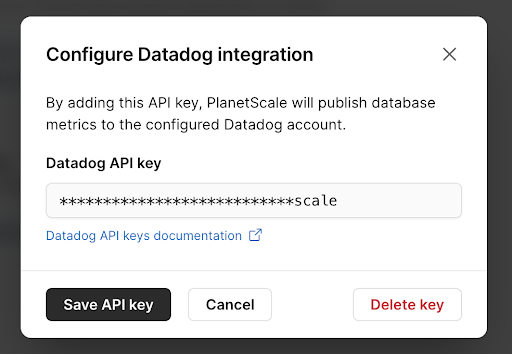
- PlanetScale 組織設定で Datadog の API キーを PlanetScale に渡します。
収集データ
メトリクス
| |
|---|
planetscale.connections
(gauge) | Number of active connections to a database branch
Shown as connection |
planetscale.rows_read
(count) | Number of rows read from a database branch
Shown as row |
planetscale.rows_written
(count) | Number of rows written to a database branch
Shown as row |
planetscale.tables.cumulative_query_time
(count) | Cumulative active query time in a database branch by table and statement
Shown as nanosecond |
planetscale.tables.queries
(count) | Number of queries issued to a database branch by table and statement
Shown as query |
planetscale.tables.rows_deleted
(count) | Number of rows deleted from a database branch by table
Shown as row |
planetscale.tables.rows_inserted
(count) | Number of rows inserted into a database branch by table
Shown as row |
planetscale.tables.rows_selected
(count) | Number of rows selected in a database branch by table
Shown as row |
planetscale.tables.rows_updated
(count) | Number of rows updated in a database branch by table
Shown as row |
planetscale.tables.storage
(gauge) | Total bytes stored in a database branch by table
Shown as byte |
サービスチェック
Planetscale には、サービスのチェック機能は含まれません。
イベント
Planetscale には、イベントは含まれません。
サポート
ご不明な点は、Datadog のサポートチームまでお問い合わせください。