Supported OS
![Linux]()
概要
このチェックは、Open Policy Agent からメトリクスを収集します。
セットアップ
Kubernetes クラスターで実行されている Agent 用にこのチェックをインストールおよび構成する場合は、以下の手順に従ってください。オートディスカバリーのインテグレーションテンプレートのガイドも参照してこの手順を行ってください。
インストール
open_policy_agent チェックを Kubernetes クラスターにインストールするには:
開発ツールキットをインストールします。
integrations-extras リポジトリを複製します。
git clone https://github.com/DataDog/integrations-extras.git.
ddev 構成を integrations-extras/ パスで更新します。
ddev config set repos.extras ./integrations-extras
open_policy_agent パッケージをビルドするには、以下を実行します:
ddev -e release build open_policy_agent
Agent マニフェストをダウンロードして、Datadog Agent を DaemonSet としてインストールします。
チェックコード用と構成用の 2 つの PersistentVolumeClaim を作成します。
それらをボリュームとして Agent ポッドテンプレートに追加し、チェックと構成に使用します。
     env:
       - name: DD_CONFD_PATH
         value: "/confd"
       - name: DD_ADDITIONAL_CHECKSD
         value: "/checksd"
   [...]
     volumeMounts:
       - name: agent-code-storage
         mountPath: /checksd
       - name: agent-conf-storage
         mountPath: /confd
   [...]
   volumes:
     - name: agent-code-storage
       persistentVolumeClaim:
         claimName: agent-code-claim
     - name: agent-conf-storage
       persistentVolumeClaim:
         claimName: agent-conf-claim
Kubernetes クラスターに Datadog Agent をデプロイします。
kubectl apply -f agent.yaml
インテグレーションアーティファクトの .whl ファイルを Kubernetes ノードにコピーするか、パブリック URL にアップロードします。
次のコマンドを実行して、Agent でインテグレーション Wheel をインストールします。
kubectl exec ds/datadog -- agent integration install -w <PATH_OF_OPEN_POLICY_AGENT_ARTIFACT_>/<OPEN_POLICY_AGENT_ARTIFACT_NAME>.whl
以下のコマンドを実行して、チェックと構成を対応する PVC にコピーします。
kubectl exec ds/datadog -- sh
# cp -R /opt/datadog-agent/embedded/lib/python2.7/site-packages/datadog_checks/* /checksd
# cp -R /etc/datadog-agent/conf.d/* /confd
Datadog Agent ポッドを再起動します。
ログ生成メトリクス
デフォルトのダッシュボードには、OPA の決定メトリクス open_policy_agent.decisions に関連するグラフがいくつか表示されます。このメトリクスは OPA の “Decision Log” に基づいて作成されます。このメトリクスを生成してダッシュボードの該当する部分に入力するには、Datadog でログ生成メトリクスを新規作成します。
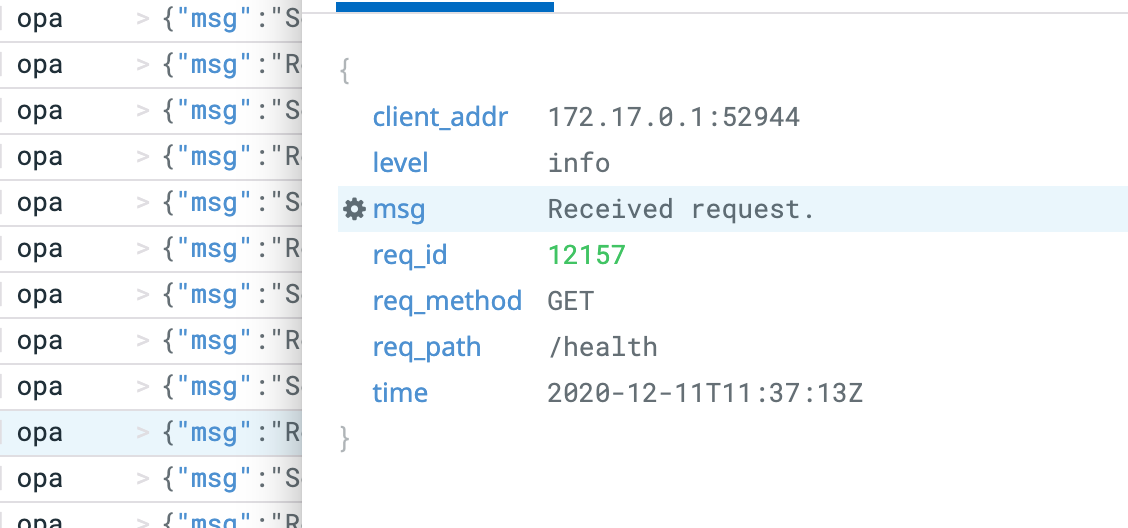
ログエントリの “Decision Log” タイプに対応するメトリクスのみを生成するために、まず OPA ログの msg フィールドに対応するファセットを作成します。OPA を起点とするログエントリのいずれかを選択し、msg フィールド付近にあるエンジンログをクリックして “Create facet for @msg” を選択します。
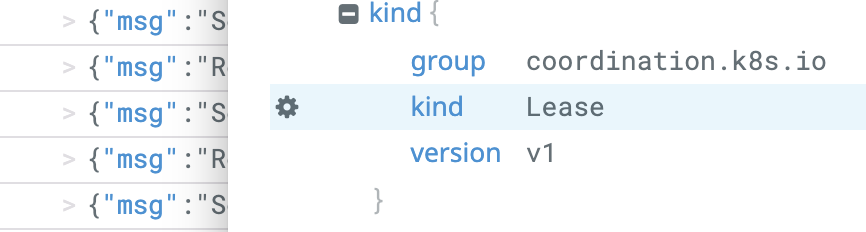
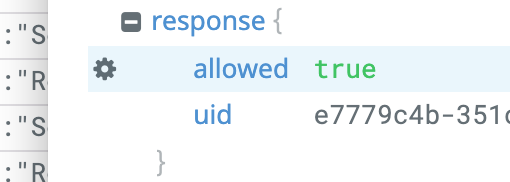
input.request.kind.kind フィールドと result.response.allowed フィールド用に合計 2 つのファセットを作成します。どちらのフィールドも “Decision Log” タイプのすべてのログエントリで利用可能です。
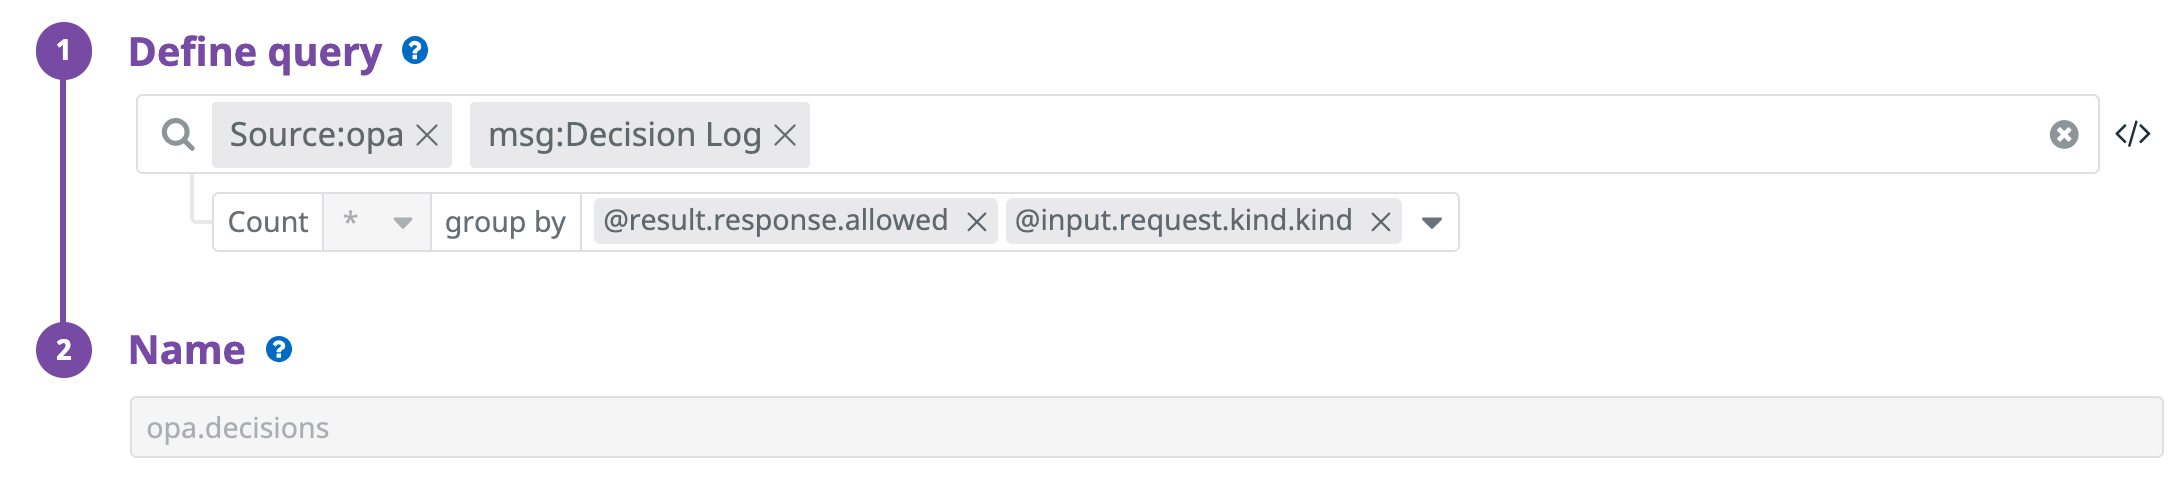
ファセットを作成したら、ダッシュボードを完成させるために必要なメトリクスを生成します。メニューで “Logs -> Generate Metrics” をクリックし、“Add a new metric” をクリックして以下のデータをフォームに入力してください。
構成
OPA パフォーマンスデータの収集を開始するには、Agent ポッドに追加した /confd フォルダーの open_policy_agent/conf.yaml ファイルを編集します。使用可能なすべてのコンフィギュレーションオプションの詳細については、サンプル open_policy_agent/conf.yaml を参照してください。
Agent を再起動します。
検証
Agent の status サブコマンドを実行し、Checks セクションで open_policy_agent を探します。
収集データ
メトリクス
| |
|---|
open_policy_agent.request.duration.count
(count) | The count of the HTTP request latencies in seconds for the OPA service
Shown as second |
open_policy_agent.request.duration.sum
(count) | The sum of the HTTP request latencies in seconds for the OPA service
Shown as second |
open_policy_agent.policies
(gauge) | The number of policies enabled in the OPA server |
イベント
open_policy_agent には、イベントは含まれません。
サービスチェック
open_policy_agent.prometheus.health
Returns CRITICAL if the agent fails to connect to the Prometheus endpoint, otherwise OK.
Statuses: ok, critical
open_policy_agent.health
Returns CRITICAL if the agent fails to connect to the OPA health endpoint, OK if it returns 200, WARNING otherwise.
Statuses: ok, warning, critical
open_policy_agent.bundles_health
Returns CRITICAL if the agent fails to connect to the OPA bundles health endpoint, OK if it returns 200, WARNING otherwise.
Statuses: ok, warning, critical
open_policy_agent.plugins_health
Returns CRITICAL if the agent fails to connect to the OPA plugins health point, OK if it returns 200, WARNING otherwise.
Statuses: ok, warning, critical
トラブルシューティング
ご不明な点は、Datadog のサポートチームまでお問合せください。