Supported OS Linux Mac OS Windows

インテグレーションバージョン6.4.0

MongoDB ダッシュボード

概要

MongoDB を Datadog に接続して、以下のことができます。

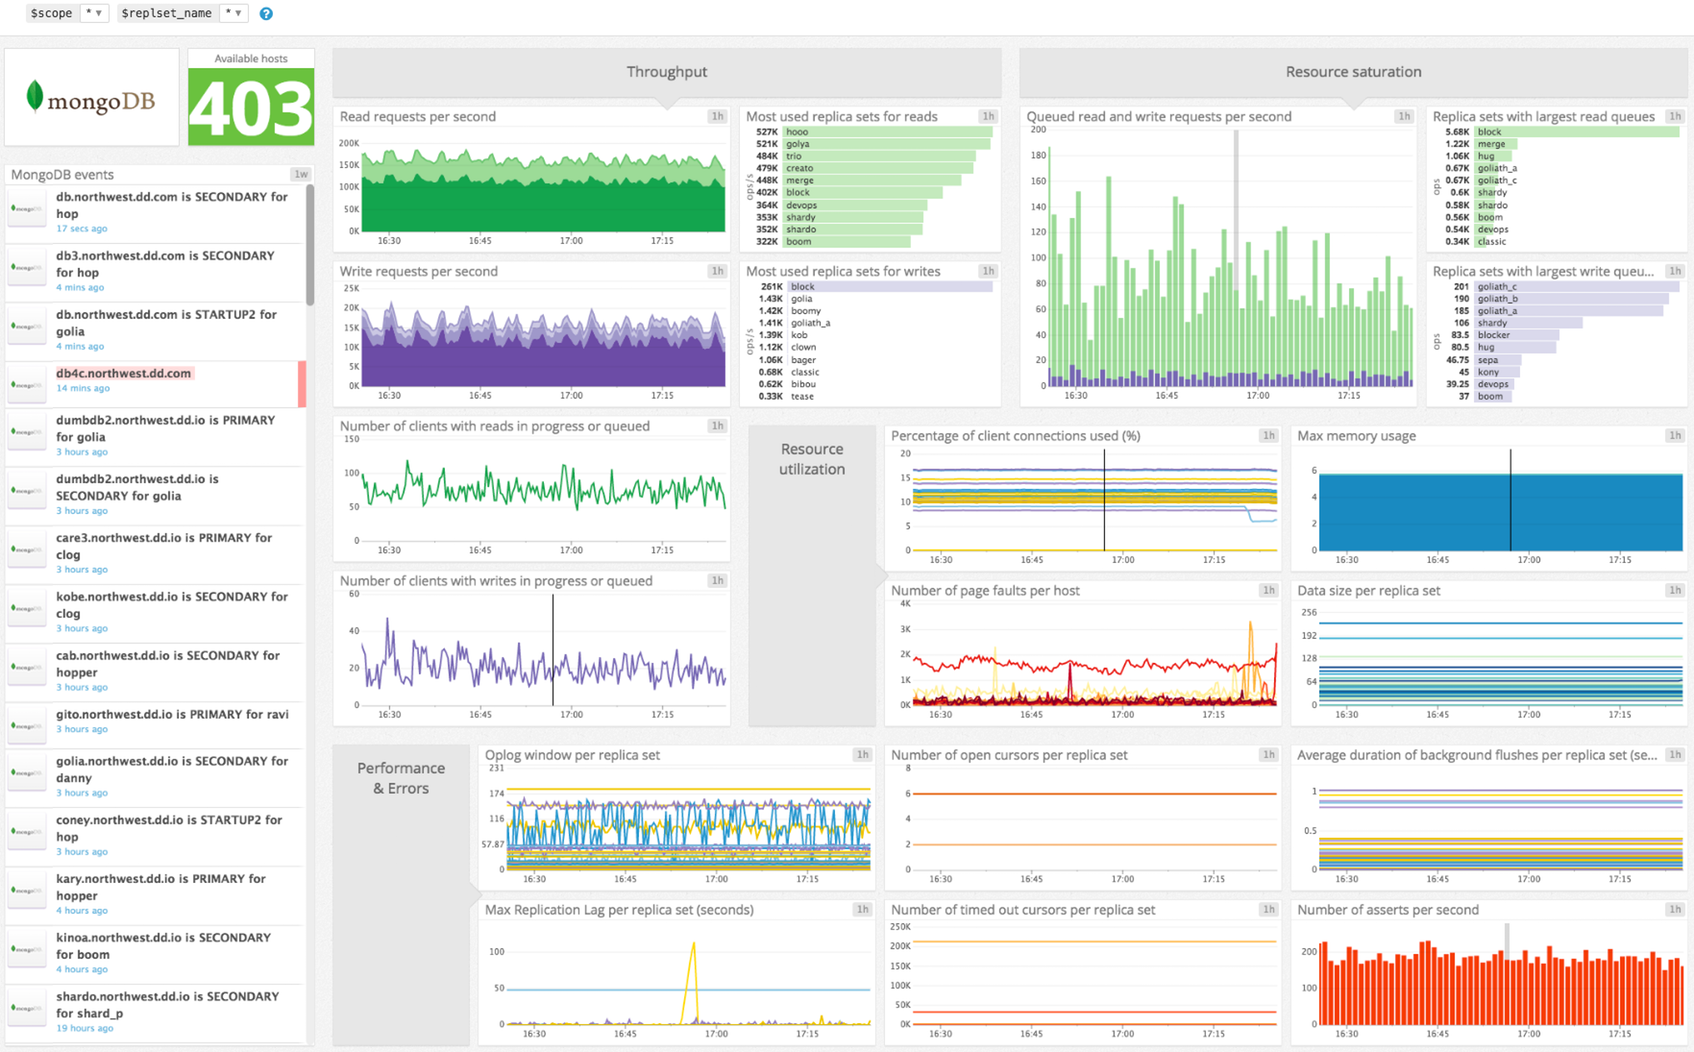
  • MongoDB のキーメトリクスを視覚化できます。
  • MongoDB のパフォーマンスをアプリケーションの他の部分と関連付けることができます。

また、カスタム find/count/aggregate クエリを使用して、独自のメトリクスを作成することもできます。

: このインテグレーションには MongoDB v3.0 以降が必要です。MongoDB Atlas と Datadog のインテグレーションは、M10 以降のクラスターでのみ使用できます。

計画と使用

インフラストラクチャーリスト

MongoDB チェックは Datadog Agent パッケージに含まれています。追加でインストールする必要はありません。

Synthetic モニタリング

ほとんどの低レベルのメトリクス (アップタイム、ストレージサイズなど) は、すべての mongod ノードで収集する必要があります。その他の高レベルのメトリクス (収集/インデックス統計など) は、一度だけ収集する必要があります。これらの理由により、Agent を構成する方法は、mongo クラスターのデプロイ方法によって異なります。

スタンドアロン

このインテグレーションを単一ノードの MongoDB デプロイ用に構成するには

MongoDB の準備

Mongo シェルで、admin データベースに Datadog Agent 用の読み取り専用ユーザーを作成します。

# 管理者ユーザーとして認証します。
use admin
db.auth("admin", "<YOUR_MONGODB_ADMIN_PASSWORD>")

# Datadog Agent のユーザーを作成します。
db.createUser({
  "user": "datadog",
  "pwd": "<UNIQUEPASSWORD>",
  "roles": [
    { role: "read", db: "admin" },
    { role: "clusterMonitor", db: "admin" },
    { role: "read", db: "local" }
  ]
})
Agent の構成

使用可能なすべての mongo メトリクスを収集するには、できれば同じノードで実行している単一の Agent だけが必要です。コンフィギュレーションオプションについては、以下を参照してください。

レプリカセット

このインテグレーションを MongoDB レプリカセット用に構成するには

MongoDB の準備

Mongo シェルで、プライマリに対して認証し、admin データベースに Datadog Agent 用の読み取り専用ユーザーを作成します。

# 管理者ユーザーとして認証します。
use admin
db.auth("admin", "<YOUR_MONGODB_ADMIN_PASSWORD>")

# Datadog Agent のユーザーを作成します。
db.createUser({
  "user": "datadog",
  "pwd": "<UNIQUEPASSWORD>",
  "roles": [
    { role: "read", db: "admin" },
    { role: "clusterMonitor", db: "admin" },
    { role: "read", db: "local" }
  ]
})
Agent の構成

MongoDB レプリカセットの各ホストに Datadog Agent をインストールし、そのホスト (localhost) 上のレプリカに接続するように Agent を構成します。各ホストで Agent を実行することで、レイテンシーと実行時間が短縮され、ホストに障害が発生した場合でもデータが接続されるようになります。

例えば、プライマリノードで、

init_config:
instances:
  - hosts:
      - mongo-primary:27017

セカンダリノードで、

init_config:
instances:
  - hosts:
      - mongo-secondary:27017

ターシャリノードで、

init_config:
instances:
  - hosts:
      - mongo-tertiary:27017

シャード

このインテグレーションを MongoDB シャードクラスター用に構成するには

MongoDB の準備

クラスタ内のシャードごとに、レプリカセットのプライマリに接続し、admin データベースに Datadog Agent 用のローカル読み取り専用ユーザーを作成します。

# 管理者ユーザーとして認証します。
use admin
db.auth("admin", "<YOUR_MONGODB_ADMIN_PASSWORD>")

# Datadog Agent のユーザーを作成します。
db.createUser({
  "user": "datadog",
  "pwd": "<UNIQUEPASSWORD>",
  "roles": [
    { role: "read", db: "admin" },
    { role: "clusterMonitor", db: "admin" },
    { role: "read", db: "local" }
  ]
})

次に、mongos プロキシから同じユーザーを作成します。このアクションにより、コンフィギュレーションサーバーにローカルユーザーが作成され、直接接続が可能になります。

Agent の構成
  1. 各シャードのメンバーごとに 1 つの Agent を構成します。
  2. コンフィギュレーションサーバーのメンバーごとに 1 つの Agent を構成します。
  3. mongos プロキシを介してクラスターに接続するように 1 つの追加 Agent を構成します。この mongos プロキシは、監視目的専用の新しい mongos プロキシでも、既存の mongos プロキシでもかまいません。

: アービターノードの監視はサポートされていません (詳細については、MongoDB Replica Set Arbiter を参照してください)。ただし、アービターノードのステータス変更は、プライマリに接続されている Agent によって報告されます。

ブラウザトラブルシューティング

ホストで実行されている Agent 用にこのチェックを構成する場合は、以下の手順に従ってください。コンテナ環境の場合は、DockerKubernetes、または ECS セクションを参照してください。

メトリクスベース SLO

ホストで実行中の Agent に対してこのチェックを構成するには

メトリクスの収集
  1. Agent のコンフィギュレーションディレクトリのルートにある conf.d フォルダーの mongo.d/conf.yaml ファイルを編集します。使用可能なすべてのコンフィギュレーションオプションについては、サンプル mongo.d/conf.yaml を参照してください。

    init_config:
    
    instances:
        ## @param hosts - list of strings - required
        ## Hosts to collect metrics from, as is appropriate for your deployment topology.
        ## E.g. for a standalone deployment, specify the hostname and port of the mongod instance.
        ## For replica sets or sharded clusters, see instructions in the sample conf.yaml.
        ## Only specify multiple hosts when connecting through mongos
        #
      - hosts:
          - <HOST>:<PORT>
    
        ## @param username - string - optional
        ## The username to use for authentication.
        #
        username: datadog
    
        ## @param password - string - optional
        ## The password to use for authentication.
        #
        password: <UNIQUEPASSWORD>
    
        ## @param database - string - optional
        ## The database to collect metrics from.
        #
        database: <DATABASE>
    
        ## @param options - mapping - optional
        ## Connection options. For a complete list, see:
        ## https://docs.mongodb.com/manual/reference/connection-string/#connections-connection-options
        #
        options:
          authSource: admin
    
  2. Agent を再起動します

トレースの収集

Datadog APM は Mongo を統合して、分散システム全体のトレースを確認します。Datadog Agent v6 以降では、トレースの収集はデフォルトで有効化されています。トレースの収集を開始するには、以下の手順に従います。

  1. Datadog でトレースの収集を有効にします
  2. Mongo へのリクエストを作成するアプリケーションをインスツルメントします
収集データ

Agent バージョン 6.0 以降で利用可能

  1. Datadog Agent で、ログの収集はデフォルトで無効になっています。以下のように、datadog.yaml ファイルでこれを有効にします。

    logs_enabled: true
    
  2. MongoDB のログの収集を開始するには、次の構成ブロックを mongo.d/conf.yaml ファイルに追加します。

    logs:
      - type: file
        path: /var/log/mongodb/mongodb.log
        service: mongo
        source: mongodb
    

    service パラメーターと path パラメーターの値を変更し、環境に合わせて構成します。使用可能なすべてのコンフィギュレーションオプションについては、サンプル mongo.yaml を参照してください。

  3. Agent を再起動します

Docker

コンテナで実行中の Agent に対してこのチェックを構成するには:

メトリクスの収集

アプリケーションのコンテナで、オートディスカバリーのインテグレーションテンプレートを Docker ラベルとして設定します。

LABEL "com.datadoghq.ad.check_names"='["mongo"]'
LABEL "com.datadoghq.ad.init_configs"='[{}]'
LABEL "com.datadoghq.ad.instances"='[{"hosts": ["%%host%%:%%port%%"], "username": "datadog", "password" : "<UNIQUEPASSWORD>", "database": "<DATABASE>"}]'
収集データ

Datadog Agent で、ログの収集はデフォルトで無効になっています。有効にする方法については、Docker ログ収集を参照してください。

次に、ログインテグレーションを Docker ラベルとして設定します。

LABEL "com.datadoghq.ad.logs"='[{"source":"mongodb","service":"<SERVICE_NAME>"}]'
トレースの収集

コンテナ化されたアプリケーションの APM は、Agent v6 以降でサポートされていますが、トレースの収集を開始するには、追加のコンフィギュレーションが必要です。

Agent コンテナで必要な環境変数

パラメーター
<DD_API_KEY>api_key
<DD_APM_ENABLED>true
<DD_APM_NON_LOCAL_TRAFFIC>true

利用可能な環境変数およびコンフィギュレーションの全リストについては、Docker アプリケーションのトレース を参照してください。

次に、アプリケーションコンテナをインスツルメントし、Agent コンテナの名前に DD_AGENT_HOST を設定します。

ガイド

このチェックを、Kubernetes で実行している Agent に構成します。

メトリクスの収集

アプリケーションのコンテナで、オートディスカバリーのインテグレーションテンプレートをポッドアノテーションとして設定します。他にも、ファイル、ConfigMap、または key-value ストアを使用してテンプレートを構成できます。

Annotations v1 (Datadog Agent < v7.36 向け)

apiVersion: v1
kind: Pod
metadata:
  name: mongo
  annotations:
    ad.datadoghq.com/mongo.check_names: '["mongo"]'
    ad.datadoghq.com/mongo.init_configs: '[{}]'
    ad.datadoghq.com/mongo.instances: |
      [
        {
          "hosts": ["%%host%%:%%port%%"], 
          "username": "datadog", 
          "password": "<UNIQUEPASSWORD>", 
          "database": "<DATABASE>"
        }
      ]      
spec:
  containers:
    - name: mongo

Annotations v2 (Datadog Agent v7.36+ 向け)

apiVersion: v1
kind: Pod
metadata:
  name: mongo
  annotations:
    ad.datadoghq.com/mongo.checks: |
      {
        "mongo": {
          "init_config": {},
          "instances": [
            {
              "hosts": ["%%host%%:%%port%%"], 
              "username": "datadog", 
              "password": "<UNIQUEPASSWORD>", 
              "database": "<DATABASE>"
            }
          ]
        }
      }      
spec:
  containers:
    - name: mongo
収集データ

Datadog Agent で、ログの収集はデフォルトで無効になっています。有効にする方法については、Kubernetes ログ収集を参照してください。

次に、ログのインテグレーションをポッドアノテーションとして設定します。これは、ファイル、ConfigMap、または key-value ストアを使用して構成することも可能です。

Annotations v1/v2

apiVersion: v1
kind: Pod
metadata:
  name: mongo
  annotations:
    ad.datadoghq.com/mongo.logs: '[{"source":"mongodb","service":"<SERVICE_NAME>"}]'
spec:
  containers:
    - name: mongo
トレースの収集

コンテナ化されたアプリケーションの APM は、Agent v6 以降を実行するホストでサポートされていますが、トレースの収集を開始するには、追加のコンフィギュレーションが必要です。

Agent コンテナで必要な環境変数

パラメーター
<DD_API_KEY>api_key
<DD_APM_ENABLED>true
<DD_APM_NON_LOCAL_TRAFFIC>true

利用可能な環境変数とコンフィギュレーションの完全なリストについては、Kubernetes アプリケーションのトレースおよび Kubernetes DaemonSet のセットアップを参照してください。

次に、アプリケーションコンテナをインスツルメントし、Agent コンテナ名に DD_AGENT_HOST を設定します。

ECS

このチェックを、ECS で実行している Agent に構成するには:

メトリクスの収集

アプリケーションのコンテナで、オートディスカバリーのインテグレーションテンプレートを Docker ラベルとして設定します。

{
  "containerDefinitions": [{
    "name": "mongo",
    "image": "mongo:latest",
    "dockerLabels": {
      "com.datadoghq.ad.check_names": "[\"mongo\"]",
      "com.datadoghq.ad.init_configs": "[{}]",
      "com.datadoghq.ad.instances": "[{\"hosts\": [\"%%host%%:%%port%%\"], \"username\": \"datadog\", \"password\": \"<UNIQUEPASSWORD>\", \"database\": \"<DATABASE>\"}]"
    }
  }]
}
収集データ

Agent バージョン 6.0 以降で利用可能

Datadog Agent で、ログの収集はデフォルトで無効になっています。有効にする方法については、ECS ログ収集を参照してください。

次に、ログインテグレーションを Docker ラベルとして設定します。

{
  "containerDefinitions": [{
    "name": "mongo",
    "image": "mongo:latest",
    "dockerLabels": {
      "com.datadoghq.ad.logs": "[{\"source\":\"mongodb\",\"service\":\"<SERVICE_NAME>\"}]"
    }
  }]
}
トレースの収集

コンテナ化されたアプリケーションの APM は、Agent v6 以降でサポートされていますが、トレースの収集を開始するには、追加のコンフィギュレーションが必要です。

Agent コンテナで必要な環境変数

パラメーター
<DD_API_KEY>api_key
<DD_APM_ENABLED>true
<DD_APM_NON_LOCAL_TRAFFIC>true

利用可能な環境変数およびコンフィギュレーションの全リストについては、Docker アプリケーションのトレース を参照してください。

次に、アプリケーションのコンテナをインスツルメントし、EC2 プライベート IP アドレスDD_AGENT_HOST を設定します。

検証

Agent の status サブコマンドを実行し、Checks セクションで mongo を探します。

リアルユーザーモニタリング

データセキュリティ

mongodb.asserts.msgps
(gauge)
Number of message assertions raised per second.
Shown as assertion
mongodb.asserts.regularps
(gauge)
Number of regular assertions raised per second.
Shown as assertion
mongodb.asserts.rolloversps
(gauge)
Number of times that the rollover counters roll over per second. The counters rollover to zero every 2^30 assertions.
Shown as assertion
mongodb.asserts.userps
(gauge)
Number of user assertions raised per second.
Shown as assertion
mongodb.asserts.warningps
(gauge)
Number of warnings raised per second.
Shown as assertion
mongodb.backgroundflushing.average_ms
(gauge)
Average time for each flush to disk.
Shown as millisecond
mongodb.backgroundflushing.flushesps
(gauge)
Number of times the database has flushed all writes to disk.
Shown as flush
mongodb.backgroundflushing.last_ms
(gauge)
Amount of time that the last flush operation took to complete.
Shown as millisecond
mongodb.backgroundflushing.total_ms
(gauge)
Total number of time that the mongod processes have spent writing (i.e. flushing) data to disk.
Shown as millisecond
mongodb.chunks.jumbo
(gauge)
Total number of 'jumbo' chunks in the mongo cluster.
mongodb.chunks.total
(gauge)
Total number of chunks in the mongo cluster.
mongodb.collection.avgobjsize
(gauge)
The size of the average object in the collection in bytes.
Shown as byte
mongodb.collection.capped
(gauge)
Whether or not the collection is capped.
Shown as record
mongodb.collection.count
(gauge)
Total number of objects in the collection.
Shown as item
mongodb.collection.indexes.accesses.ops
(gauge)
Number of time the index was used.
Shown as event
mongodb.collection.indexsizes
(gauge)
Size of index in bytes.
Shown as byte
mongodb.collection.max
(gauge)
Maximum number of documents in a capped collection.
Shown as document
mongodb.collection.maxsize
(gauge)
Maximum size of a capped collection in bytes.
Shown as byte
mongodb.collection.nindexes
(gauge)
Total number of indices on the collection.
Shown as index
mongodb.collection.size
(gauge)
The total size in bytes of the data in the collection plus the size of every indexes on the mongodb.collection.
Shown as byte
mongodb.collection.storagesize
(gauge)
Total storage space allocated to this collection for document storage.
Shown as byte
mongodb.connection_pool.numascopedconnections
(gauge)
Number of active and stored outgoing scoped synchronous connections from the current mongos instance to other members of the sharded cluster or replica set.
Shown as connection
mongodb.connection_pool.numclientconnections
(gauge)
Reports the number of active and stored outgoing synchronous connections from the current mongos instance to other members of the sharded cluster or replica set.
Shown as connection
mongodb.connection_pool.totalavailable
(gauge)
Reports the total number of available outgoing connections from the current mongos instance to other members of the sharded cluster or replica set.
Shown as connection
mongodb.connection_pool.totalcreatedps
(gauge)
Reports the total number of outgoing connections created per second by the current mongos instance to other members of the sharded cluster or replica set.
Shown as connection
mongodb.connection_pool.totalinuse
(gauge)
Reports the total number of outgoing connections from the current mongod/mongos instance to other members of the sharded cluster or replica set that are currently in use.
Shown as connection
mongodb.connection_pool.totalrefreshing
(gauge)
Reports the total number of outgoing connections from the current mongos instance to other members of the sharded cluster or replica set that are currently being refreshed.
Shown as connection
mongodb.connections.available
(gauge)
Number of unused available incoming connections the database can provide.
Shown as connection
mongodb.connections.current
(gauge)
Number of connections to the database server from clients.
Shown as connection
mongodb.connections.totalcreated
(gauge)
Total number of connections created.
Shown as connection
mongodb.cursors.timedout
(gauge)
Total number of cursors that have timed out since the server process started.
Shown as cursor
mongodb.cursors.totalopen
(gauge)
Number of cursors that MongoDB is maintaining for clients
Shown as cursor
mongodb.dbs
(gauge)
Total number of existing databases
Shown as item
mongodb.dur.commits
(gauge)
Number of transactions written to the journal during the last journal group commit interval.
Shown as transaction
mongodb.dur.commitsinwritelock
(gauge)
Count of the commits that occurred while a write lock was held.
Shown as commit
mongodb.dur.compression
(gauge)
Compression ratio of the data written to the journal.
Shown as fraction
mongodb.dur.earlycommits
(gauge)
Number of times MongoDB requested a commit before the scheduled journal group commit interval.
Shown as commit
mongodb.dur.journaledmb
(gauge)
Amount of data written to journal during the last journal group commit interval.
Shown as mebibyte
mongodb.dur.timems.commits
(gauge)
Amount of time spent for commits.
Shown as millisecond
mongodb.dur.timems.commitsinwritelock
(gauge)
Amount of time spent for commits that occurred while a write lock was held.
Shown as millisecond
mongodb.dur.timems.dt
(gauge)
Amount of time over which MongoDB collected the dur.timeMS data.
Shown as millisecond
mongodb.dur.timems.preplogbuffer
(gauge)
Amount of time spent preparing to write to the journal.
Shown as millisecond
mongodb.dur.timems.remapprivateview
(gauge)
Amount of time spent remapping copy-on-write memory mapped views.
Shown as millisecond
mongodb.dur.timems.writetodatafiles
(gauge)
Amount of time spent writing to data files after journaling.
Shown as millisecond
mongodb.dur.timems.writetojournal
(gauge)
Amount of time spent writing to the journal
Shown as millisecond
mongodb.dur.writetodatafilesmb
(gauge)
Amount of data written from journal to the data files during the last journal group commit interval.
Shown as mebibyte
mongodb.extra_info.heap_usage_bytesps
(gauge)
The total size in bytes of heap space used by the database process. Available on Unix/Linux systems only.
Shown as byte
mongodb.extra_info.page_faultsps
(gauge)
Number of page faults per second that require disk operations.
Shown as fault
mongodb.fsynclocked
(gauge)
Metric representing the fsynclock state of a database. 1 if it's locked and 0 if it's not.
mongodb.globallock.activeclients.readers
(gauge)
Count of the active client connections performing read operations.
Shown as connection
mongodb.globallock.activeclients.total
(gauge)
Total number of active client connections to the database.
Shown as connection
mongodb.globallock.activeclients.writers
(gauge)
Count of active client connections performing write operations.
Shown as connection
mongodb.globallock.currentqueue.readers
(gauge)
Number of operations that are currently queued and waiting for the read lock.
Shown as operation
mongodb.globallock.currentqueue.total
(gauge)
Total number of operations queued waiting for the lock.
Shown as operation
mongodb.globallock.currentqueue.writers
(gauge)
Number of operations that are currently queued and waiting for the write lock.
Shown as operation
mongodb.globallock.locktime
(gauge)
Time since the database last started that the globalLock has been held.
Shown as millisecond
mongodb.globallock.ratio
(gauge)
Ratio of the time that the globalLock has been held to the total time since it was created.
Shown as fraction
mongodb.globallock.totaltime
(gauge)
Time since the database last started and created the global lock.
Shown as microsecond
mongodb.indexcounters.accessesps
(gauge)
Number of times that operations have accessed indexes per second.
Shown as event
mongodb.indexcounters.hitsps
(gauge)
Number of times per second that an index has been accessed and mongod is able to return the index from memory.
Shown as hit
mongodb.indexcounters.missesps
(gauge)
Number of times per second that an operation attempted to access an index that was not in memory.
Shown as miss
mongodb.indexcounters.missratio
(gauge)
Ratio of index hits to misses.
Shown as fraction
mongodb.indexcounters.resetsps
(gauge)
Number of times per second the index counters have been reset.
Shown as event
mongodb.locks.collection.acquirecount.exclusiveps
(gauge)
Number of times the collection lock type was acquired in the Exclusive (X) mode.
Shown as lock
mongodb.locks.collection.acquirecount.intent_exclusiveps
(gauge)
Number of times the collection lock type was acquired in the Intent Exclusive (IX) mode.
Shown as lock
mongodb.locks.collection.acquirecount.intent_sharedps
(gauge)
Number of times the collection lock type was acquired in the Intent Shared (IS) mode.
Shown as lock
mongodb.locks.collection.acquirecount.sharedps
(gauge)
Number of times the collection lock type was acquired in the Shared (S) mode.
Shown as lock
mongodb.locks.collection.acquirewaitcount.exclusiveps
(gauge)
Number of times the collection lock type acquisition in the Exclusive (X) mode encountered waits because the locks were held in a conflicting mode.
Shown as wait
mongodb.locks.collection.acquirewaitcount.sharedps
(gauge)
Number of times the collection lock type acquisition in the Shared (S) mode encountered waits because the locks were held in a conflicting mode.
Shown as wait
mongodb.locks.collection.timeacquiringmicros.exclusiveps
(gauge)
Wait time for the collection lock type acquisitions in the Exclusive (X) mode.
Shown as fraction
mongodb.locks.collection.timeacquiringmicros.sharedps
(gauge)
Wait time for the collection lock type acquisitions in the Shared (S) mode.
Shown as fraction
mongodb.locks.database.acquirecount.exclusiveps
(gauge)
Number of times the database lock type was acquired in the Exclusive (X) mode.
Shown as lock
mongodb.locks.database.acquirecount.intent_exclusiveps
(gauge)
Number of times the database lock type was acquired in the Intent Exclusive (IX) mode.
Shown as lock
mongodb.locks.database.acquirecount.intent_sharedps
(gauge)
Number of times the database lock type was acquired in the Intent Shared (IS) mode.
Shown as lock
mongodb.locks.database.acquirecount.sharedps
(gauge)
Number of times the database lock type was acquired in the Shared (S) mode.
Shown as lock
mongodb.locks.database.acquirewaitcount.exclusiveps
(gauge)
Number of times the database lock type acquisition in the Exclusive (X) mode encountered waits because the locks were held in a conflicting mode.
Shown as wait
mongodb.locks.database.acquirewaitcount.intent_exclusiveps
(gauge)
Number of times the database lock type acquisition in the Intent Exclusive (IX) mode encountered waits because the locks were held in a conflicting mode.
Shown as wait
mongodb.locks.database.acquirewaitcount.intent_sharedps
(gauge)
Number of times the database lock type acquisition in the Intent Shared (IS) mode encountered waits because the locks were held in a conflicting mode.
Shown as wait
mongodb.locks.database.acquirewaitcount.sharedps
(gauge)
Number of times the database lock type acquisition in the Shared (S) mode encountered waits because the locks were held in a conflicting mode.
Shown as wait
mongodb.locks.database.timeacquiringmicros.exclusiveps
(gauge)
Wait time for the database lock type acquisitions in the Exclusive (X) mode.
Shown as fraction
mongodb.locks.database.timeacquiringmicros.intent_exclusiveps
(gauge)
Wait time for the database lock type acquisitions in the Intent Exclusive (IX) mode.
Shown as fraction
mongodb.locks.database.timeacquiringmicros.intent_sharedps
(gauge)
Wait time for the database lock type acquisitions in the Intent Shared (IS) mode.
Shown as fraction
mongodb.locks.database.timeacquiringmicros.sharedps
(gauge)
Wait time for the database lock type acquisitions in the Shared (S) mode.
Shown as fraction
mongodb.locks.global.acquirecount.exclusiveps
(gauge)
Number of times the global lock type was acquired in the Exclusive (X) mode.
Shown as lock
mongodb.locks.global.acquirecount.intent_exclusiveps
(gauge)
Number of times the global lock type was acquired in the Intent Exclusive (IX) mode.
Shown as lock
mongodb.locks.global.acquirecount.intent_sharedps
(gauge)
Number of times the global lock type was acquired in the Intent Shared (IS) mode.
Shown as lock
mongodb.locks.global.acquirecount.sharedps
(gauge)
Number of times the global lock type was acquired in the Shared (S) mode.
Shown as lock
mongodb.locks.global.acquirewaitcount.exclusiveps
(gauge)
Number of times the global lock type acquisition in the Exclusive (X) mode encountered waits because the locks were held in a conflicting mode.
Shown as wait
mongodb.locks.global.acquirewaitcount.intent_exclusiveps
(gauge)
Number of times the global lock type acquisition in the Intent Exclusive (IX) mode encountered waits because the locks were held in a conflicting mode.
Shown as wait
mongodb.locks.global.acquirewaitcount.intent_sharedps
(gauge)
Number of times the global lock type acquisition in the Intent Shared (IS) mode encountered waits because the locks were held in a conflicting mode.
Shown as wait
mongodb.locks.global.acquirewaitcount.sharedps
(gauge)
Number of times the global lock type acquisition in the Shared (S) mode encountered waits because the locks were held in a conflicting mode.
Shown as wait
mongodb.locks.global.timeacquiringmicros.exclusiveps
(gauge)
Wait time for the global lock type acquisitions in the Exclusive (X) mode.
Shown as fraction
mongodb.locks.global.timeacquiringmicros.intent_exclusiveps
(gauge)
Wait time for the global lock type acquisitions in the Intent Exclusive (IX) mode.
Shown as fraction
mongodb.locks.global.timeacquiringmicros.intent_sharedps
(gauge)
Wait time for the global lock type acquisitions in the Intent Shared (IS) mode.
Shown as fraction
mongodb.locks.global.timeacquiringmicros.sharedps
(gauge)
Wait time for the global lock type acquisitions in the Shared (S) mode.
Shown as fraction
mongodb.locks.metadata.acquirecount.exclusiveps
(gauge)
Number of times the metadata lock type was acquired in the Exclusive (X) mode.
Shown as lock
mongodb.locks.metadata.acquirecount.sharedps
(gauge)
Number of times the metadata lock type was acquired in the Shared (S) mode.
Shown as lock
mongodb.locks.mmapv1journal.acquirecount.intent_exclusiveps
(gauge)
Number of times the MMAPv1 storage engine lock type was acquired in the Intent Exclusive (IX) mode.
Shown as lock
mongodb.locks.mmapv1journal.acquirecount.intent_sharedps
(gauge)
Number of times the MMAPv1 storage engine lock type was acquired in the Intent Shared (IS) mode.
Shown as lock
mongodb.locks.mmapv1journal.acquirewaitcount.intent_exclusiveps
(gauge)
Number of times the MMAPv1 storage engine lock type acquisition in the Intent Exclusive (IX) mode encountered waits because the locks were held in a conflicting mode.
Shown as wait
mongodb.locks.mmapv1journal.acquirewaitcount.intent_sharedps
(gauge)
Number of times the MMAPv1 storage engine lock type acquisition in the Intent Shared (IS) mode encountered waits because the locks were held in a conflicting mode.
Shown as wait
mongodb.locks.mmapv1journal.timeacquiringmicros.intent_exclusiveps
(gauge)
Wait time for the MMAPv1 storage engine lock type acquisitions in the Intent Exclusive (IX) mode.
Shown as fraction
mongodb.locks.mmapv1journal.timeacquiringmicros.intent_sharedps
(gauge)
Wait time for the MMAPv1 storage engine lock type acquisitions in the Intent Shared (IS) mode.
Shown as fraction
mongodb.locks.oplog.acquirecount.intent_exclusiveps
(gauge)
Number of times the oplog lock type was acquired in the Intent Exclusive (IX) mode.
Shown as lock
mongodb.locks.oplog.acquirecount.sharedps
(gauge)
Number of times the oplog lock type was acquired in the Shared (S) mode.
Shown as lock
mongodb.locks.oplog.acquirewaitcount.intent_exclusiveps
(gauge)
Number of times the oplog lock type acquisition in the Intent Exclusive (IX) mode encountered waits because the locks were held in a conflicting mode.
Shown as wait
mongodb.locks.oplog.acquirewaitcount.sharedps
(gauge)
Number of times the oplog lock type acquisition in the Shared (S) mode encountered waits because the locks were held in a conflicting mode.
Shown as wait
mongodb.locks.oplog.timeacquiringmicros.intent_exclusiveps
(gauge)
Wait time for the oplog lock type acquisitions in the Intent Exclusive (IX) mode.
Shown as fraction
mongodb.locks.oplog.timeacquiringmicros.sharedps
(gauge)
Wait time for the oplog lock type acquisitions in the Shared (S) mode.
Shown as fraction
mongodb.mem.bits
(gauge)
Size of the in-memory storage engine.
Shown as mebibyte
mongodb.mem.mapped
(gauge)
Amount of mapped memory by the database.
Shown as mebibyte
mongodb.mem.mappedwithjournal
(gauge)
The amount of mapped memory, including the memory used for journaling.
Shown as mebibyte
mongodb.mem.resident
(gauge)
Amount of memory currently used by the database process.
Shown as mebibyte
mongodb.mem.virtual
(gauge)
Amount of virtual memory used by the mongod process.
Shown as mebibyte
mongodb.metrics.commands.count.failedps
(gauge)
Number of times count failed
Shown as command
mongodb.metrics.commands.count.total
(gauge)
Number of times count executed
Shown as command
mongodb.metrics.commands.createindexes.failedps
(gauge)
Number of times createIndexes failed
Shown as command
mongodb.metrics.commands.createindexes.total
(gauge)
Number of times createIndexes executed
Shown as command
mongodb.metrics.commands.delete.failedps
(gauge)
Number of times delete failed
Shown as command
mongodb.metrics.commands.delete.total
(gauge)
Number of times delete executed
Shown as command
mongodb.metrics.commands.eval.failedps
(gauge)
Number of times eval failed
Shown as command
mongodb.metrics.commands.eval.total
(gauge)
Number of times eval executed
Shown as command
mongodb.metrics.commands.findandmodify.failedps
(gauge)
Number of times findAndModify failed
Shown as command
mongodb.metrics.commands.findandmodify.total
(gauge)
Number of times findAndModify executed
Shown as command
mongodb.metrics.commands.insert.failedps
(gauge)
Number of times insert failed
Shown as command
mongodb.metrics.commands.insert.total
(gauge)
Number of times insert executed
Shown as command
mongodb.metrics.commands.update.failedps
(gauge)
Number of times update failed
Shown as command
mongodb.metrics.commands.update.total
(gauge)
Number of times update executed
Shown as command
mongodb.metrics.cursor.open.notimeout
(gauge)
Number of open cursors with the option DBQuery.Option.noTimeout set to prevent timeout after a period of inactivity.
Shown as cursor
mongodb.metrics.cursor.open.pinned
(gauge)
Number of pinned open cursors.
Shown as cursor
mongodb.metrics.cursor.open.total
(gauge)
Number of cursors that MongoDB is maintaining for clients.
Shown as cursor
mongodb.metrics.cursor.timedoutps
(gauge)
Number of cursors that time out, per second.
Shown as cursor
mongodb.metrics.document.deletedps
(gauge)
Number of documents deleted per second.
Shown as document
mongodb.metrics.document.insertedps
(gauge)
Number of documents inserted per second.
Shown as document
mongodb.metrics.document.returnedps
(gauge)
Number of documents returned by queries per second.
Shown as document
mongodb.metrics.document.updatedps
(gauge)
Number of documents updated per second.
Shown as document
mongodb.metrics.getlasterror.wtime.numps
(gauge)
Number of getLastError operations per second with a specified write concern (i.e. w) that wait for one or more members of a replica set to acknowledge the write operation.
Shown as operation
mongodb.metrics.getlasterror.wtime.totalmillisps
(gauge)
Fraction of time (ms/s) that the mongod has spent performing getLastError operations with write concern (i.e. w) that wait for one or more members of a replica set to acknowledge the write operation.
Shown as fraction
mongodb.metrics.getlasterror.wtimeoutsps
(gauge)
Number of times per second that write concern operations have timed out as a result of the wtimeout threshold to getLastError
Shown as event
mongodb.metrics.operation.fastmodps
(gauge)
Number of update operations per second that neither cause documents to grow nor require updates to the index.
Shown as operation
mongodb.metrics.operation.idhackps
(gauge)
Number of queries per second that contain the _id field.
Shown as query
mongodb.metrics.operation.scanandorderps
(gauge)
Number of queries per second that return sorted numbers that cannot perform the sort operation using an index.
Shown as query
mongodb.metrics.operation.writeconflictsps
(gauge)
Number of times per second that write concern operations has encounter a conflict.
Shown as event
mongodb.metrics.queryexecutor.scannedobjectsps
(gauge)
Number of documents scanned per second during queries and query-plan evaluation.
Shown as operation
mongodb.metrics.queryexecutor.scannedps
(gauge)
Number of index items scanned per second during queries and query-plan evaluation.
Shown as operation
mongodb.metrics.record.movesps
(gauge)
Number of times per second documents move within the on-disk representation of the MongoDB data set.
Shown as operation
mongodb.metrics.repl.apply.batches.numps
(gauge)
Number of batches applied across all databases per second.
Shown as operation
mongodb.metrics.repl.apply.batches.totalmillisps
(gauge)
Fraction of time (ms/s) the mongod has spent applying operations from the oplog.
Shown as fraction
mongodb.metrics.repl.apply.opsps
(gauge)
Number of oplog operations applied per second.
Shown as operation
mongodb.metrics.repl.buffer.count
(gauge)
Number of operations in the oplog buffer.
Shown as operation
mongodb.metrics.repl.buffer.maxsizebytes
(gauge)
Maximum size of the buffer.
Shown as byte
mongodb.metrics.repl.buffer.sizebytes
(gauge)
Current size of the contents of the oplog buffer.
Shown as byte
mongodb.metrics.repl.network.bytesps
(gauge)
Amount of data read from the replication sync source per second.
Shown as byte
mongodb.metrics.repl.network.getmores.numps
(gauge)
Number of getmore operations per second.
Shown as operation
mongodb.metrics.repl.network.getmores.totalmillisps
(gauge)
Fraction of time (ms/s) required to collect data from getmore operations.
Shown as fraction
mongodb.metrics.repl.network.opsps
(gauge)
Number of operations read from the replication source per second.
Shown as operation
mongodb.metrics.repl.network.readerscreatedps
(gauge)
Number of oplog query processes created per second.
Shown as process
mongodb.metrics.repl.preload.docs.numps
(gauge)
Number of documents loaded per second during the pre-fetch stage of replication.
Shown as document
mongodb.metrics.repl.preload.docs.totalmillisps
(gauge)
Fraction of time (ms/s) spent loading documents as part of the pre-fetch stage of replication.
Shown as fraction
mongodb.metrics.repl.preload.indexes.numps
(gauge)
Number of index entries loaded by members before updating documents as part of the pre-fetch stage of replication.
Shown as document
mongodb.metrics.repl.preload.indexes.totalmillisps
(gauge)
Fraction of time (ms/s) spent loading documents as part of the pre-fetch stage of replication.
Shown as fraction
mongodb.metrics.ttl.deleteddocumentsps
(gauge)
Number of documents deleted from collections with a ttl index per second.
Shown as document
mongodb.metrics.ttl.passesps
(gauge)
Number of times per second the background process removes documents from collections with a ttl index.
Shown as operation
mongodb.network.bytesinps
(gauge)
The number of bytes that reflects the amount of network traffic received by this database.
Shown as byte
mongodb.network.bytesoutps
(gauge)
The number of bytes that reflects the amount of network traffic sent from this database.
Shown as byte
mongodb.network.numrequestsps
(gauge)
Number of distinct requests that the server has received.
Shown as request
mongodb.opcounters.commandps
(gauge)
Total number of commands per second issued to the database.
Shown as command
mongodb.opcounters.deleteps
(gauge)
Number of delete operations per second.
Shown as operation
mongodb.opcounters.getmoreps
(gauge)
Number of getmore operations per second.
Shown as operation
mongodb.opcounters.insertps
(gauge)
Number of insert operations per second.
Shown as operation
mongodb.opcounters.queryps
(gauge)
Total number of queries per second.
Shown as query
mongodb.opcounters.updateps
(gauge)
Number of update operations per second.
Shown as operation
mongodb.opcountersrepl.commandps
(gauge)
Total number of replicated commands issued to the database per second.
Shown as command
mongodb.opcountersrepl.deleteps
(gauge)
Number of replicated delete operations per second.
Shown as operation
mongodb.opcountersrepl.getmoreps
(gauge)
Number of replicated getmore operations per second.
Shown as operation
mongodb.opcountersrepl.insertps
(gauge)
Number of replicated insert operations per second.
Shown as operation
mongodb.opcountersrepl.queryps
(gauge)
Total number of replicated queries per second.
Shown as query
mongodb.opcountersrepl.updateps
(gauge)
Number of replicated update operations per second.
Shown as operation
mongodb.oplatencies.commands.latency
(gauge)
Total combined latency for database commands.
Shown as microsecond
mongodb.oplatencies.commands.latencyps
(gauge)
Total latency statistics for database commands per second (deprecated).
Shown as command
mongodb.oplatencies.reads.latency
(gauge)
Total combined latency for read requests.
Shown as microsecond
mongodb.oplatencies.reads.latencyps
(gauge)
Total latency statistics for read requests per second (deprecated).
Shown as operation
mongodb.oplatencies.writes.latency
(gauge)
Total combined latency for write requests.
Shown as microsecond
mongodb.oplatencies.writes.latencyps
(gauge)
Total latency statistics for write operations per second (deprecated).
Shown as operation
mongodb.oplog.logsizemb
(gauge)
Total size of the oplog.
Shown as mebibyte
mongodb.oplog.timediff
(gauge)
Oplog window: difference between the first and last operation in the oplog.
Shown as second
mongodb.oplog.usedsizemb
(gauge)
Total amount of space used by the oplog.
Shown as mebibyte
mongodb.replset.health
(gauge)
Member health value of the replica set: conveys if the member is up (i.e. 1) or down (i.e. 0).
mongodb.replset.optime_lag
(gauge)
Delay between a write operation on the primary and its copy to a secondary. Computed only on primary and tagged by 'member'.
Shown as second
mongodb.replset.replicationlag
(gauge)
Delay between a write operation on the primary and its copy to a secondary. Computed on each node and tagged by 'host', but may not be representative of cluster health. Negative values do not indicate that the secondary is ahead of the primary. To use a more up-to-date metric, use mongodb.replset.optime_lag instead.
Shown as second
mongodb.replset.state
(gauge)
State of a replica that reflects its disposition within the set.
mongodb.replset.votefraction
(gauge)
Fraction of votes a server will cast in a replica set election.
Shown as fraction
mongodb.replset.votes
(gauge)
The number of votes a server will cast in a replica set election.
Shown as item
mongodb.sessions.count
(gauge)
Number of active sessions for all users.
Shown as session
mongodb.stats.avgobjsize
(gauge)
The average size of each document in bytes.
Shown as byte
mongodb.stats.collections
(gauge)
Contains a count of the number of collections in that database.
mongodb.stats.datasize
(gauge)
Total size of the data held in this database including the padding factor.
Shown as byte
mongodb.stats.filesize
(gauge)
Total size of the data held in this database including the padding factor (only available with the mmapv1 storage engine).
Shown as byte
mongodb.stats.indexes
(gauge)
Total number of indexes across all collections in the database.
Shown as index
mongodb.stats.indexsize
(gauge)
Total size of all indexes created on this database.
Shown as byte
mongodb.stats.numextents
(gauge)
Contains a count of the number of extents in the database across all collections.
mongodb.stats.objects
(gauge)
Number of objects (documents) in the database across all collections.
Shown as object
mongodb.stats.storagesize
(gauge)
Total amount of space allocated to collections in this database for document storage.
Shown as byte
mongodb.tcmalloc.generic.current_allocated_bytes
(gauge)
Number of bytes used by the application.
Shown as byte
mongodb.tcmalloc.generic.heap_size
(gauge)
Bytes of system memory reserved by TCMalloc.
Shown as byte
mongodb.tcmalloc.tcmalloc.aggressive_memory_decommit
(gauge)
Status of aggressive memory decommit mode.
mongodb.tcmalloc.tcmalloc.central_cache_free_bytes
(gauge)
Number of free bytes in the central cache.
Shown as byte
mongodb.tcmalloc.tcmalloc.current_total_thread_cache_bytes
(gauge)
Number of bytes used across all thread caches.
Shown as byte
mongodb.tcmalloc.tcmalloc.max_total_thread_cache_bytes
(gauge)
Upper limit on total number of bytes stored across all per-thread caches.
Shown as byte
mongodb.tcmalloc.tcmalloc.pageheap_free_bytes
(gauge)
Number of bytes in free mapped pages in page heap.
Shown as byte
mongodb.tcmalloc.tcmalloc.pageheap_unmapped_bytes
(gauge)
Number of bytes in free unmapped pages in page heap.
Shown as byte
mongodb.tcmalloc.tcmalloc.spinlock_total_delay_ns
(gauge)
Spinlock delay time.
Shown as nanosecond
mongodb.tcmalloc.tcmalloc.thread_cache_free_bytes
(gauge)
Number of free bytes in thread caches.
Shown as byte
mongodb.tcmalloc.tcmalloc.transfer_cache_free_bytes
(gauge)
Number of free bytes that are waiting to be transferred between the central cache and a thread cache.
Shown as byte
mongodb.uptime
(gauge)
Number of seconds that the mongos or mongod process has been active.
Shown as second
mongodb.usage.commands.count
(gauge)
Number of commands since server start (deprecated)
Shown as command
mongodb.usage.commands.countps
(gauge)
Number of commands per second
Shown as command
mongodb.usage.commands.time
(gauge)
Total time spent performing commands in microseconds
Shown as microsecond
mongodb.usage.getmore.count
(gauge)
Number of getmore since server start (deprecated)
Shown as fetch
mongodb.usage.getmore.countps
(gauge)
Number of getmore per second
Shown as fetch
mongodb.usage.getmore.time
(gauge)
Total time spent performing getmore in microseconds
Shown as microsecond
mongodb.usage.insert.count
(gauge)
Number of inserts since server start (deprecated)
Shown as commit
mongodb.usage.insert.countps
(gauge)
Number of inserts per second
Shown as commit
mongodb.usage.insert.time
(gauge)
Total time spent performing inserts in microseconds
Shown as microsecond
mongodb.usage.queries.count
(gauge)
Number of queries since server start (deprecated)
Shown as query
mongodb.usage.queries.countps
(gauge)
Number of queries per second
Shown as query
mongodb.usage.queries.time
(gauge)
Total time spent performing queries in microseconds
Shown as microsecond
mongodb.usage.readlock.count
(gauge)
Number of read locks since server start (deprecated)
Shown as lock
mongodb.usage.readlock.countps
(gauge)
Number of read locks per second
Shown as lock
mongodb.usage.readlock.time
(gauge)
Total time spent performing read locks in microseconds
Shown as microsecond
mongodb.usage.remove.count
(gauge)
Number of removes since server start (deprecated)
Shown as commit
mongodb.usage.remove.countps
(gauge)
Number of removes per second
Shown as commit
mongodb.usage.remove.time
(gauge)
Total time spent performing removes in microseconds
Shown as microsecond
mongodb.usage.total.count
(gauge)
Number of operations since server start (deprecated)
Shown as command
mongodb.usage.total.countps
(gauge)
Number of operations per second
Shown as command
mongodb.usage.total.time
(gauge)
Total time spent holding locks in microseconds
Shown as microsecond
mongodb.usage.update.count
(gauge)
Number of updates since server start (deprecated)
Shown as commit
mongodb.usage.update.countps
(gauge)
Number of updates per second
Shown as commit
mongodb.usage.update.time
(gauge)
Total time spent performing updates in microseconds
Shown as microsecond
mongodb.usage.writelock.count
(gauge)
Number of write locks since server start (deprecated)
Shown as lock
mongodb.usage.writelock.countps
(gauge)
Number of write locks per second
Shown as lock
mongodb.usage.writelock.time
(gauge)
Total time spent performing write locks in microseconds
Shown as microsecond
mongodb.wiredtiger.cache.bytes_currently_in_cache
(gauge)
Size of the data currently in cache.
Shown as byte
mongodb.wiredtiger.cache.failed_eviction_of_pages_exceeding_the_in_memory_maximumps
(gauge)
Number of failed eviction of pages that exceeded the in-memory maximum, per second.
Shown as page
mongodb.wiredtiger.cache.in_memory_page_splits
(gauge)
In-memory page splits.
Shown as split
mongodb.wiredtiger.cache.maximum_bytes_configured
(gauge)
Maximum cache size.
Shown as byte
mongodb.wiredtiger.cache.maximum_page_size_at_eviction
(gauge)
Maximum page size at eviction.
Shown as byte
mongodb.wiredtiger.cache.modified_pages_evicted
(gauge)
Number of pages, that have been modified, evicted from the cache.
Shown as page
mongodb.wiredtiger.cache.pages_currently_held_in_cache
(gauge)
Number of pages currently held in the cache.
Shown as page
mongodb.wiredtiger.cache.pages_evicted_by_application_threadsps
(gauge)
Number of page evicted by application threads per second.
Shown as page
mongodb.wiredtiger.cache.pages_evicted_exceeding_the_in_memory_maximumps
(gauge)
Number of pages evicted because they exceeded the cache in-memory maximum, per second.
Shown as page
mongodb.wiredtiger.cache.pages_read_into_cache
(gauge)
Number of pages read into the cache.
Shown as page
mongodb.wiredtiger.cache.pages_written_from_cache
(gauge)
Number of pages writtent from the cache
Shown as page
mongodb.wiredtiger.cache.tracked_dirty_bytes_in_cache
(gauge)
Size of the dirty data in the cache.
Shown as byte
mongodb.wiredtiger.cache.unmodified_pages_evicted
(gauge)
Number of pages, that were not modified, evicted from the cache.
Shown as page
mongodb.wiredtiger.concurrenttransactions.read.available
(gauge)
Number of available read tickets (concurrent transactions) remaining.
Shown as ticket
mongodb.wiredtiger.concurrenttransactions.read.out
(gauge)
Number of read tickets (concurrent transactions) in use.
Shown as ticket
mongodb.wiredtiger.concurrenttransactions.read.totaltickets
(gauge)
Total number of read tickets (concurrent transactions) available.
Shown as ticket
mongodb.wiredtiger.concurrenttransactions.write.available
(gauge)
Number of available write tickets (concurrent transactions) remaining.
Shown as ticket
mongodb.wiredtiger.concurrenttransactions.write.out
(gauge)
Number of write tickets (concurrent transactions) in use.
Shown as ticket
mongodb.wiredtiger.concurrenttransactions.write.totaltickets
(gauge)
Total number of write tickets (concurrent transactions) available.
Shown as ticket

メトリクスの詳細については、MongoDB 3.0 マニュアルを参照してください。

追加のメトリクス

次のメトリクスは、デフォルトでは収集されません。これらを収集するには、mongo.d/conf.yaml ファイルで additional_metrics パラメーターを使用してください。

メトリクスのプレフィックス収集するために additional_metrics に追加する項目
mongodb.collectioncollection
mongodb.commandstop
mongodb.getmoretop
mongodb.inserttop
mongodb.queriestop
mongodb.readLocktop
mongodb.writeLocktop
mongodb.removetop
mongodb.totaltop
mongodb.updatetop
mongodb.writeLocktop
mongodb.tcmalloctcmalloc
mongodb.metrics.commandsmetrics.commands

ヘルプ

レプリケーション状態の変化:
このチェックは、Mongo ノードでレプリケーション状態が変化するたびにイベントを送信します。

ヘルプ

mongodb.can_connect
Returns CRITICAL if the Agent is unable to connect to the monitored MongoDB instance. Returns OK otherwise.
Statuses: ok, critical

ヘルプ

ご不明な点は、Datadog のサポートチームまでお問い合わせください。

その他の参考資料

お役に立つドキュメント、リンクや記事: