- 重要な情報
- はじめに
- 用語集
- Standard Attributes
- ガイド
- インテグレーション
- エージェント
- OpenTelemetry
- 開発者
- Administrator's Guide
- API
- Partners
- DDSQL Reference
- モバイルアプリケーション
- CoScreen
- CoTerm
- Remote Configuration
- Cloudcraft
- アプリ内
- ダッシュボード
- ノートブック
- DDSQL Editor
- Reference Tables
- Sheets
- Watchdog
- アラート設定
- メトリクス
- Bits AI
- Internal Developer Portal
- Error Tracking
- Change Tracking
- Service Management
- Actions & Remediations
- インフラストラクチャー
- Cloudcraft
- Resource Catalog
- ユニバーサル サービス モニタリング
- Hosts
- コンテナ
- Processes
- サーバーレス
- ネットワークモニタリング
- Cloud Cost
- アプリケーションパフォーマンス
- APM
- Continuous Profiler
- データベース モニタリング
- Data Streams Monitoring
- Data Jobs Monitoring
- Data Observability
- Digital Experience
- RUM & セッションリプレイ
- Synthetic モニタリング
- Continuous Testing
- Product Analytics
- Software Delivery
- CI Visibility (CI/CDの可視化)
- CD Visibility
- Deployment Gates
- Test Visibility
- Code Coverage
- Quality Gates
- DORA Metrics
- Feature Flags
- セキュリティ
- セキュリティの概要
- Cloud SIEM
- Code Security
- クラウド セキュリティ マネジメント
- Application Security Management
- Workload Protection
- Sensitive Data Scanner
- AI Observability
- ログ管理
- Observability Pipelines(観測データの制御)
- ログ管理
- CloudPrem
- 管理
Kuma
Supported OS
インテグレーションバージョン2.3.0


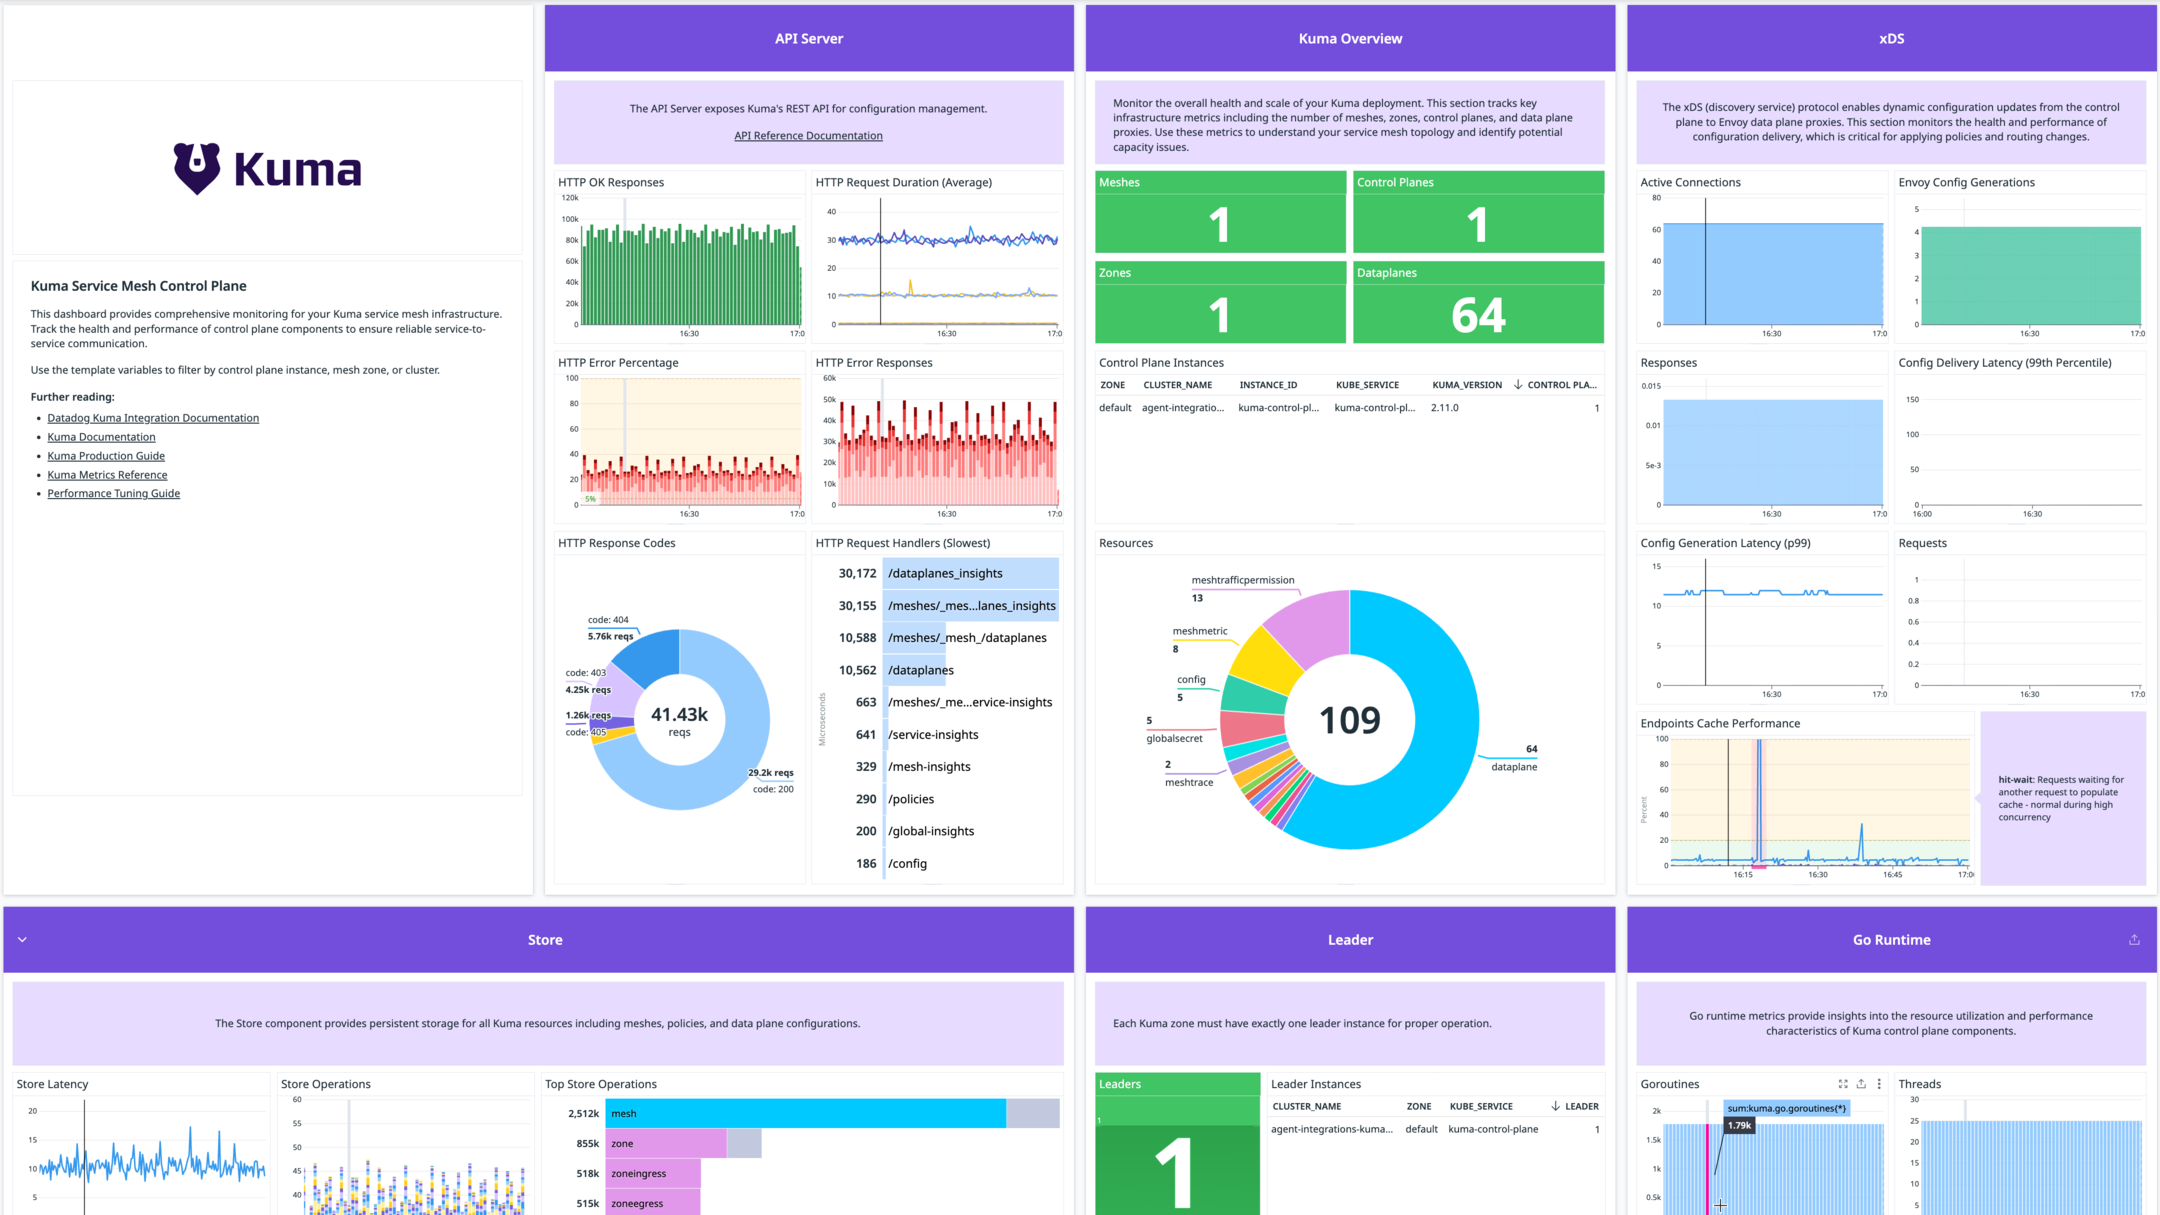
Kuma Control Plane Dashboard - Monitor your service mesh control plane metrics and health
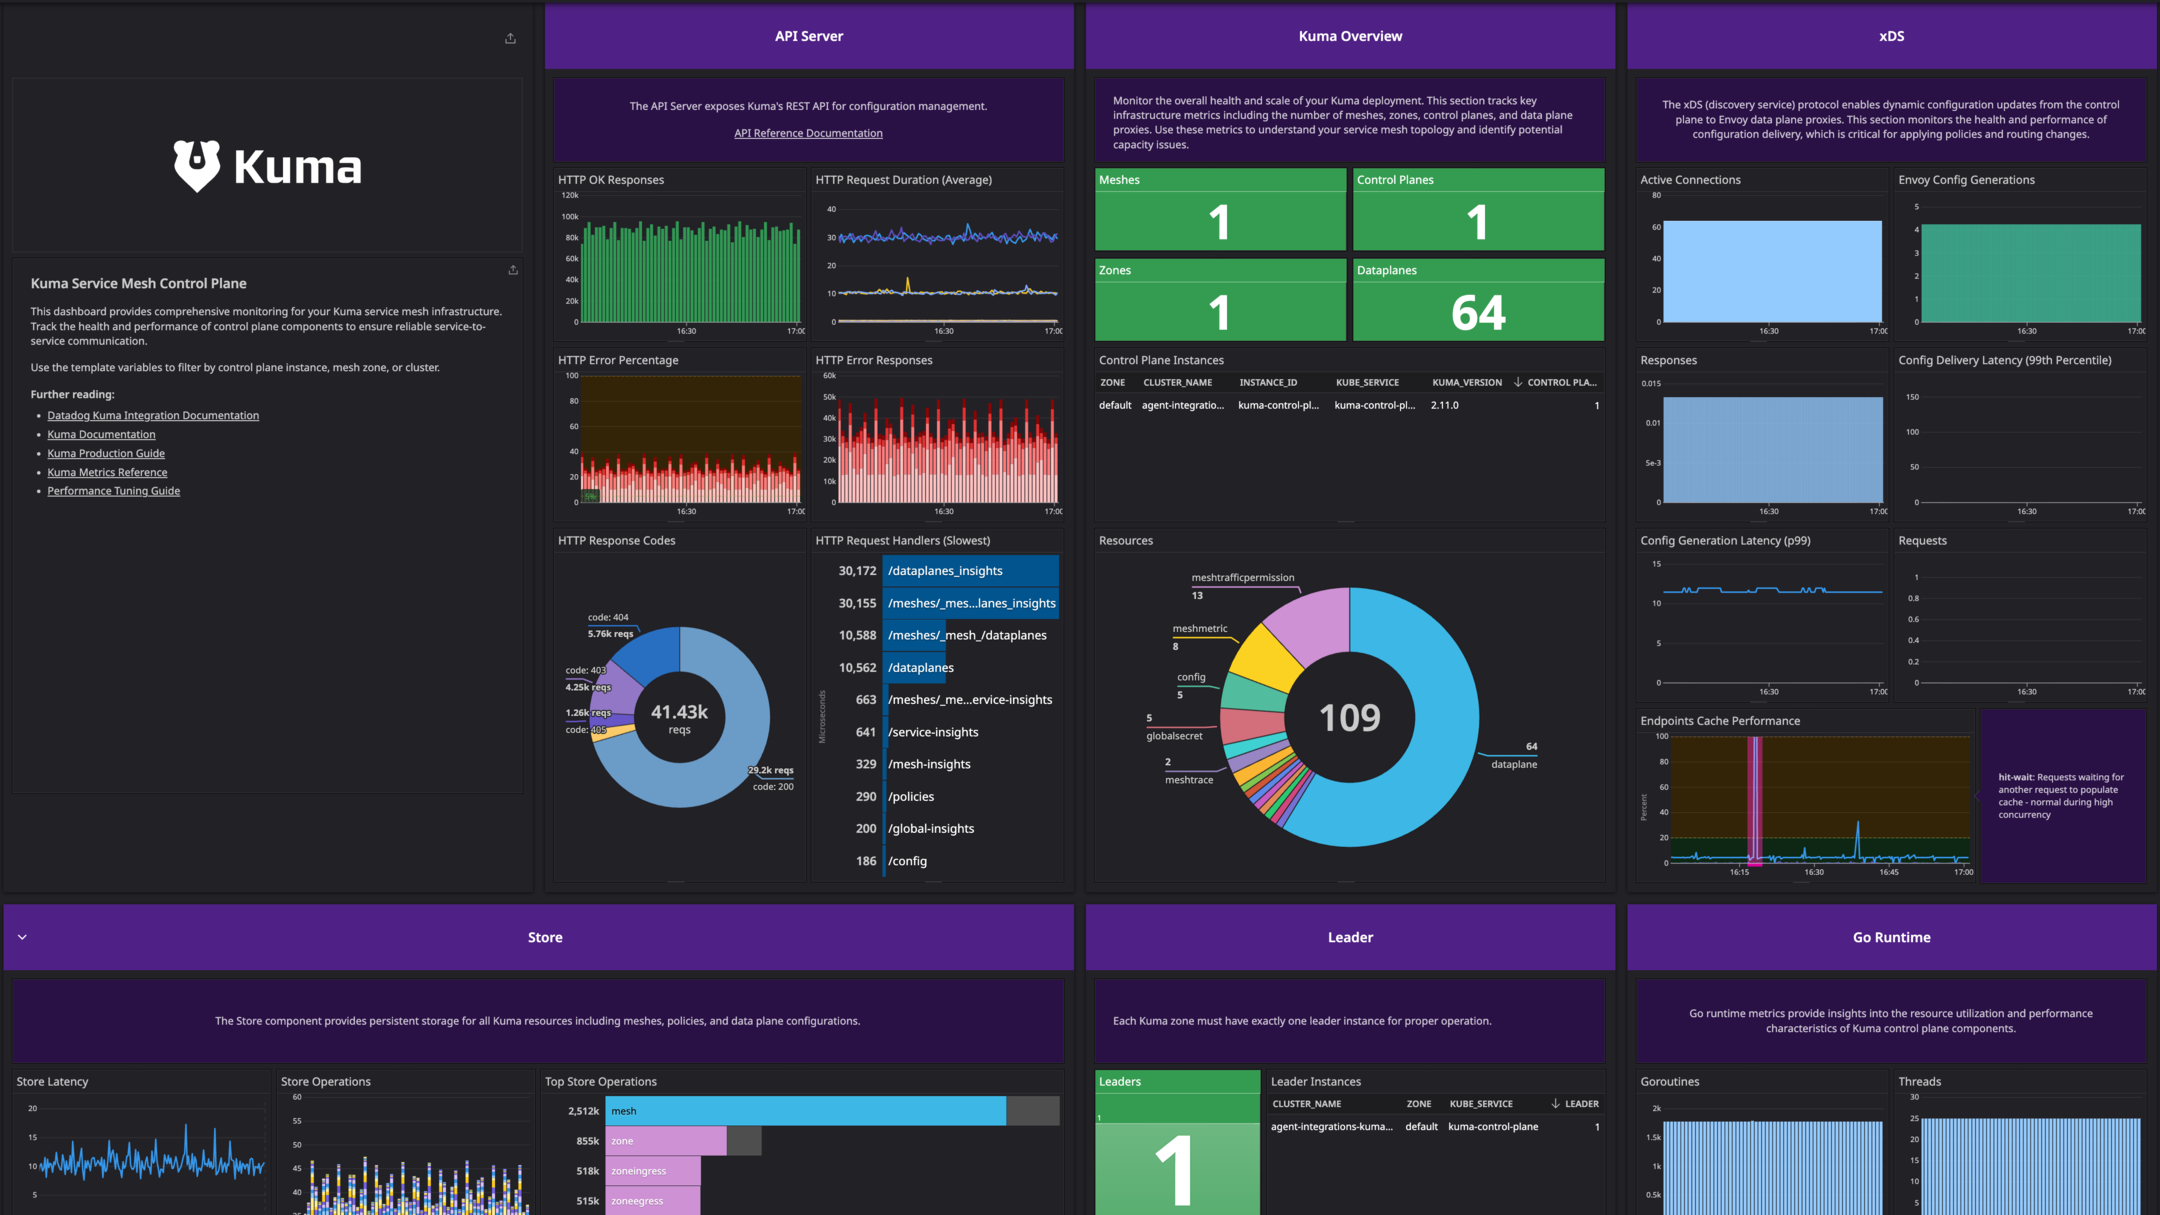
Kuma Control Plane Dashboard (Dark Theme) - Monitor your service mesh control plane metrics and health
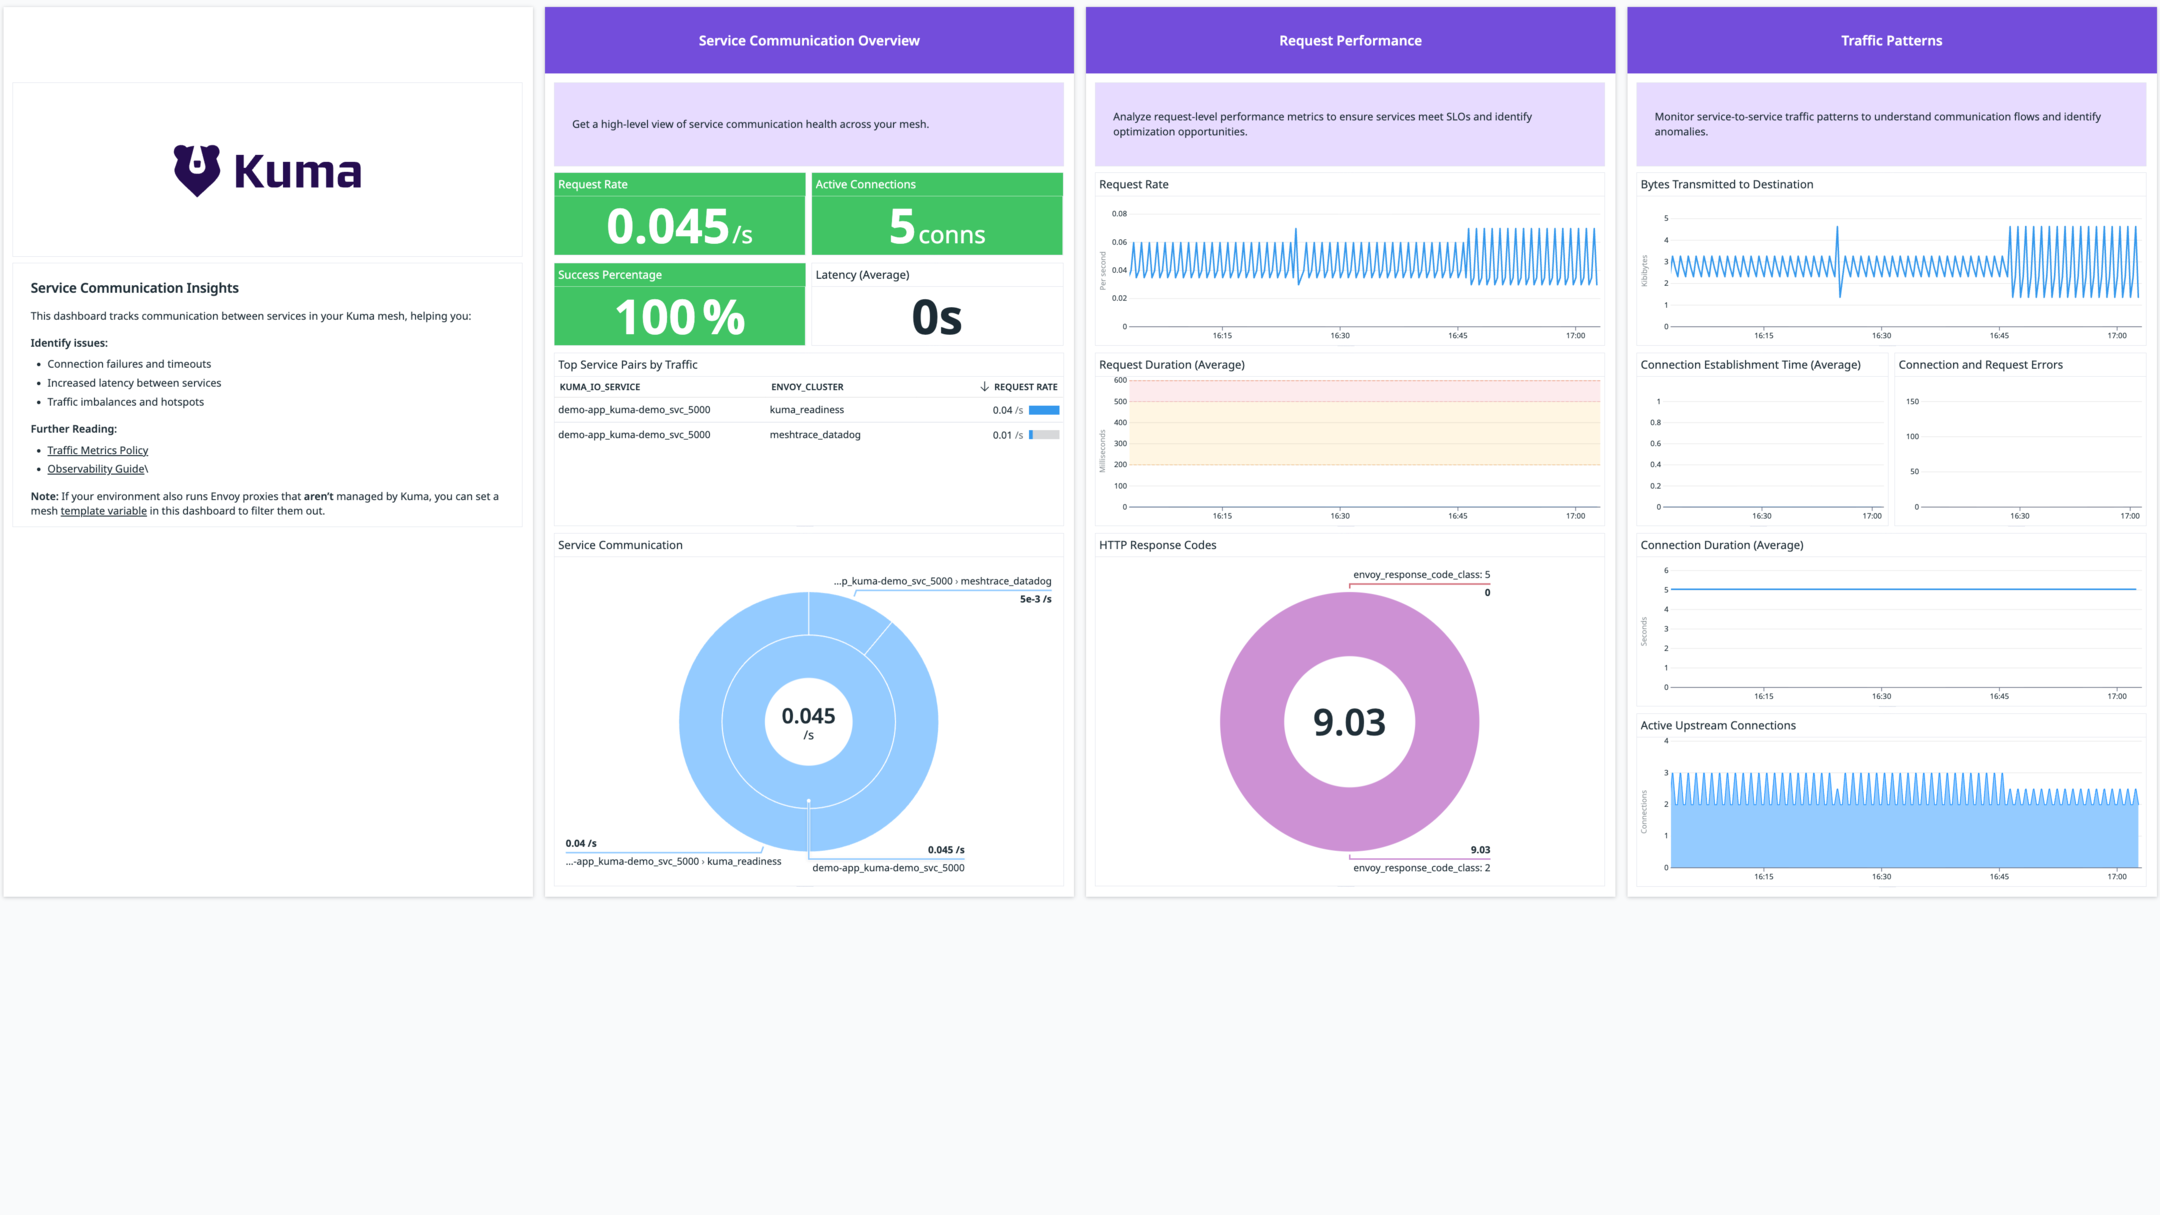
Kuma Service Communication Dashboard - View service-to-service communication and performance
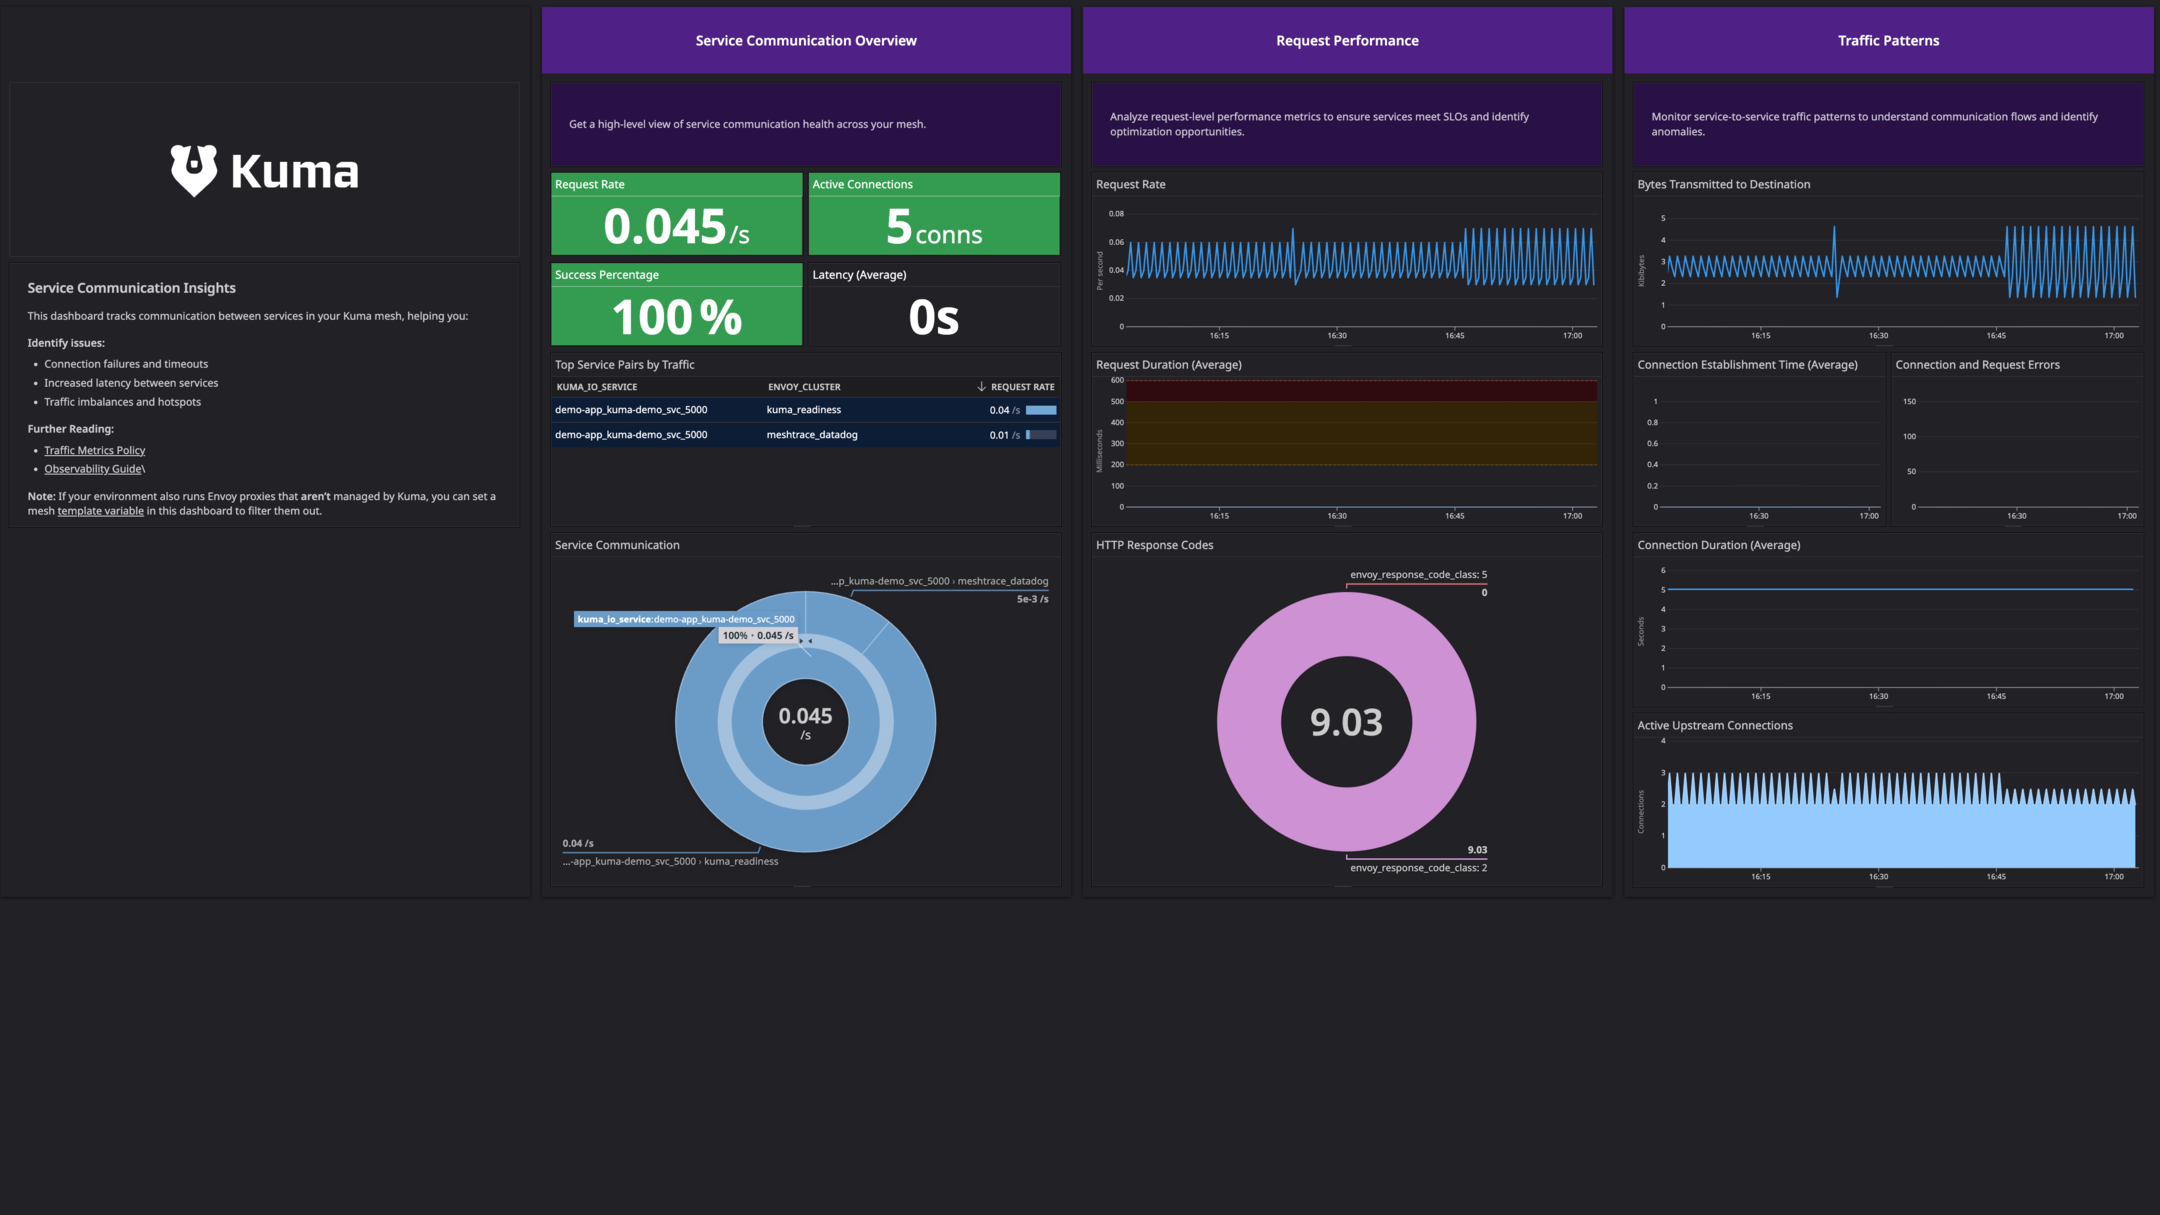
Kuma Service Communication Dashboard (Dark Theme) - View service-to-service communication and performance
このページは日本語には対応しておりません。随時翻訳に取り組んでいます。
翻訳に関してご質問やご意見ございましたら、お気軽にご連絡ください。
翻訳に関してご質問やご意見ございましたら、お気軽にご連絡ください。
Overview
This check monitors Kuma, a universal open-source control plane for service mesh that supports both Kubernetes and Universal mode (VMs and standalone containers). Kong Mesh, the enterprise edition of Kuma, is fully supported through this integration. Beyond the installation steps outlined here, no additional configuration is required.
With the Datadog Kuma integration, you can:
- Monitor the health and performance of the Kuma control plane.
- Collect logs from both the control plane and the data plane proxies.
- Gain detailed insights into the internal traffic flows within your service mesh which helps monitor performance and ensure reliability.
For monitoring the Envoy data planes (sidecars) within your Kuma mesh:
- Use the Envoy integration to collect metrics.
- Use this Kuma integration to collect logs.
Minimum Agent version: 7.68.0
Setup
The Kuma check is included in the Datadog Agent package. No additional installation is needed on your server.
Configuration
Metric collection
Metrics are collected from the Kuma control plane and the Envoy data planes.
Control plane
Autodiscovery (Kubernetes)
To configure the Agent to collect metrics from the Kuma control plane using autodiscovery, apply the following pod annotations to your kuma-control-plane deployment. This example assumes you installed Kuma using Helm. For more information about autodiscovery, see Autodiscovery Integration Templates.
# values.yaml
controlPlane:
  podAnnotations:
    ad.datadoghq.com/control-plane.checks: |
      {
        "kuma": {
          "init_config": {},
          "instances": [
            {
              "openmetrics_endpoint": "http://%%host%%:5680/metrics",
              "service": "kuma-control-plane"
            }
          ]
        }
      }
Note: The autodiscovery annotation for Kuma has the format ad.datadoghq.com/<CONTAINER_NAME>.checks:.
If your control plane has a different name, change the line accordingly. For more information, see the Datadog documentation.
Configuration file
Alternatively, you can configure the integration by editing the kuma.d/conf.yaml file in the conf.d/ folder at the root of your Agent’s configuration directory:
instances:
  - openmetrics_endpoint: http://<KUMA_CONTROL_PLANE_HOST>:5680/metrics
    service: kuma-control-plane
See the sample kuma.d/conf.yaml for all available configuration options.
Data planes (Envoy proxies)
Metrics from the data planes are collected using the Envoy integration.
First, enable Prometheus metrics exposition on your data planes by creating a
MeshMetricpolicy. For more details, see the Kuma documentation.apiVersion: kuma.io/v1alpha1 kind: MeshMetric metadata: name: my-metrics-policy namespace: kuma-system labels: kuma.io/mesh: default spec: default: backends: - type: Prometheus prometheus: port: 5670 path: "/metrics"Next, configure the Datadog Agent to collect these metrics by applying the following annotations to your application pods. For guidance on applying annotations, see Autodiscovery Integration Templates.
ad.datadoghq.com/kuma-sidecar.checks: |
  {
    "envoy": {
      "instances": [
        {
          "openmetrics_endpoint": "http://%%host%%:5670/metrics",
          "collect_server_info": false
        }
      ]
    }
  }
Note: The autodiscovery annotation for Kuma has the format
ad.datadoghq.com/<CONTAINER_NAME>.checks:. If your sidecar has a different name, change the line accordingly. For more information, see the Datadog documentation.
Log collection
Enable log collection in your datadog.yaml file:
logs_enabled: true
Control Plane Logs
To collect logs from the Kuma control plane, apply the following annotations to your kuma-control-plane deployment:
# values.yaml
controlPlane:
  podAnnotations:
    ad.datadoghq.com/control-plane.logs: |
      [
        {
          "source": "kuma",
          "service": "kuma-control-plane"
        }
      ]
Note: The autodiscovery annotation for Kuma has the format ad.datadoghq.com/<CONTAINER_NAME>.logs:.
If your control plane has a different name, change the line accordingly. For more information, see the Datadog documentation.
Data plane logs
Configure the Datadog Agent to collect logs from the Envoy sidecar containers by applying the following annotations to your application pods:
ad.datadoghq.com/kuma-sidecar.logs: |
  [
    {
      "source": "kuma",
      "service": "<MY_SERVICE>",
      "auto_multi_line_detection": true
    }
  ]
Note: The autodiscovery annotation for Kuma has the format ad.datadoghq.com/<CONTAINER_NAME>.logs:.
If your sidecar has a different name, change the line accordingly. For more information, see the Datadog documentation.
Replace <MY_SERVICE> with the name of your service.
Optional: Enable mesh access logs
If you want to collect access logs showing traffic between services in your mesh, you can enable them by creating a MeshAccessLog policy. For more details, see the Kuma documentation.
Enable sidecar injection for Datadog Agent pods
If you have strict mTLS enabled for your mesh, the Datadog Agent requires a Kuma sidecar to be injected into its pods to communicate with other services.
To enable sidecar injection for the Datadog Agent, add the kuma.io/sidecar-injection: enabled label to the namespace where the Agent is deployed (usually datadog):
apiVersion: v1
kind: Namespace
metadata:
  name: datadog
  labels:
    kuma.io/sidecar-injection: enabled
You also need to apply a MeshTrafficPermission policy to allow traffic between the Agent and your services. For more information, see the Kuma documentation.
Validation
Run the Agent’s status subcommand and look for kuma under the Checks section.
Data Collected
Metrics
| kuma.api_server.http_request_duration_seconds.bucket (count) | The latency of API HTTP requests. (bucket) |
| kuma.api_server.http_request_duration_seconds.count (count) | The latency of API HTTP requests. (count) Shown as request |
| kuma.api_server.http_request_duration_seconds.sum (count) | The latency of API HTTP requests. (sum) Shown as second |
| kuma.api_server.http_requests_inflight (gauge) | The number of inflight requests being handled simultaneously. Shown as request |
| kuma.api_server.http_response_size_bytes.bucket (count) | The size of API HTTP responses. (bucket) |
| kuma.api_server.http_response_size_bytes.count (count) | The size of API HTTP responses. (count) |
| kuma.api_server.http_response_size_bytes.sum (count) | The size of API HTTP responses. (sum) Shown as byte |
| kuma.ca_manager.get_cert.count (count) | CA manager get certificate latencies. (count) |
| kuma.ca_manager.get_cert.sum (count) | CA manager get certificate latencies. (sum) Shown as second |
| kuma.ca_manager.get_root_cert_chain.count (count) | CA manager get CA root certificate chain latencies. (count) |
| kuma.ca_manager.get_root_cert_chain.sum (count) | CA manager get CA root certificate chain latencies. (sum) Shown as second |
| kuma.cert_generation.count (count) | Number of generated certificates. |
| kuma.certwatcher.read_certificate.errors_total.count (count) | Total number of certificate read errors. Shown as error |
| kuma.certwatcher.read_certificate.total.count (count) | Total number of certificate reads. Shown as read |
| kuma.cla_cache (gauge) | Cluster Load Assignment cache operations. Shown as operation |
| kuma.component.catalog_writer.count (count) | Inter CP Catalog Writer component interval. (count) |
| kuma.component.catalog_writer.quantile (gauge) | Inter CP Catalog Writer component interval. (quantile) Shown as second |
| kuma.component.catalog_writer.sum (count) | Inter CP Catalog Writer component interval. (sum) Shown as second |
| kuma.component.heartbeat.count (count) | Inter CP Heartbeat component interval. (count) |
| kuma.component.heartbeat.quantile (gauge) | Inter CP Heartbeat component interval. (quantile) Shown as second |
| kuma.component.heartbeat.sum (count) | Inter CP Heartbeat component interval. (sum) Shown as second |
| kuma.component.hostname_generator.count (count) | Hostname generator interval. (count) |
| kuma.component.hostname_generator.quantile (gauge) | Hostname generator interval. (quantile) Shown as second |
| kuma.component.hostname_generator.sum (count) | Hostname generator interval. (sum) Shown as second |
| kuma.component.ms_status_updater.count (count) | Inter CP Heartbeat component interval. (count) |
| kuma.component.ms_status_updater.quantile (gauge) | Inter CP Heartbeat component interval. (quantile) Shown as second |
| kuma.component.ms_status_updater.sum (count) | Inter CP Heartbeat component interval. (sum) Shown as second |
| kuma.component.mzms_status_updater.count (count) | MeshMultizoneService Updater component. (count) Shown as operation |
| kuma.component.mzms_status_updater.quantile (gauge) | MeshMultizoneService Updater component. (quantile) Shown as operation |
| kuma.component.mzms_status_updater.sum (count) | MeshMultizoneService Updater component. (sum) Shown as operation |
| kuma.component.store_counter.count (count) | Store Counter component interval. (count) |
| kuma.component.store_counter.quantile (gauge) | Store Counter component interval. (quantile) Shown as second |
| kuma.component.store_counter.sum (count) | Store Counter component interval. (sum) Shown as second |
| kuma.component.sub_finalizer.count (count) | Subscription finalizer component interval. (count) |
| kuma.component.sub_finalizer.quantile (gauge) | Subscription finalizer component interval. (quantile) Shown as second |
| kuma.component.sub_finalizer.sum (count) | Subscription finalizer component interval. (sum) Shown as second |
| kuma.component.vip_allocator.count (count) | Virtual IP allocation duration. (count) |
| kuma.component.vip_allocator.quantile (gauge) | Virtual IP allocation duration. (quantile) Shown as second |
| kuma.component.vip_allocator.sum (count) | Virtual IP allocation duration. (sum) Shown as second |
| kuma.component.zone_available_services.count (count) | Available services tracker component interval. (count) |
| kuma.component.zone_available_services.quantile (gauge) | Available services tracker component interval. (quantile) Shown as second |
| kuma.component.zone_available_services.sum (count) | Available services tracker component interval. (sum) Shown as second |
| kuma.controller_runtime.active_workers (gauge) | Number of currently used workers per controller. Shown as worker |
| kuma.controller_runtime.max_concurrent_reconciles (gauge) | Maximum number of concurrent reconciles per controller. |
| kuma.controller_runtime.reconcile.errors_total.count (count) | Total number of reconciliation errors per controller. Shown as error |
| kuma.controller_runtime.reconcile.panics_total.count (count) | Total number of reconciliation panics per controller. |
| kuma.controller_runtime.reconcile.time_seconds.bucket (count) | Length of time per reconciliation per controller. (bucket) |
| kuma.controller_runtime.reconcile.time_seconds.count (count) | Length of time per reconciliation per controller. (count) |
| kuma.controller_runtime.reconcile.time_seconds.sum (count) | Length of time per reconciliation per controller. (sum) Shown as second |
| kuma.controller_runtime.reconcile.total.count (count) | Total number of reconciliations per controller. |
| kuma.controller_runtime.terminal_reconcile.errors_total.count (count) | Total number of terminal reconciliation errors per controller. Shown as error |
| kuma.controller_runtime.webhook.latency_seconds.bucket (count) | Histogram of the latency of processing admission requests. (bucket) |
| kuma.controller_runtime.webhook.latency_seconds.count (count) | Histogram of the latency of processing admission requests. (count) |
| kuma.controller_runtime.webhook.latency_seconds.sum (count) | Histogram of the latency of processing admission requests. (sum) Shown as second |
| kuma.controller_runtime.webhook.panics_total.count (count) | Total number of webhook panics. |
| kuma.controller_runtime.webhook.requests_in_flight (gauge) | Current number of admission requests being served. |
| kuma.controller_runtime.webhook.requests_total.count (count) | Total number of admission requests by HTTP status code. Shown as request |
| kuma.cp_info (gauge) | Static information about the CP instance. |
| kuma.dp_server.http_request_duration_seconds.bucket (count) | The latency of the HTTP requests. (bucket) |
| kuma.dp_server.http_request_duration_seconds.count (count) | The latency of the HTTP requests. (count) |
| kuma.dp_server.http_request_duration_seconds.sum (count) | The latency of the HTTP requests. (sum) Shown as second |
| kuma.dp_server.http_requests_inflight (gauge) | The number of inflight requests being handled at the same time. Shown as request |
| kuma.dp_server.http_response_size_bytes.bucket (count) | The size of the HTTP responses. (bucket) |
| kuma.dp_server.http_response_size_bytes.count (count) | The size of the HTTP responses. (count) |
| kuma.dp_server.http_response_size_bytes.sum (count) | The size of the HTTP responses. (sum) Shown as byte |
| kuma.events.dropped.count (count) | Number of dropped events in event bus due to full channels. Shown as event |
| kuma.go.gc.duration_seconds.count (count) | Wall-time pause (stop-the-world) duration in garbage collection cycles. (count) |
| kuma.go.gc.duration_seconds.quantile (gauge) | Wall-time pause (stop-the-world) duration in garbage collection cycles. (quantile) Shown as second |
| kuma.go.gc.duration_seconds.sum (count) | Wall-time pause (stop-the-world) duration in garbage collection cycles. (sum) Shown as second |
| kuma.go.goroutines (gauge) | Number of goroutines that currently exist. |
| kuma.go.memstats.alloc_bytes (gauge) | Number of bytes allocated in heap and currently in use. Shown as byte |
| kuma.go.threads (gauge) | Number of OS threads created. Shown as thread |
| kuma.grpc.server.handled_total.count (count) | Total number of RPCs completed on the server, regardless of success or failure. Shown as request |
| kuma.grpc.server.handling_seconds.bucket (count) | Histogram of response latency (seconds) of gRPC that had been application-level handled by the server. (bucket) |
| kuma.grpc.server.handling_seconds.count (count) | Histogram of response latency (seconds) of gRPC that had been application-level handled by the server. (count) |
| kuma.grpc.server.handling_seconds.sum (count) | Histogram of response latency (seconds) of gRPC that had been application-level handled by the server. (sum) Shown as second |
| kuma.grpc.server.msg_received_total.count (count) | Total number of gRPC stream messages received on the server. Shown as message |
| kuma.grpc.server.msg_sent_total.count (count) | Total number of gRPC stream messages sent by the server. Shown as message |
| kuma.grpc.server.started_total.count (count) | Total number of RPCs started on the server. Shown as request |
| kuma.insights_resyncer.event_time_processing.count (count) | The time spent to process an event. (count) |
| kuma.insights_resyncer.event_time_processing.quantile (gauge) | The time spent to process an event. (quantile) Shown as second |
| kuma.insights_resyncer.event_time_processing.sum (count) | The time spent to process an event. (sum) Shown as second |
| kuma.insights_resyncer.event_time_to_process.count (count) | The time between an event being added to a batch and it being processed, in a well behaving system this should be less of equal to the MinResyncInterval. (count) |
| kuma.insights_resyncer.event_time_to_process.quantile (gauge) | The time between an event being added to a batch and it being processed, in a well behaving system this should be less of equal to the MinResyncInterval. (quantile) Shown as second |
| kuma.insights_resyncer.event_time_to_process.sum (count) | The time between an event being added to a batch and it being processed, in a well behaving system this should be less of equal to the MinResyncInterval. (sum) Shown as second |
| kuma.insights_resyncer.processor_idle_time.count (count) | The time that the processor loop sits idle, the closer this gets to 0 the more the processing loop is at capacity. (count) |
| kuma.insights_resyncer.processor_idle_time.quantile (gauge) | The time that the processor loop sits idle, the closer this gets to 0 the more the processing loop is at capacity. (quantile) Shown as second |
| kuma.insights_resyncer.processor_idle_time.sum (count) | The time that the processor loop sits idle, the closer this gets to 0 the more the processing loop is at capacity. (sum) Shown as second |
| kuma.leader (gauge) | Indicates if this instance is the leader (1 for leader). |
| kuma.leader_election.master_status (gauge) | Gauge of if the reporting system is master of the relevant lease, 0 indicates backup, 1 indicates master. ‘kuma_name’ is the tag used to indentify the lease. |
| kuma.mesh_cache (gauge) | Mesh context cache operations for XDS resource optimization. Shown as operation |
| kuma.process.cpu_seconds_total.count (count) | Total user and system CPU time spent in seconds. Shown as second |
| kuma.process.max_fds (gauge) | Maximum number of open file descriptors. |
| kuma.process.network.receive_bytes_total.count (count) | Number of bytes received by the process over the network. Shown as byte |
| kuma.process.network.transmit_bytes_total.count (count) | Number of bytes sent by the process over the network. Shown as byte |
| kuma.process.open_fds (gauge) | Number of open file descriptors. |
| kuma.process.resident_memory_bytes (gauge) | Resident memory size in bytes. Shown as byte |
| kuma.process.start_time_seconds (gauge) | Start time of the process since unix epoch in seconds. Shown as second |
| kuma.process.virtual_memory_bytes (gauge) | Virtual memory size in bytes. Shown as byte |
| kuma.process.virtual_memory_max_bytes (gauge) | Maximum amount of virtual memory available in bytes. Shown as byte |
| kuma.promhttp.metric_handler.requests_in_flight (gauge) | Current number of scrapes being served. Shown as request |
| kuma.promhttp.metric_handler.requests_total.count (count) | Total number of scrapes by HTTP status code. Shown as request |
| kuma.resources_count (gauge) | Number of Kuma resources by type and zone. |
| kuma.rest_client.requests_total.count (count) | Number of HTTP requests, partitioned by status code, method, and host. Shown as request |
| kuma.store.bucket (count) | Store operations. (bucket) Shown as operation |
| kuma.store.count (count) | Store operations. (count) Shown as operation |
| kuma.store.sum (count) | Store operations. (sum) Shown as operation |
| kuma.store_cache.count (count) | Resource store cache operations (Get/List) to reduce database load. Shown as item |
| kuma.store_conflicts.count (count) | Store conflicts while updating. |
| kuma.vip_generation.count (count) | Virtual IP generation. (count) |
| kuma.vip_generation.sum (count) | Virtual IP generation. (sum) |
| kuma.vip_generation_errors.count (count) | Errors during Virtual IP generation. Shown as error |
| kuma.workqueue.adds_total.count (count) | Total number of adds handled by workqueue. Shown as item |
| kuma.workqueue.depth (gauge) | Current depth of workqueue. Shown as item |
| kuma.workqueue.longest_running_processor_seconds (gauge) | How many seconds has the longest running processor for workqueue been running. Shown as second |
| kuma.workqueue.queue_duration_seconds.bucket (count) | How long in seconds an item stays in workqueue before being requested. (bucket) |
| kuma.workqueue.queue_duration_seconds.count (count) | How long in seconds an item stays in workqueue before being requested. (count) |
| kuma.workqueue.queue_duration_seconds.sum (count) | How long in seconds an item stays in workqueue before being requested. (sum) Shown as second |
| kuma.workqueue.retries_total.count (count) | Total number of retries handled by workqueue. |
| kuma.workqueue.unfinished_work_seconds (gauge) | How many seconds of work has been done that is in progress and hasn’t been observed by work_duration. Large values indicate stuck threads. One can deduce the number of stuck threads by observing the rate at which this increases. Shown as second |
| kuma.workqueue.work_duration_seconds.bucket (count) | How long in seconds processing an item from workqueue takes. (bucket) |
| kuma.workqueue.work_duration_seconds.count (count) | How long in seconds processing an item from workqueue takes. (count) |
| kuma.workqueue.work_duration_seconds.sum (count) | How long in seconds processing an item from workqueue takes. (sum) Shown as second |
| kuma.xds.delivery.count (count) | XDS config delivery including response (ACK/NACK) from client. (count) |
| kuma.xds.delivery.sum (count) | XDS config delivery including response (ACK/NACK) from client. (sum) Shown as second |
| kuma.xds.generation.count (count) | XDS Snapshot generation. (count) |
| kuma.xds.generation.quantile (gauge) | XDS Snapshot generation. (quantile) Shown as second |
| kuma.xds.generation.sum (count) | XDS Snapshot generation. (sum) Shown as second |
| kuma.xds.generation_errors.count (count) | Errors during XDS generation. Shown as error |
| kuma.xds.requests_received.count (count) | Number of confirmations requests from a client. Shown as request |
| kuma.xds.responses_sent.count (count) | Number of responses sent by the server to a client. Shown as response |
| kuma.xds.streams_active (gauge) | Number of active connections between a server and a client. Shown as connection |
Events
The Kuma integration does not include any events.
Service Checks
kuma.openmetrics.health
Returns CRITICAL if the Agent is unable to connect to the Kuma OpenMetrics endpoint, otherwise returns OK.
Statuses: ok, critical
Troubleshooting
mTLS connection issues
If you have strict mTLS with no passthrough enabled, the Agent may fail to connect to the control plane or other services. This is because all traffic is encrypted and routed through Kuma’s data plane proxies. To resolve this, you must enable sidecar injection for the Datadog Agent pods.
Once the sidecar is injected, you should replace %%host%% with the Kubernetes service name in your autodiscovery annotations, as the %%host%% macro may no longer work correctly when traffic is routed through the mesh. This is not necessary for the Kuma control plane or sidecars.
For example, instead of:
"openmetrics_endpoint": "http://%%host%%:5670/metrics"
Use the service name:
"openmetrics_endpoint": "http://my-service.my-namespace.svc.cluster.local:5670/metrics"
When mTLS is enabled, you may want to disable auto-discovery auto-configuration since it uses %%host%% macros. For more information on how to disable auto-configuration, see the Datadog documentation.
Need help? Contact Datadog support.
