- 重要な情報
- はじめに
- 用語集
- Standard Attributes
- ガイド
- インテグレーション
- エージェント
- OpenTelemetry
- 開発者
- Administrator's Guide
- API
- Partners
- DDSQL Reference
- モバイルアプリケーション
- CoScreen
- CoTerm
- Remote Configuration
- Cloudcraft
- アプリ内
- ダッシュボード
- ノートブック
- DDSQL Editor
- Reference Tables
- Sheets
- Watchdog
- アラート設定
- メトリクス
- Bits AI
- Internal Developer Portal
- Error Tracking
- Change Tracking
- Service Management
- Actions & Remediations
- インフラストラクチャー
- Cloudcraft
- Resource Catalog
- ユニバーサル サービス モニタリング
- Hosts
- コンテナ
- Processes
- サーバーレス
- ネットワークモニタリング
- Cloud Cost
- アプリケーションパフォーマンス
- APM
- Continuous Profiler
- データベース モニタリング
- Data Streams Monitoring
- Data Jobs Monitoring
- Data Observability
- Digital Experience
- RUM & セッションリプレイ
- Synthetic モニタリング
- Continuous Testing
- Product Analytics
- Software Delivery
- CI Visibility (CI/CDの可視化)
- CD Visibility
- Deployment Gates
- Test Visibility
- Code Coverage
- Quality Gates
- DORA Metrics
- Feature Flags
- セキュリティ
- セキュリティの概要
- Cloud SIEM
- Code Security
- クラウド セキュリティ マネジメント
- Application Security Management
- Workload Protection
- Sensitive Data Scanner
- AI Observability
- ログ管理
- Observability Pipelines(観測データの制御)
- ログ管理
- CloudPrem
- 管理
Datadog VMware Tanzu Application Service Integration Architecture
このページは日本語には対応しておりません。随時翻訳に取り組んでいます。
翻訳に関してご質問やご意見ございましたら、お気軽にご連絡ください。
翻訳に関してご質問やご意見ございましたら、お気軽にご連絡ください。
Overview
This page describes the architecture behind the Datadog VMware Tanzu Application Service integration.
The following sections provide further detail about the individual components and their interrelationships.
Datadog components for Pivotal Cloud Foundry/PAS
You can deploy and configure the components of the Datadog integration with VMware Tanzu Application Service from the Tanzu Ops Manager, with the Application Monitoring and Cluster Monitoring tiles.
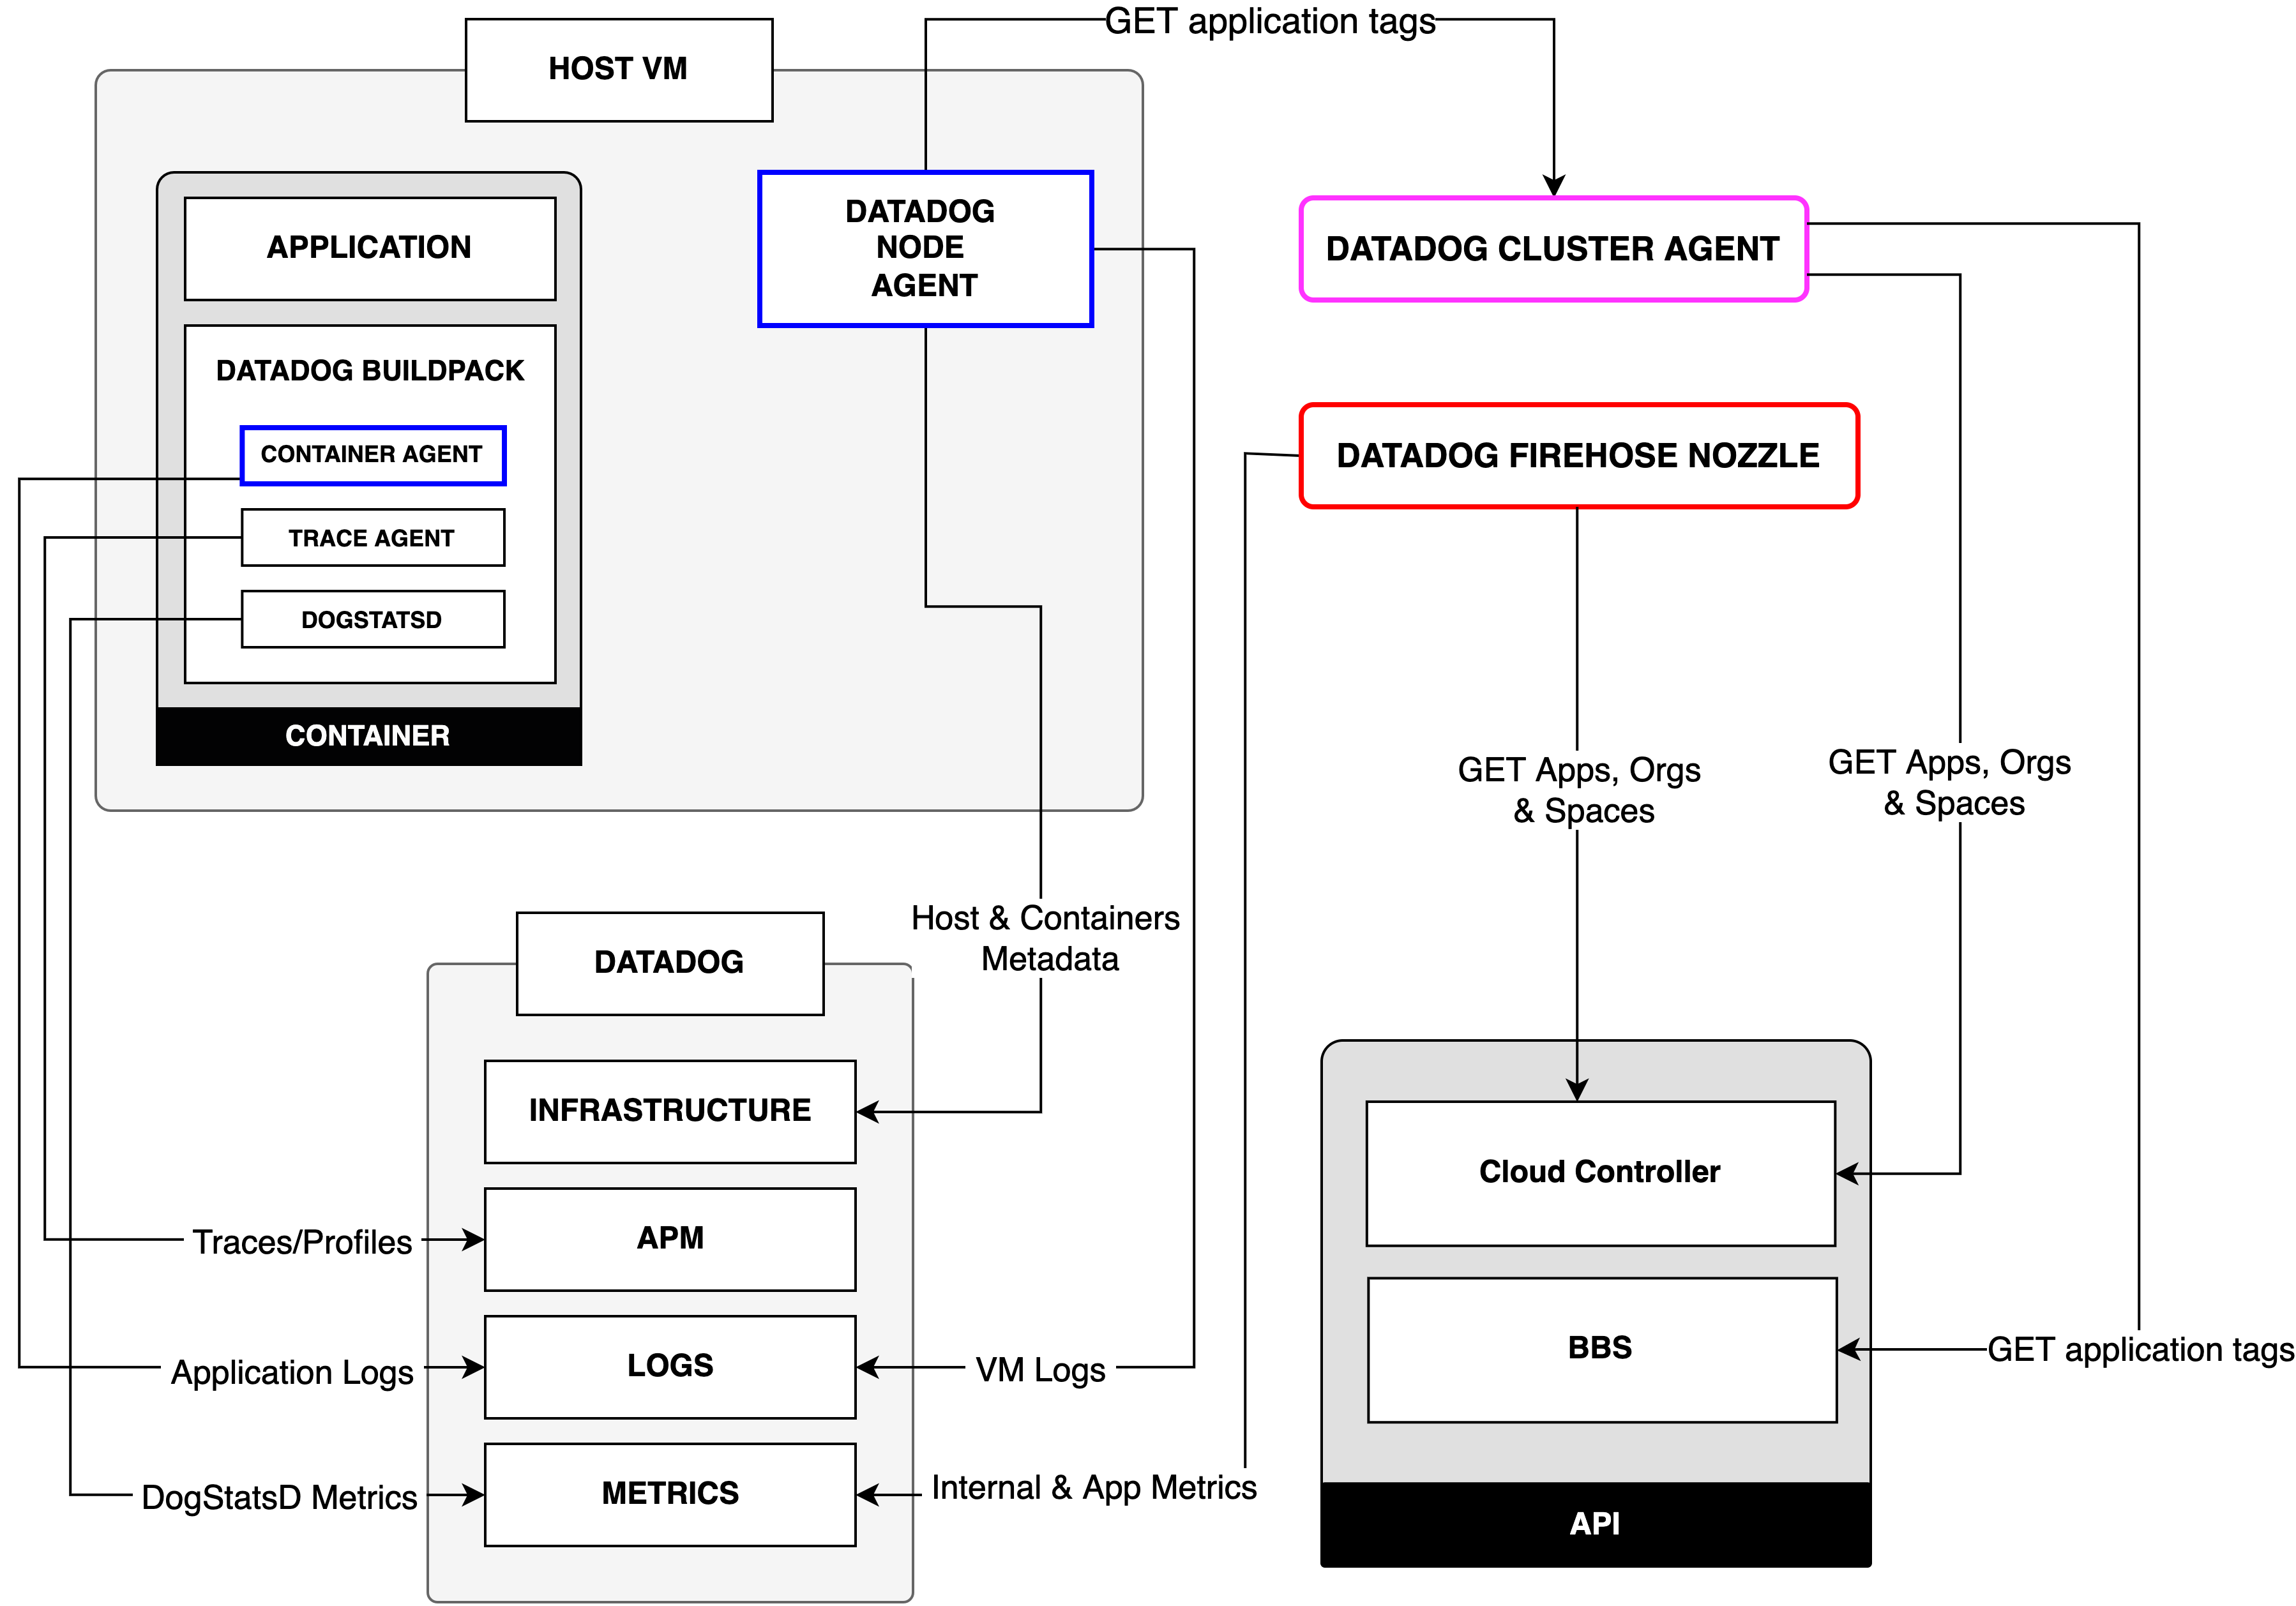
- Datadog Cluster Monitoring Tile - Platform Engineers use this to collect, visualize, and alert on metrics and logs from PCF Platform Components. From this tile, users can deploy the Datadog Node Agent, Datadog Cluster Agent (DCA), and the Firehose Nozzle.
- Datadog Application Monitoring Tile - Application developers use this to collect custom metrics, traces, and logs from their applications. From this tile, users can deploy the Datadog Buildpack which contains the Container Agent, Trace Agent, and DogStatsD.
Datadog Cluster Monitoring tile components
Node Agent
The Node Agent exists on every BOSH VM and reports hosts (VMs), containers, and processes to Datadog. The Node Agent is deployed and configured from the Cluster Monitoring tile in Tanzu Ops Manager. You can also use the Node Agent to retrieve logs from supported integrations.
Tags collected
- Metadata pertaining to the underlying BOSH VMs (for example,
bosh_job,bosh_name). - Corresponding container and application tags from the Datadog Cluster Agent (DCA).
- Custom tags added from the tile during configuration.
All metadata collected appears as host VM and container tags. The host VM monitored by the Node Agent appear in the Infrastructure List page, and the underlying containers within the host appear in the Container Map and Live Containers page.
Datadog Cluster Agent (DCA)
The DCA provides a streamlined, centralized approach to collecting cluster-level monitoring data. It performs similarly to the DCA in a Kubernetes environment. The DCA reduces the load on the Cloud Controller API (CAPI) as it queries the CAPI on behalf of all the singular Node Agents. It relays the cluster-level metadata to the Node Agents, allowing enrichment of the locally-collected metrics. The Node Agents periodically poll an internal API endpoint on the DCA for cluster metadata, and assign it to the corresponding containers within the VM.
Metadata Collected
- Cluster-level metadata (for example,
org_id,org_name,space_id,space_name). - Labels and annotations exposed from the application metadata following the autodiscovery tags format
tags.datadoghq.com/k=v. - List of apps running on each host VM.
Autodiscovery tags are added at the CAPI level as metadata for the application. You can add custom tags through the CAPI, and the DCA picks up these tags periodically. You can also configure the DCA to act as a cache for the Firehose Nozzle with a configuration option within the Cluster Monitoring Tile. This enables the nozzle to query data from the DCA instead of the CAPI, further reducing the load on the CAPI. The metadata collected by the DCA can be seen in the Containers page, with PCF containers assigned the following tags: cloudfoundry, app_name, app_id, and bosh_deployment.
Firehose Nozzle
The Datadog Firehose Nozzle consumes information from your deployment’s Loggregator (PCF’s system for aggregating deployment metrics and application logs). The nozzle collects internal nozzle metrics, application metrics, organization metrics, and logs from the Firehose, and adds the corresponding tags and application metadata it collects from the CAPI. You can configure the metadata filter from the Cluster Monitoring Tile for the Datadog Firehose Nozzle with an allow- and deny-list mechanism. Specify which metadata to add to the metrics collected from the nozzle, and view the metrics and their corresponding tags in the Metrics Summary and Metrics Explorer.
Metadata Collected
- Tags exposed from the application metadata following the autodiscovery tags format
tags.datadoghq.com/k=v. These are the tags a user can add to the application metadata from the CAPI.
Datadog Application Monitoring tile components
Buildpack
The Datadog Buildpack installs the lightweight Datadog Container Agent and Datadog Trace Agent for APM inside the container alongside the application. The Agent is only launched or started if logs collection is enabled through setting DD_LOGS_ENABLED=TRUE, used to send application-level logs to Datadog. Otherwise, DogStatsD is launched to send metrics. When the application is running with the Datadog buildpack, you can pass multiple configuration options using environment variables for the application. The variables can come from the application manifest (manifest.yml) or the Cloud Foundry(CF) CLI using the cf set-env command.
Metadata Collected
- Tags extracted from the
VCAP_APPLICATIONenvironment variable (for example,application_id,name,instance_index,space_name,uris), and theCF_INSTANCE_IPenvironment variable for thecf_instance_iptag. - Tags added using the
DD_TAGSenvironment variable.
These tags are present in the metrics, traces, and logs collected by the Datadog Agent. Depending on the data collected, view it in the Metrics Explorer or Metrics Summary, the Trace Explorer, or the Log Explorer.

