ESET Protect - Filtered Websites Events
ESET Protect - Threat Events
ESET Protect - Firewall Events
ESET Protect - Audit Events
このページは日本語には対応しておりません。随時翻訳に取り組んでいます。
翻訳に関してご質問やご意見ございましたら、
お気軽にご連絡ください。
Overview
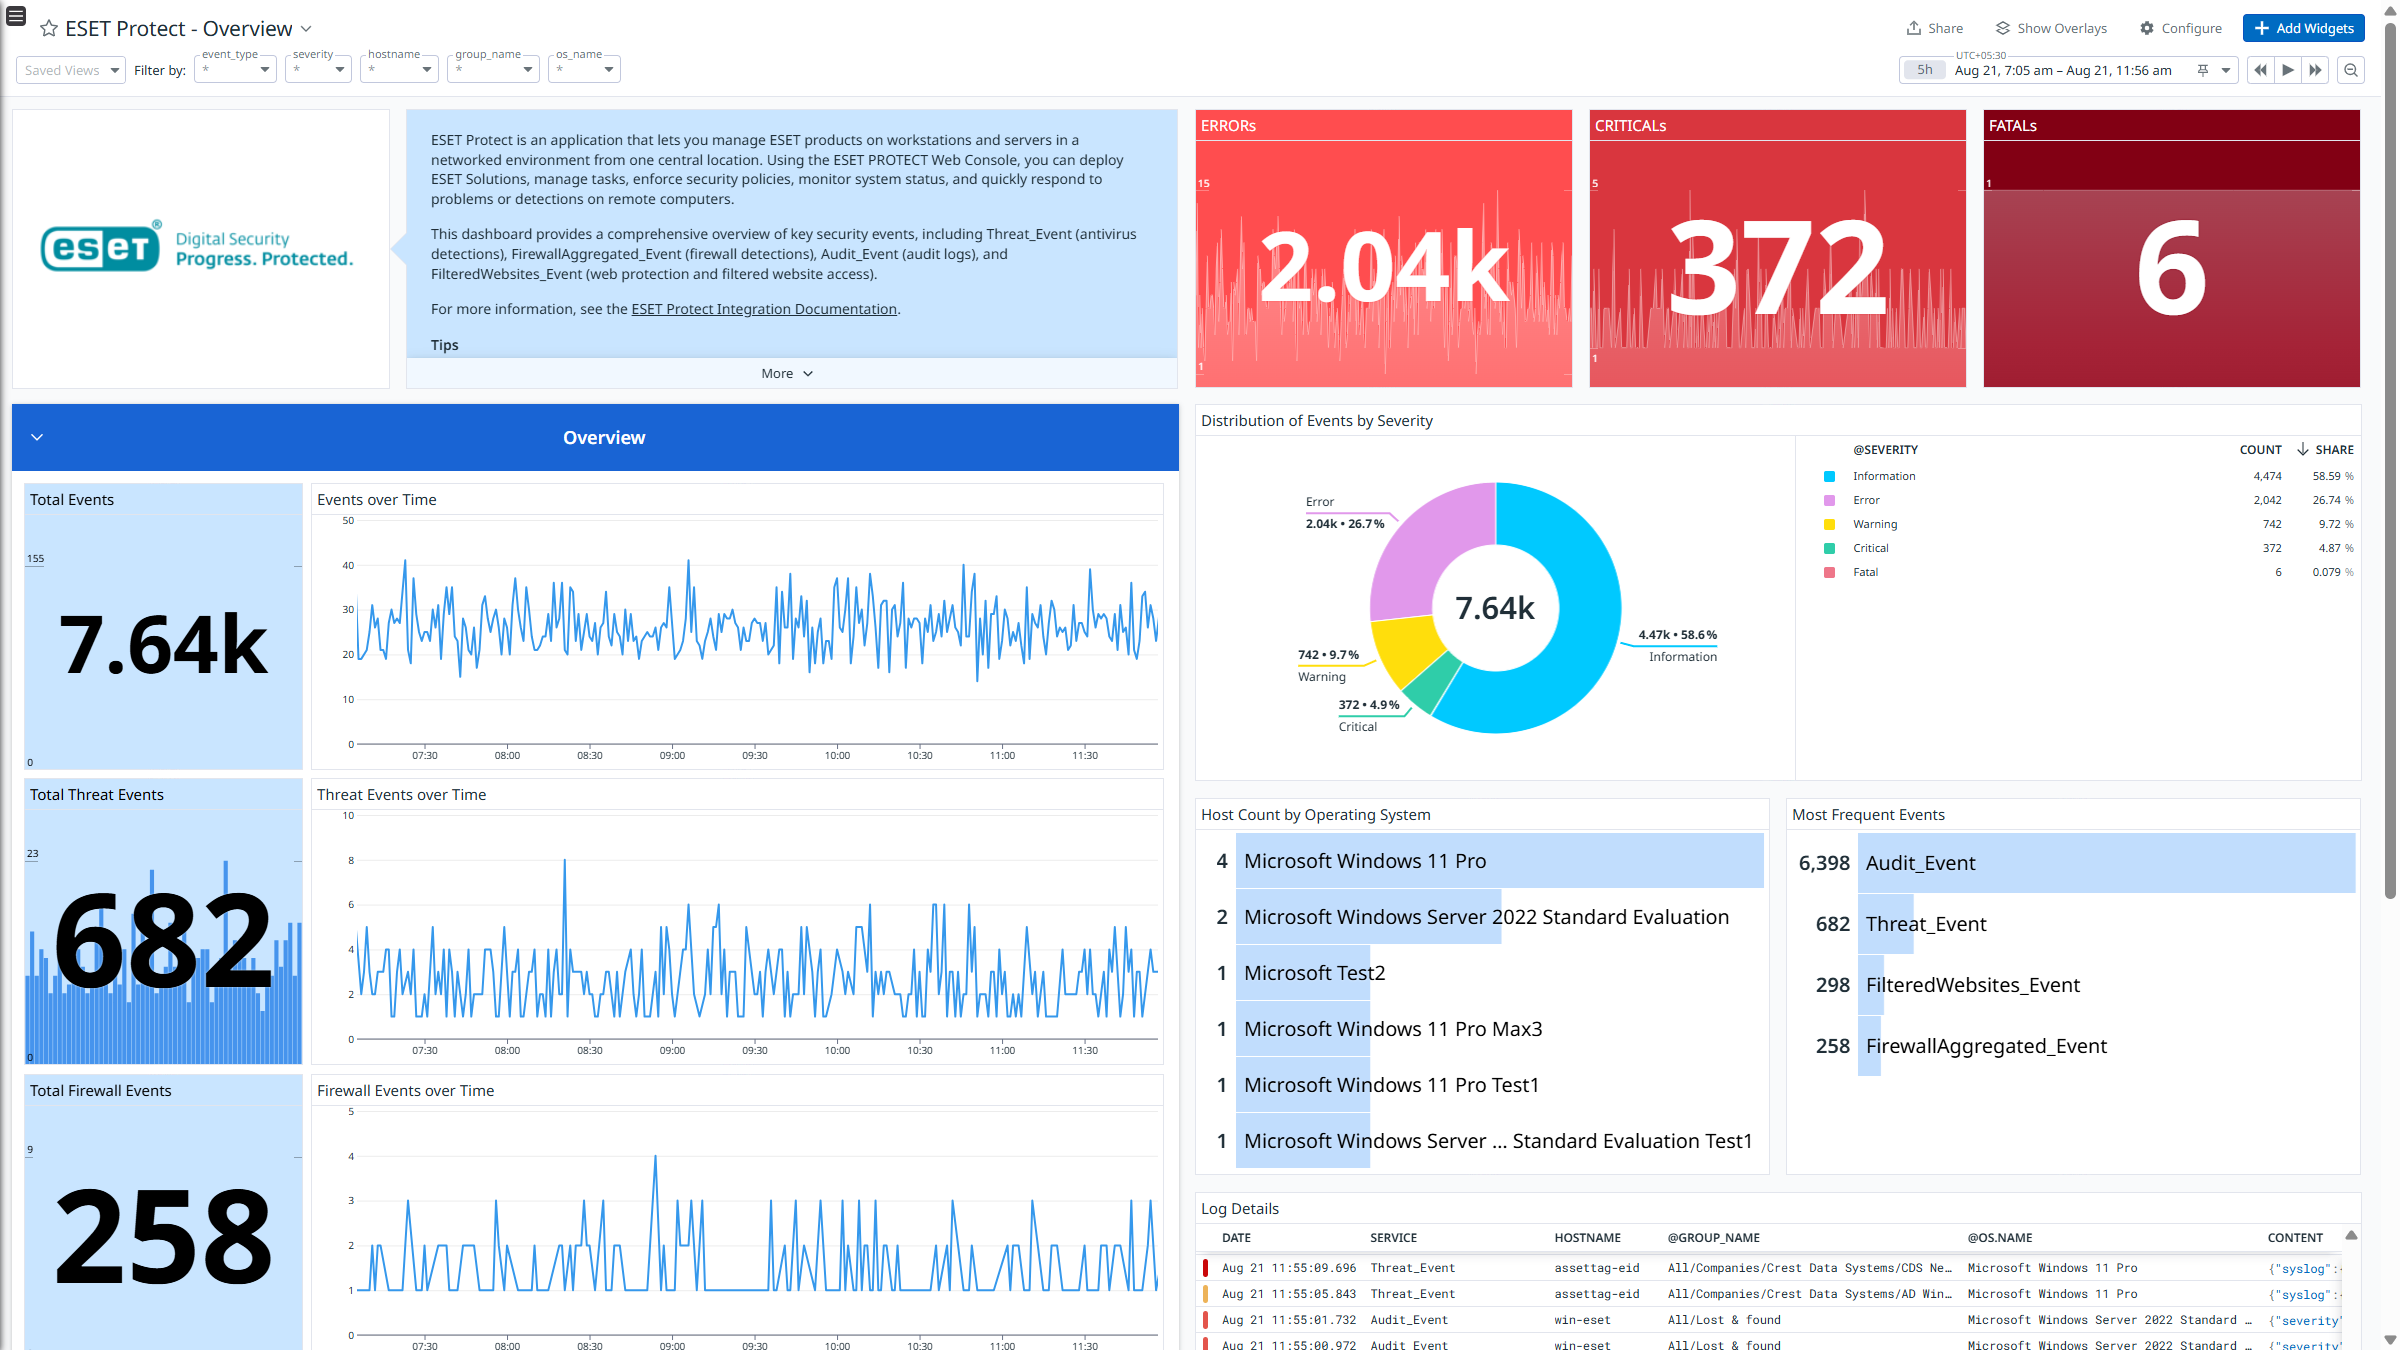
ESET Protect is a central management platform for ESET security solutions, allowing users to manage security across various devices and platforms from one console. Using the ESET Protect Web Console, you can deploy ESET Solutions, manage tasks, enforce security policies, monitor system status, and quickly respond to problems or detections on remote computers.
This integration enriches and ingests the following logs:
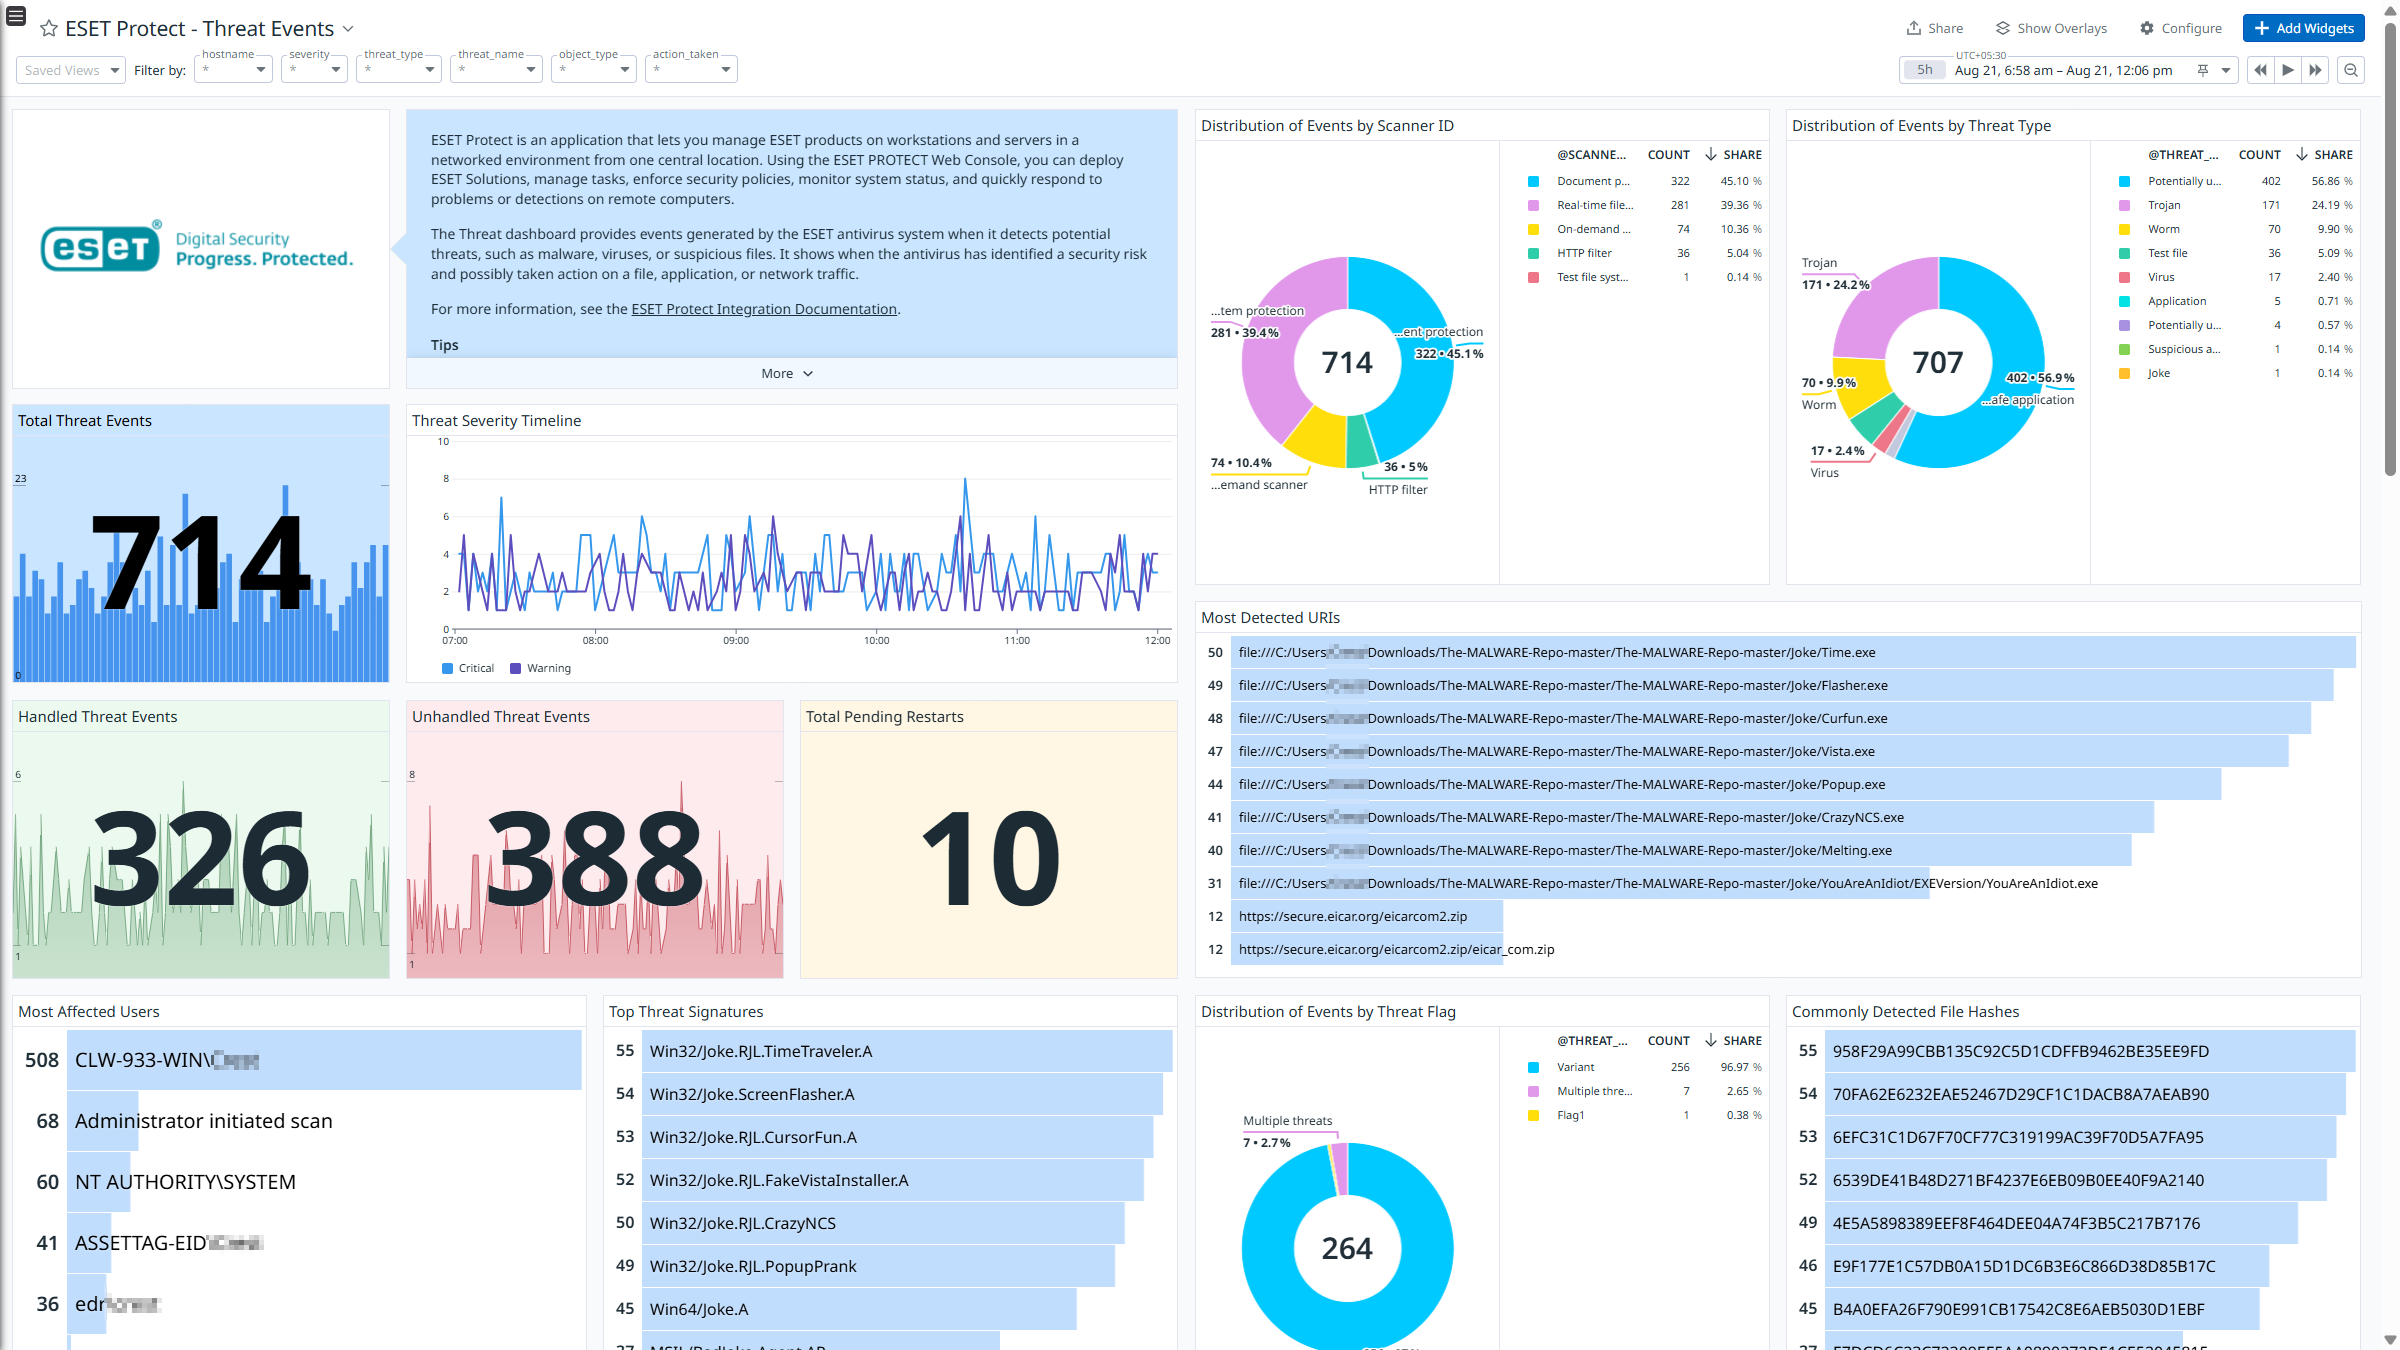
- Threat_Event: Records detections involving identified security threats like malware, viruses, and suspicious behavior. It includes information on the threat type, its location, and the response or action performed.
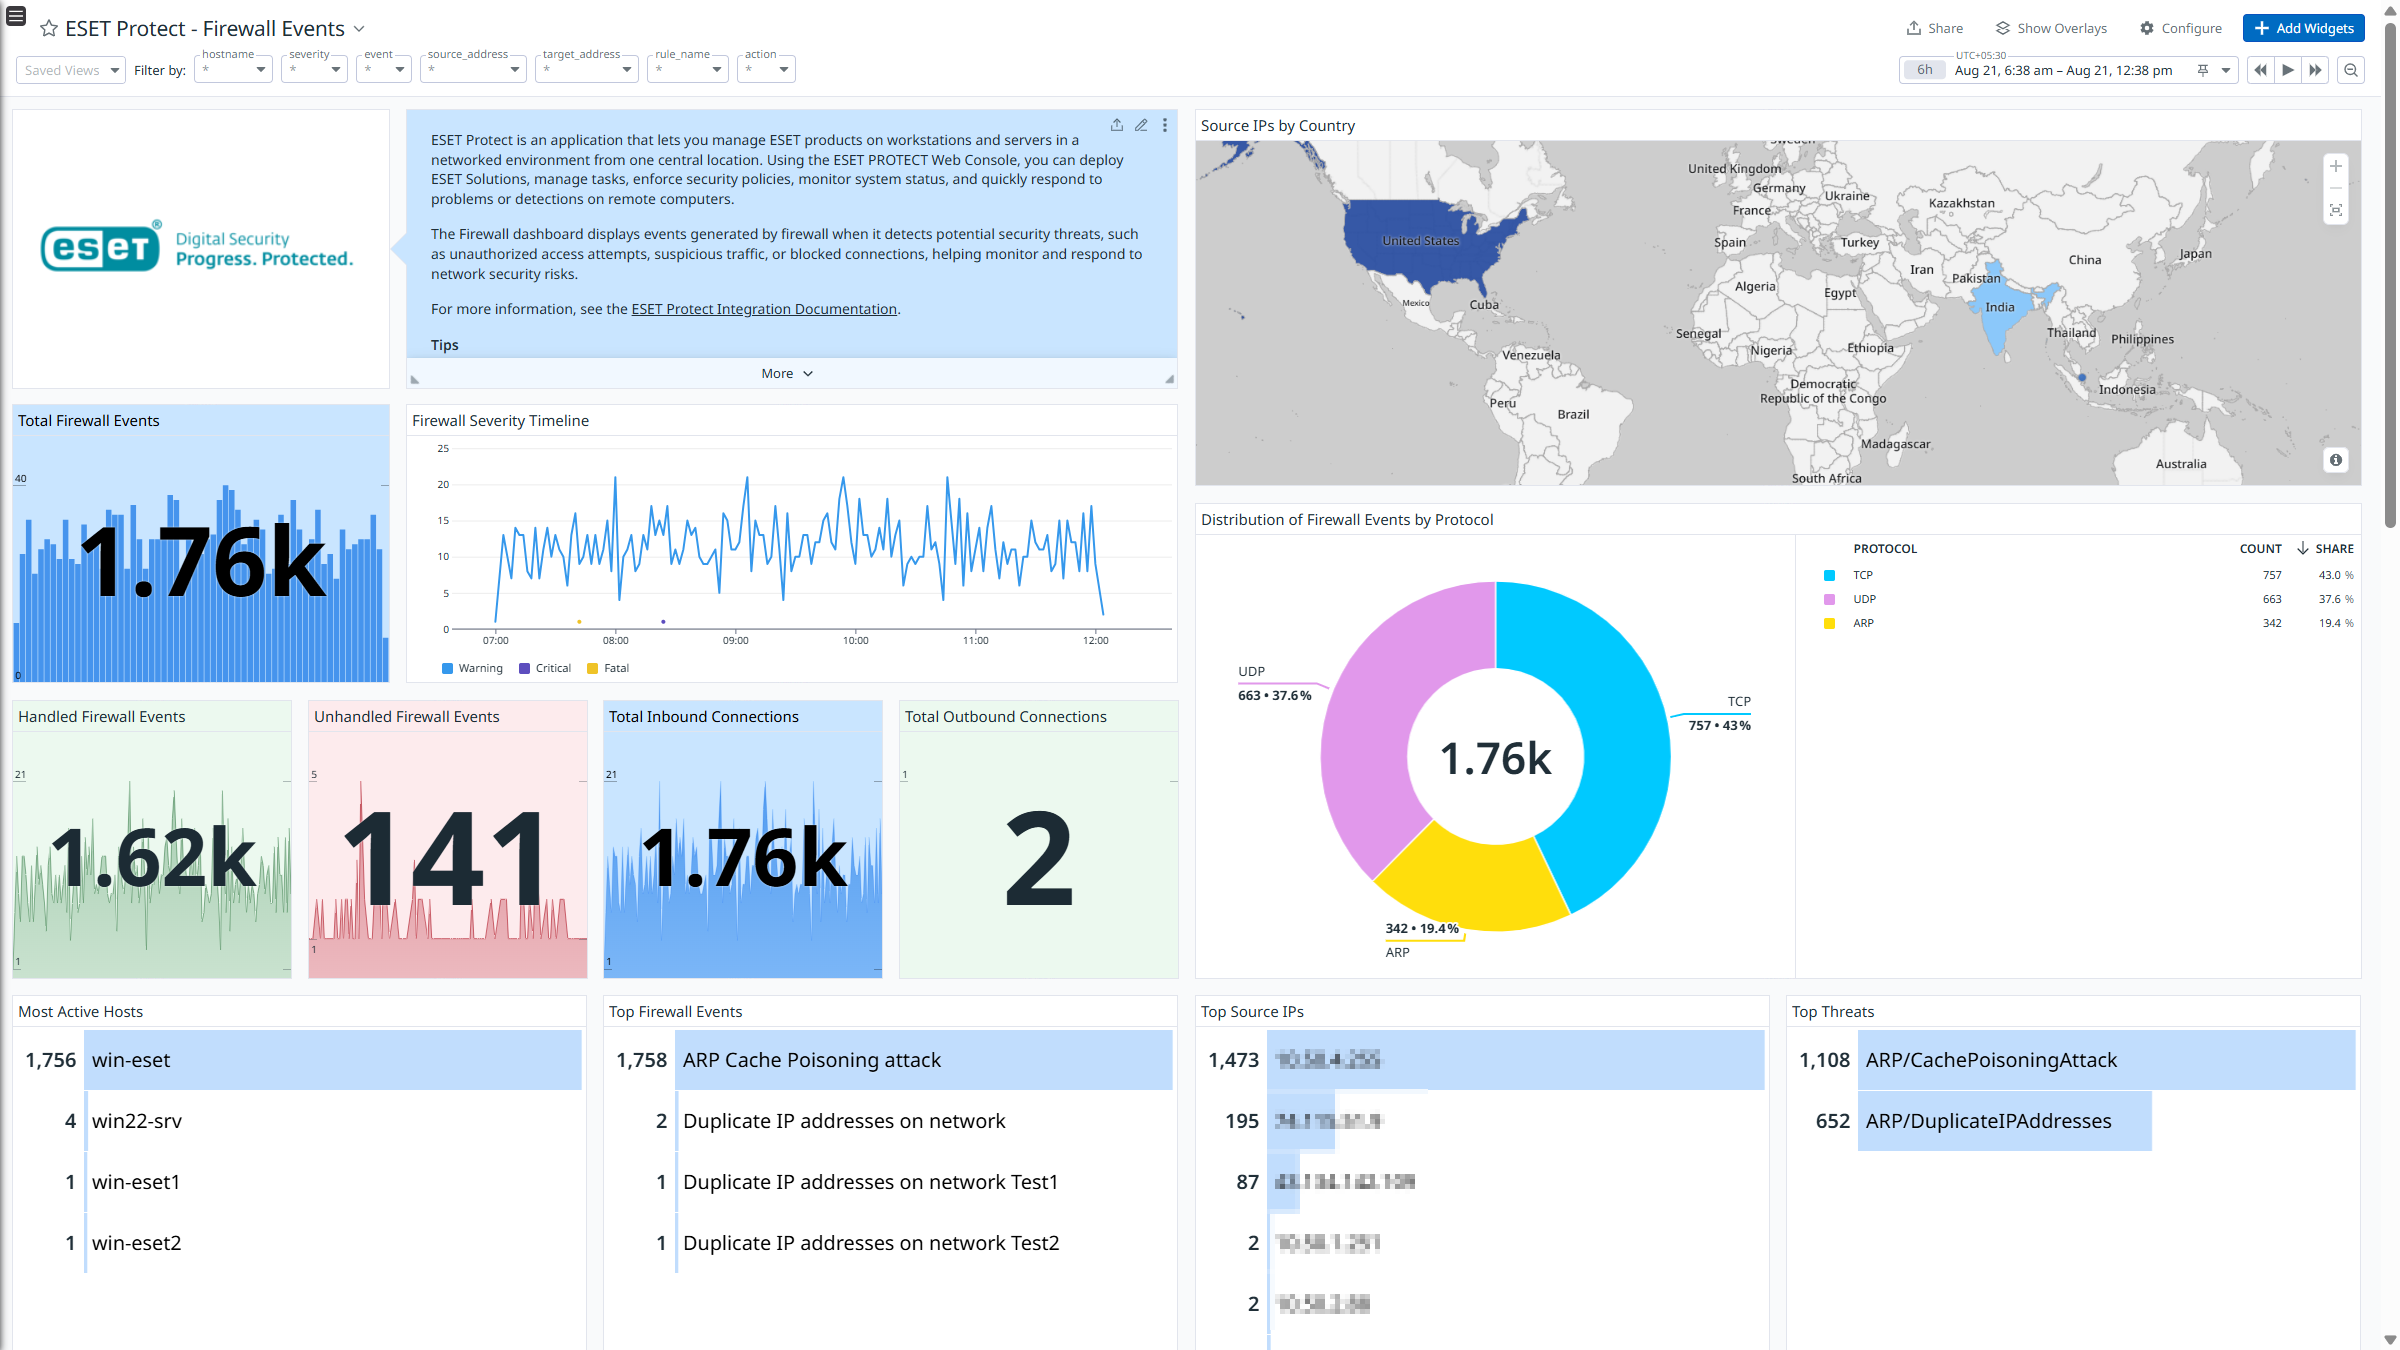
- FirewallAggregated_Event: Records network traffic filtered by the firewall, including blocked or allowed connections. It tracks protocols, IP addresses, ports, and the status of network connections.
- FilteredWebsites_Event: Records website access attempts blocked by the web filtering feature based on security or policy rules. It includes details about the website category and the action taken (allowed or blocked).
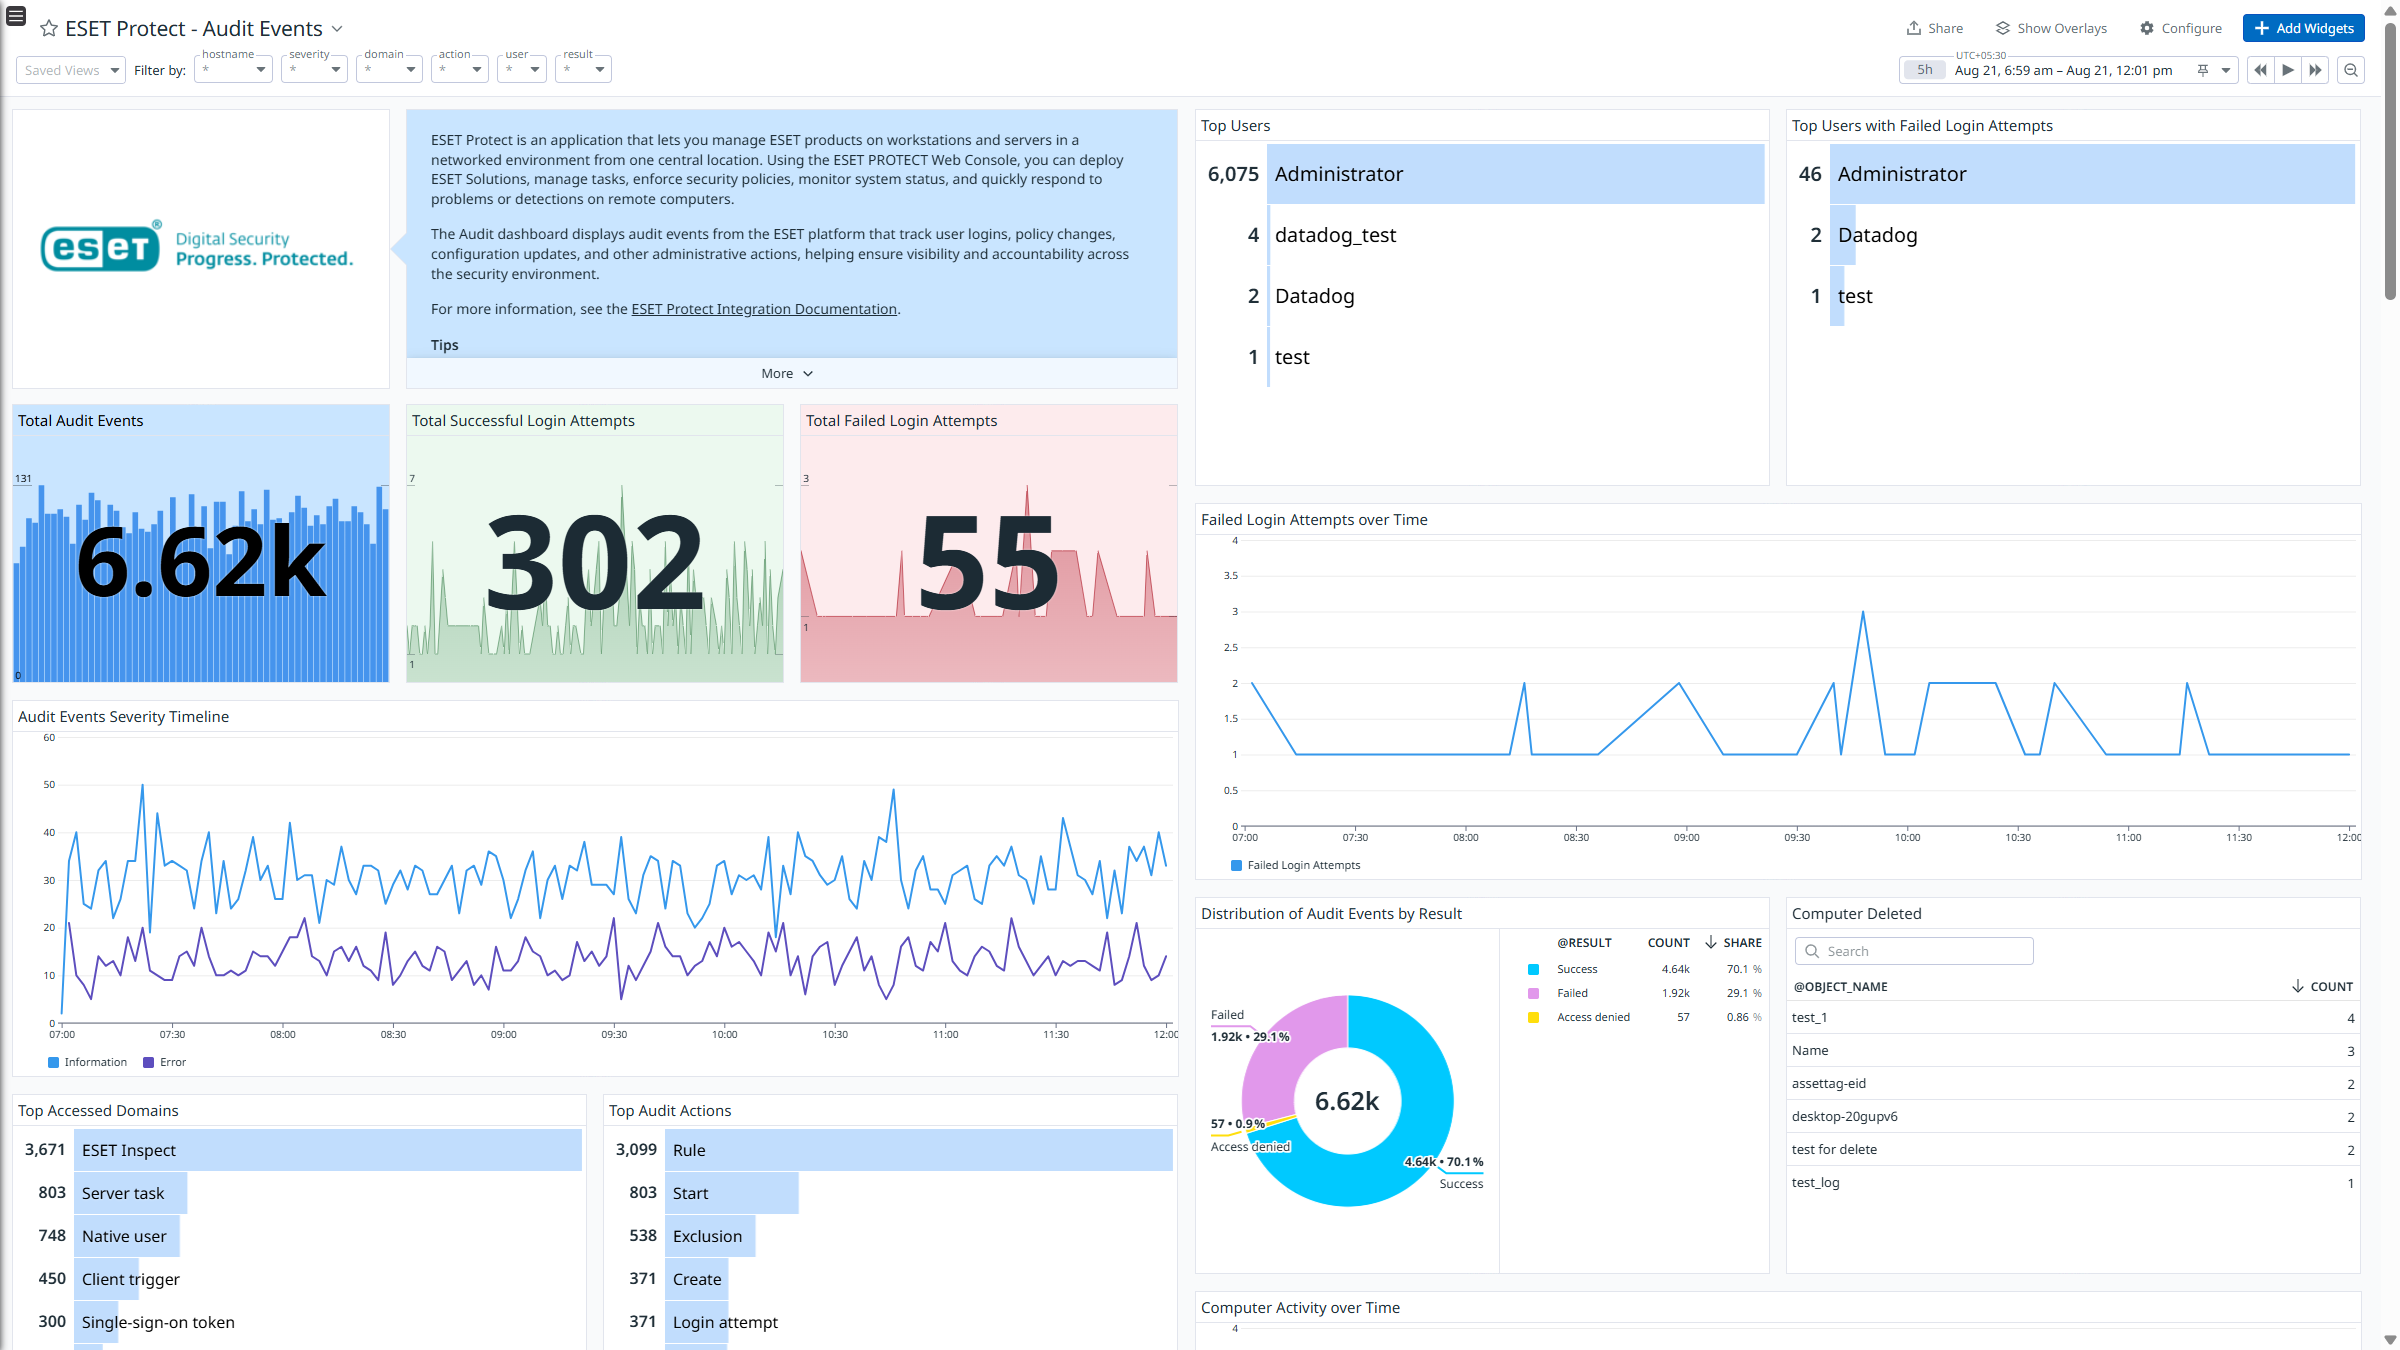
- Audit_Event: Records user or system actions within the management console for auditing and accountability, such as configuration changes, logins, or task executions.
After it collects the logs, ESET Protect channels them into Datadog for analysis. Using the built-in logs pipeline, these logs are parsed and enriched, allowing for effortless search and analysis. The integration provides insights into ESET Protect logs through out-of-the-box dashboards and includes ready-to-use Cloud SIEM detection rules for improved monitoring and security.
Minimum Agent version: 7.68.0
Setup
Installation
To install the ESET Protect integration, run the following Agent installation command. Afterward, follow the steps in the configuration section to set up log collection. For more information, see the Integration Management documentation.
Note: This step is not necessary for Agent version >= 7.68.0.
Linux command:
sudo -u dd-agent -- datadog-agent integration install datadog-eset-protect==1.0.0
Configuration
Log collection
Collecting logs is disabled by default in the Datadog Agent. Enable it in the datadog.yaml file:
Add this configuration block to your eset_protect.d/conf.yaml file to start collecting your ESET Protect logs.
   logs:
    - type: tcp/udp
      port: <PORT>
      source: eset-protect
For available configuration options, see the sample eset_protect.d/conf.yaml. Choose the appropriate protocol (either TCP or UDP) based on your ESET Protect syslog forwarding configuration.
Note: Do not change the source values, as this parameter is integral to the pipeline’s operation.
Restart the Agent.
- Log in to the ESET Protect web console.
- Navigate to More > Settings > Advanced Settings > Syslog Server and click the toggle next to Use Syslog server.
- Specify the following mandatory settings:
- Host: Provide IP address or hostname of the destination for Syslog messages.
- Port: Provide port number.
- Format: Select Syslog.
- Transport: Select Protocol for sending messages to Syslog (TCP or UDP).
- Scroll down to Logging and enable the Export logs to Syslog toggle.
- Select JSON from the Exported logs format dropdown.
- Click Save.
Validation
Run the Agent’s status subcommand and look for eset_protect under the Checks section.
Data Collected
Logs
The ESET Protect integration collects Threat_Event, FirewallAggregated_Event, FilteredWebsites_Event, and Audit_Event logs.
Metrics
The ESET Protect integration does not include any metrics.
Events
The ESET Protect integration does not include any events.
Troubleshooting
Permission denied while port binding
If you see a Permission denied error while port binding in the Agent logs, see the following instructions:
Binding to a port number under 1024 requires elevated permissions. Grant access to the port using the setcap command:
Grant access to the port using the setcap command:
sudo setcap CAP_NET_BIND_SERVICE=+ep /opt/datadog-agent/bin/agent/agent
Verify the setup is correct by running the getcap command:
sudo getcap /opt/datadog-agent/bin/agent/agent
With the expected output:
/opt/datadog-agent/bin/agent/agent = cap_net_bind_service+ep
Note: Re-run this setcap command every time you upgrade the Agent.
Restart the Agent.
Data is not being collected
Make sure that traffic is bypassed from the configured port if the firewall is enabled.
Port already in use
If you see the Port <PORT-NO> Already in Use error, see the following instructions. The example below is for a PORT-NO value of 514:
On systems using Syslog, if the Agent listens for ESET Protect logs on port 514, the following error can appear in the Agent logs:
Can't start UDP forwarder on port 514: listen udp :514: bind: address already in use.
By default, Syslog listens on port 514. To resolve this error, take one of the following steps:
- Disable Syslog.
- Configure the Agent to listen on a different, available port.
Need help? Contact Datadog support.