概要
このインテグレーションは、Datadog Agent を通じて Cloudera Data Platform をモニタリングし、Cloudera Data Hub クラスター、ホスト、ロールの健全性に関するメトリクスとサービスチェックを送信できるようにします。
セットアップ
ホストで実行されている Agent 用にこのチェックをインストールおよび構成する場合は、以下の手順に従ってください。コンテナ環境の場合は、オートディスカバリーのインテグレーションテンプレートのガイドを参照してこの手順を行ってください。
インストール
Cloudera チェックは Datadog Agent パッケージに含まれています。
サーバーに追加でインストールする必要はありません。
構成
要件
The Cloudera check requires version 7 of Cloudera Manager.
Prepare Cloudera Manager
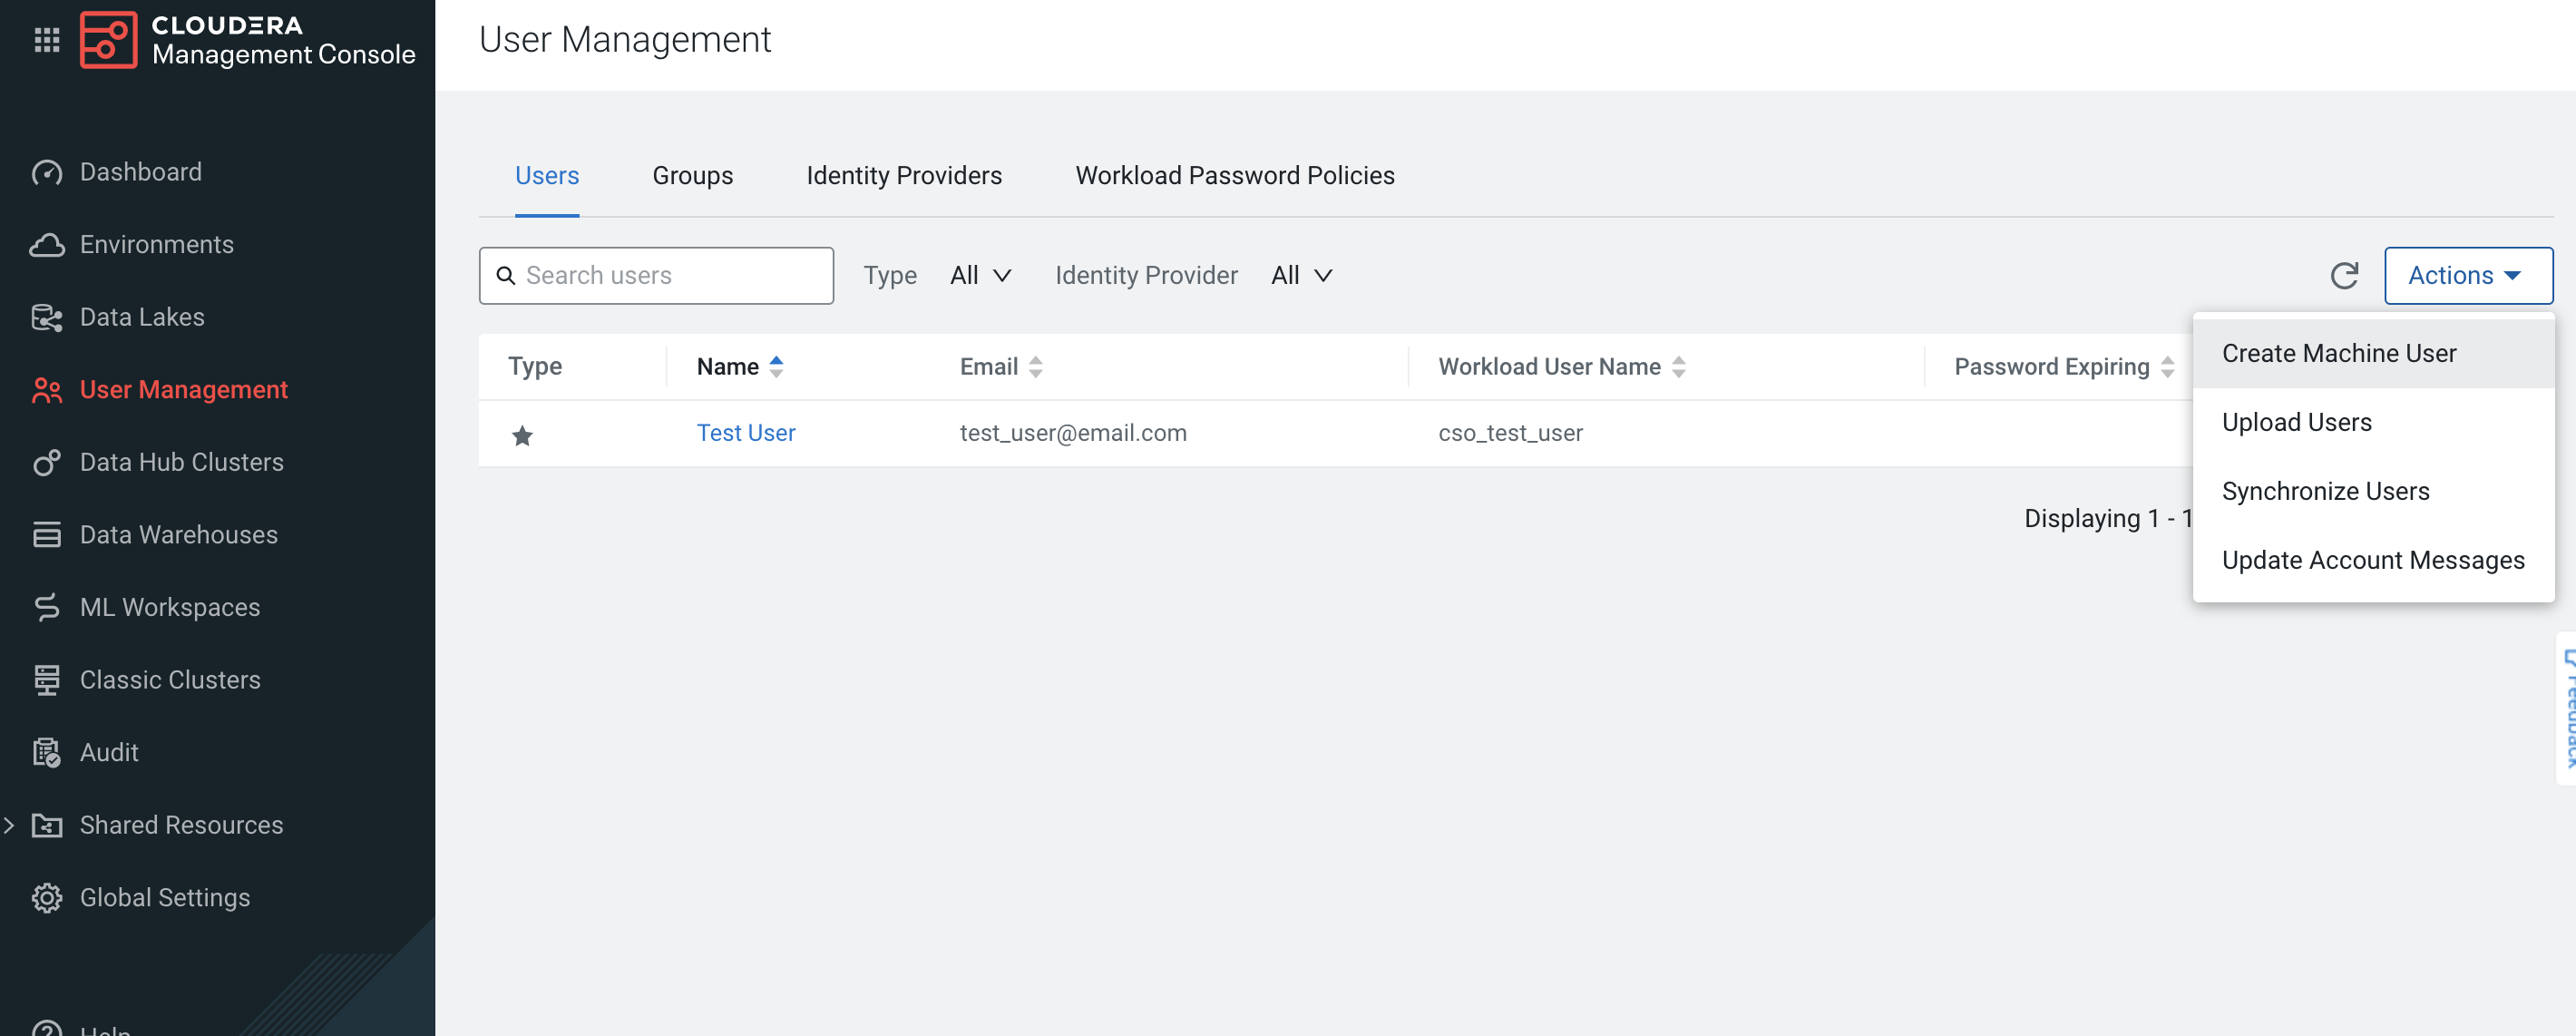
Cloudera Data Platform で、Management Console に移動し、User Management タブをクリックします。
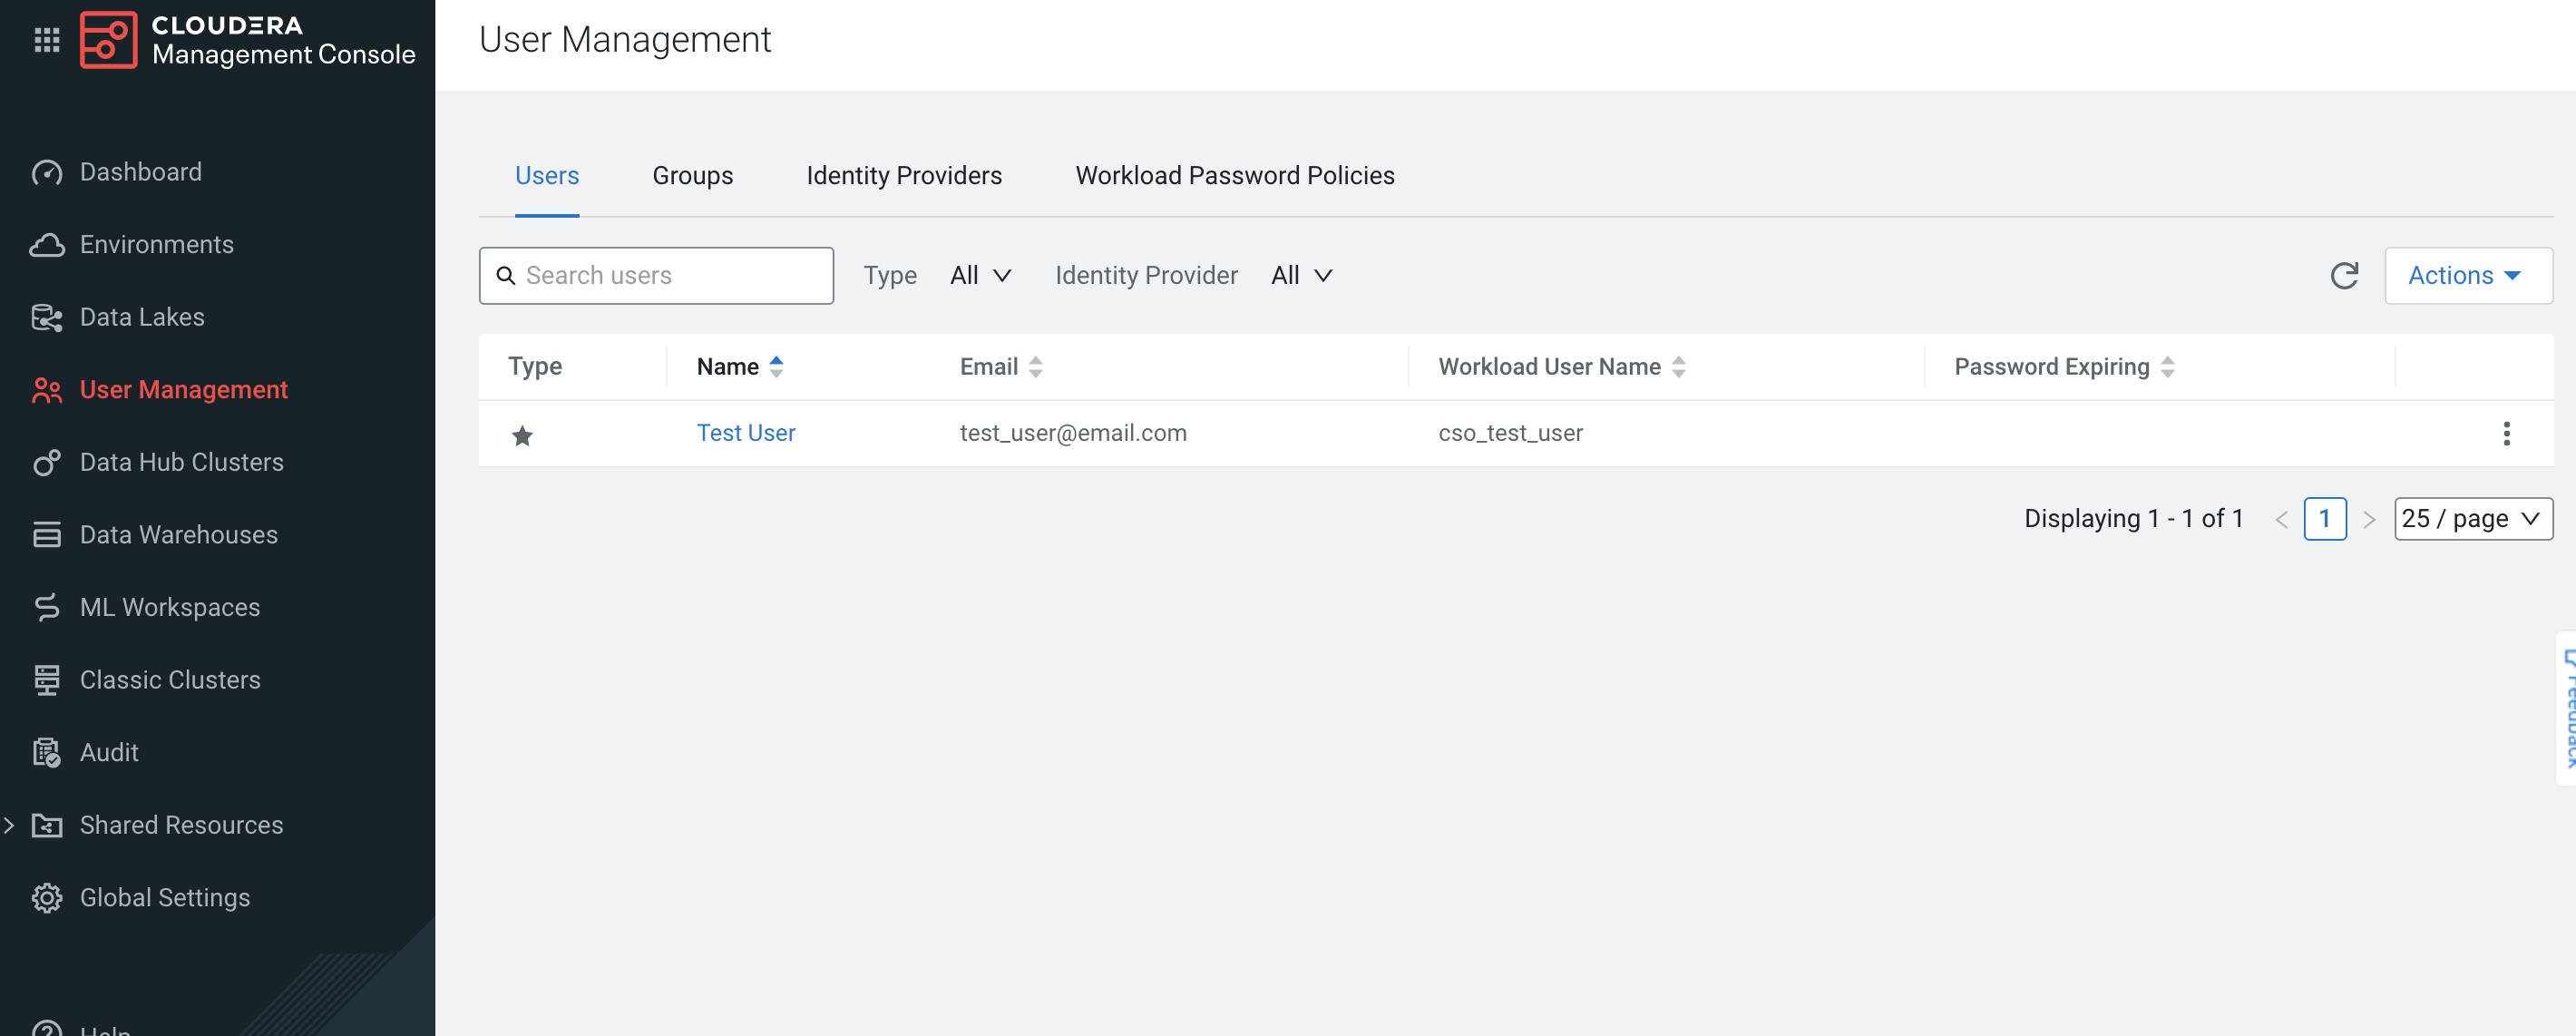
Actions、Create Machine User の順にクリックし、Datadog Agent を通じて Cloudera Manager にクエリを行うマシンユーザーを作成します。
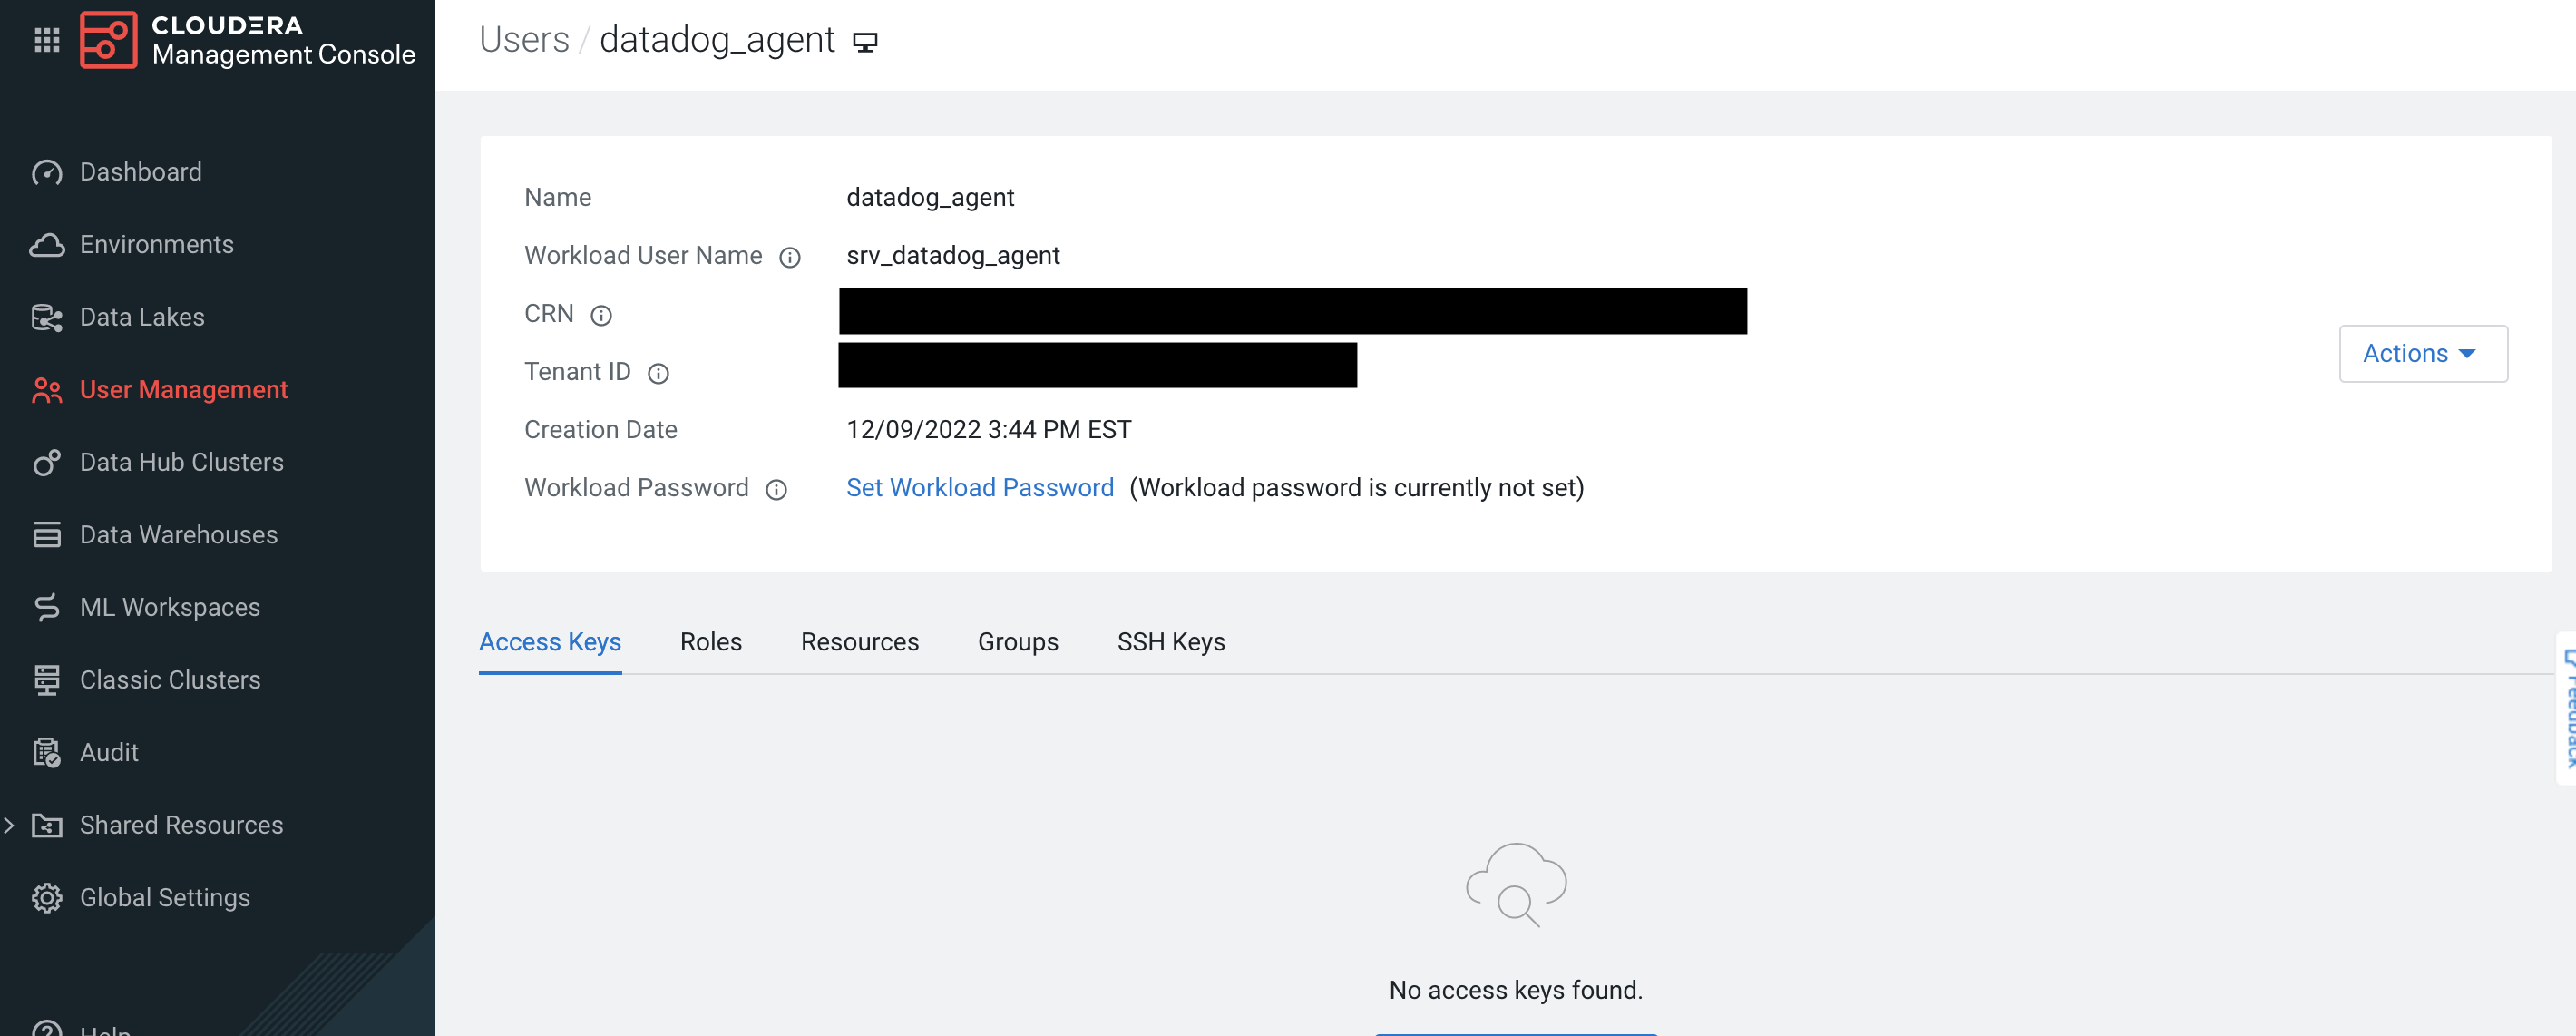
ワークロードパスワードが設定されていない場合は、ユーザー作成後、Set Workload Password をクリックしてください。
ホスト
Cloudera クラスターとホストのデータの収集を開始するには、Agent のコンフィギュレーションディレクトリのルートにある conf.d/ フォルダーの cloudera.d/conf.yaml ファイルを編集します。使用可能なすべてのコンフィギュレーションオプションの詳細については、cloudera.d/conf.yaml のサンプルを参照してください。
注: api_urlの末尾には、API バージョンを記述する必要があります。
init_config:

   ## @param workload_username - string - required
   ## The Workload username. This value can be found in the `User Management` tab of the Management
   ## Console in the `Workload User Name`.
   #
   workload_username: <WORKLOAD_USERNAME>

   ## @param workload_password - string - required
   ## The Workload password. This value can be found in the `User Management` tab of the Management
   ## Console in the `Workload Password`.
   #
   workload_password: <WORKLOAD_PASSWORD>

## Every instance is scheduled independently of the others.
#
instances:

   ## @param api_url - string - required
   ## The URL endpoint for the Cloudera Manager API. This can be found under the Endpoints tab for
   ## your Data Hub to monitor.
   ##
   ## Note: The version of the Cloudera Manager API needs to be appended at the end of the URL.
   ## For example, using v48 of the API for Data Hub `cluster_1` should result with a URL similar
   ## to the following:
   ## `https://cluster1.cloudera.site/cluster_1/cdp-proxy-api/cm-api/v48`
   #
   - api_url: <API_URL>
Agent を再起動すると、Cloudera Data Hub クラスターデータの収集と Datadog への送信を開始します。
コンテナ化
コンテナ環境の場合は、オートディスカバリーのインテグレーションテンプレートのガイドを参照して、次のパラメーターを適用してください。
| パラメーター | 値 |
|---|
<INTEGRATION_NAME> | cloudera |
<INIT_CONFIG> | {"workload_username": "<WORKLOAD_USERNAME>", 'workload_password": "<WORKLOAD_PASSWORD>"} |
<INSTANCE_CONFIG> | {"api_url": <API_URL>"} |
クラスターの検出
クラスターの検出方法は、clusters 構成オプションで以下のパラメーターで設定することができます。
limit
: 自動検出するアイテムの最大数。
デフォルト値: None (全クラスターが処理されます)
include
: 正規表現キーとコンポーネント設定値の自動検出へのマッピング。
デフォルト値: empty map
exclude
: 自動検出から除外するコンポーネントのパターンを持つ正規表現のリスト。
デフォルト値: empty list
interval
: エンドポイントを通じて取得した最後のクラスター一覧の有効時間 (秒)。
デフォルト値: None (キャッシュを使用しない)
例:
my_cluster で始まる名前のクラスターを最大 5 まで処理します。
clusters:
  limit: 5
  include:
    - 'my_cluster.*'
最大 20 のクラスターを処理し、tmp_ で始まる名前を持つクラスターを除外します。
clusters:
  limit: 20
  include:
    - '.*'
  exclude:
    - 'tmp_.*'
カスタムクエリ
カスタム時系列クエリを実行することで、デフォルトでは収集されないカスタムメトリクスを収集するように Cloudera インテグレーションを構成することができます。これらのクエリは、tsquery 言語を使用して、Cloudera Manager からデータを取得します。
例:
カスタムタグとして cloudera_jvm を使用して、JVM ガベージコレクションレートと JVM フリーメモリを収集します。
custom_queries:
- query: select last(jvm_gc_rate) as jvm_gc_rate, last(jvm_free_memory) as jvm_free_memory
  tags: cloudera_jvm
注: これらのクエリはメトリクス表現を利用することができ、total_cpu_user + total_cpu_system、1000 * jvm_gc_time_ms / jvm_gc_count および max(total_cpu_user) などのクエリを作成します。メトリクス式を使用する場合、メトリクスのエイリアスも含めるようにしてください。そうしないと、メトリクス名が正しくフォーマットされないことがあります。例えば、SELECT last(jvm_gc_count) は cloudera.<CATEGORY>.last_jvm_gc_count というメトリクスを生成します。次の例のようにエイリアスを追加することができます: SELECT last(jvm_gc_count) as jvm_gc_count で cloudera.<CATEGORY>.jvm_gc_count というメトリクスが生成されます。
検証
Agent の status サブコマンドを実行し、Checks セクションの cloudera を探します。
収集データ
メトリクス
| |
|---|
cloudera.cluster.cpu_percent_across_hosts
(gauge) | Percent of the Host CPU Usage metric computed across all this entity’s descendant Host entities
Shown as percent |
cloudera.cluster.total_bytes_receive_rate_across_network_interfaces
(gauge) | The sum of the Bytes Received metric computed across all this entity’s descendant Network Interface entities
Shown as byte |
cloudera.cluster.total_bytes_transmit_rate_across_network_interfaces
(gauge) | The sum of the Bytes Transmitted metric computed across all this entity’s descendant Network Interface entities
Shown as byte |
cloudera.cluster.total_read_bytes_rate_across_disks
(gauge) | The sum of the Disk Bytes Read metric computed across all this entity’s descendant Disk entities
Shown as byte |
cloudera.cluster.total_write_bytes_rate_across_disks
(gauge) | The sum of the Disk Bytes Written metric computed across all this entity’s descendant Disk entities
Shown as byte |
cloudera.disk.await_read_time
(gauge) | The average disk await read time of the entity
Shown as millisecond |
cloudera.disk.await_time
(gauge) | The average disk await time of the entity
Shown as millisecond |
cloudera.disk.await_write_time
(gauge) | The average disk await write time of the entity
Shown as millisecond |
cloudera.disk.service_time
(gauge) | The average disk service time of the entity
Shown as millisecond |
cloudera.host.alerts_rate
(gauge) | The number of alerts per second
Shown as event |
cloudera.host.cpu_iowait_rate
(gauge) | Total CPU iowait time |
cloudera.host.cpu_irq_rate
(gauge) | Total CPU IRQ time |
cloudera.host.cpu_nice_rate
(gauge) | Total CPU nice time |
cloudera.host.cpu_soft_irq_rate
(gauge) | Total CPU soft IRQ time |
cloudera.host.cpu_steal_rate
(gauge) | Stolen time, which is the time spent in other operating systems when running in a virtualized environment |
cloudera.host.cpu_system_rate
(gauge) | Total System CPU |
cloudera.host.cpu_user_rate
(gauge) | Total CPU user time |
cloudera.host.events_critical_rate
(gauge) | The number of critical events |
cloudera.host.events_important_rate
(gauge) | The number of important events |
cloudera.host.health_bad_rate
(gauge) | Percentage of Time with Bad Health |
cloudera.host.health_concerning_rate
(gauge) | Percentage of Time with Concerning Health |
cloudera.host.health_disabled_rate
(gauge) | Percentage of Time with Disabled Health |
cloudera.host.health_good_rate
(gauge) | Percentage of Time with Good Health |
cloudera.host.health_unknown_rate
(gauge) | Percentage of Time with Unknown Health |
cloudera.host.load_1
(gauge) | Load Average over 1 minute |
cloudera.host.load_15
(gauge) | Load Average over 15 minutes |
cloudera.host.load_5
(gauge) | Load Average over 5 minutes |
cloudera.host.num_cores
(gauge) | Total number of cores |
cloudera.host.num_physical_cores
(gauge) | Total number of physical cores |
cloudera.host.physical_memory_buffers
(gauge) | The amount of physical memory devoted to temporary storage for raw disk blocks
Shown as byte |
cloudera.host.physical_memory_cached
(gauge) | The amount of physical memory used for files read from the disk. This is commonly referred to as the pagecache
Shown as byte |
cloudera.host.physical_memory_total
(gauge) | The total physical memory available
Shown as byte |
cloudera.host.physical_memory_used
(gauge) | The total amount of memory being used, excluding buffers and cache
Shown as byte |
cloudera.host.swap_out_rate
(gauge) | Memory swapped out to disk
Shown as page |
cloudera.host.swap_used
(gauge) | Swap used
Shown as byte |
cloudera.host.total_bytes_receive_rate_across_network_interfaces
(gauge) | The sum of the Bytes Received metric computed across all this entity’s descendant Network Interface entities
Shown as byte |
cloudera.host.total_bytes_transmit_rate_across_network_interfaces
(gauge) | The sum of the Bytes Transmitted metric computed across all this entity’s descendant Network Interface entities
Shown as byte |
cloudera.host.total_phys_mem_bytes
(gauge) | Total physical memory in bytes
Shown as byte |
cloudera.host.total_read_bytes_rate_across_disks
(gauge) | The sum of the Disk Bytes Read metric computed across all this entity’s descendant Disk entities
Shown as byte |
cloudera.host.total_read_ios_rate_across_disks
(gauge) | The sum of the Disk Reads metric computed across all this entity’s descendant Disk entities
Shown as operation |
cloudera.host.total_write_bytes_rate_across_disks
(gauge) | The sum of the Disk Bytes Written metric computed across all this entity’s descendant Disk entities
Shown as byte |
cloudera.host.total_write_ios_rate_across_disks
(gauge) | The sum of the Disk Writes metric computed across all this entity’s descendant Disk entities
Shown as operation |
cloudera.role.cpu_system_rate
(gauge) | Total System CPU |
cloudera.role.cpu_user_rate
(gauge) | Total CPU user time |
cloudera.role.mem_rss
(gauge) | Resident memory used
Shown as byte |
イベント
Cloudera インテグレーションは、Cloudera Manager API の /events エンドポイントから発行されるイベントを収集します。イベントレベルは以下のようにマッピングされます。
| Cloudera | Datadog |
|---|
UNKNOWN | error |
INFORMATIONAL | info |
IMPORTANT | info |
CRITICAL | error |
サービスチェック
cloudera.can_connect
Returns OK if the check is able to connect to the Cloudera Manager API and collect metrics, CRITICAL otherwise.
Statuses: ok, critical
cloudera.cluster.health
Returns OK if the cluster is in good health or is starting, WARNING if the cluster is stopping or the health is concerning, CRITICAL if the cluster is down or in bad health, and UNKNOWN otherwise.
Statuses: ok, critical, warning, unknown
cloudera.host.health
Returns OK if the host is in good health or is starting, WARNING if the host is stopping or the health is concerning, CRITICAL if the host is down or in bad health, and UNKNOWN otherwise.
Statuses: ok, critical, warning, unknown
トラブルシューティング
Cloudera ホスト上の Datadog インテグレーションのメトリクスを収集する
Cloudera ホストに Datadog Agent をインストールするには、ホストに関連付けられたセキュリティグループが SSH アクセスを許可していることを確認します。
そして、環境作成時に生成した SSH キーでホストにアクセスする際に、ルートユーザー cloudbreak を使用する必要があります。
sudo ssh -i "/path/to/key.pem" cloudbreak@<HOST_IP_ADDRESS>
ワークロードのユーザー名とパスワードは、SSH で Cloudera ホストにアクセスするために使用できますが、Datadog Agent をインストールできるのは cloudbreak ユーザーだけです。
cloudbreak 以外のユーザーを使用しようとすると、以下のようなエラーが発生する可能性があります。
<NON_CLOUDBREAK_USER> is not allowed to run sudo on <CLOUDERA_HOSTNAME>. This incident will be reported.
Datadog メトリクス収集時の構成エラー
Cloudera ホストからメトリクスを収集する際に、Agent のステータスに以下のようなものが表示された場合
  Config Errors
  ==============
    zk
    --
      open /etc/datadog-agent/conf.d/zk.d/conf.yaml: permission denied
conf.yaml の所有者を dd-agent に変更する必要があります。
[cloudbreak@<CLOUDERA_HOSTNAME> ~]$ sudo chown -R dd-agent:dd-agent /etc/datadog-agent/conf.d/zk.d/conf.yaml
ご不明な点は、Datadog のサポートチームまでお問合せください。
その他の参考資料
お役に立つドキュメント、リンクや記事: