- 重要な情報
- はじめに
- 用語集
- Standard Attributes
- ガイド
- インテグレーション
- エージェント
- OpenTelemetry
- 開発者
- Administrator's Guide
- API
- Partners
- DDSQL Reference
- モバイルアプリケーション
- CoScreen
- CoTerm
- Remote Configuration
- Cloudcraft
- アプリ内
- ダッシュボード
- ノートブック
- DDSQL Editor
- Reference Tables
- Sheets
- Watchdog
- アラート設定
- メトリクス
- Bits AI
- Internal Developer Portal
- Error Tracking
- Change Tracking
- Service Management
- Actions & Remediations
- インフラストラクチャー
- Cloudcraft
- Resource Catalog
- ユニバーサル サービス モニタリング
- Hosts
- コンテナ
- Processes
- サーバーレス
- ネットワークモニタリング
- Cloud Cost
- アプリケーションパフォーマンス
- APM
- Continuous Profiler
- データベース モニタリング
- Data Streams Monitoring
- Data Jobs Monitoring
- Data Observability
- Digital Experience
- RUM & セッションリプレイ
- Synthetic モニタリング
- Continuous Testing
- Product Analytics
- Software Delivery
- CI Visibility (CI/CDの可視化)
- CD Visibility
- Deployment Gates
- Test Visibility
- Code Coverage
- Quality Gates
- DORA Metrics
- Feature Flags
- セキュリティ
- セキュリティの概要
- Cloud SIEM
- Code Security
- クラウド セキュリティ マネジメント
- Application Security Management
- Workload Protection
- Sensitive Data Scanner
- AI Observability
- ログ管理
- Observability Pipelines(観測データの制御)
- ログ管理
- CloudPrem
- 管理
iOS Crash Reporting and Error Tracking
このページは日本語には対応しておりません。随時翻訳に取り組んでいます。
翻訳に関してご質問やご意見ございましたら、お気軽にご連絡ください。
翻訳に関してご質問やご意見ございましたら、お気軽にご連絡ください。
Overview
Enable iOS Crash Reporting and Error Tracking to get comprehensive crash reports and error trends. With this feature, you can access:
- Aggregated iOS crash dashboards and attributes
- Symbolicated iOS crash reports
- Trend analysis with iOS error tracking
To symbolicate your stack traces, find and upload your .dSYM files to Datadog. Then, verify your configuration by running a test crash and restarting your application.
Your crash reports appear in Error Tracking.
Compatibility
See Supported versions for a list of operating system versions and platforms that are compatible with the iOS SDK.
Setup
To start sending Error Tracking data from your iOS or tvOS application to Datadog:
Step 1 - Declare the iOS SDK as a dependency
Declare the iOS library as a dependency depending on your package manager. Datadog recommends using Swift Package Manager (SPM).
To integrate using Apple’s Swift Package Manager, add the following as a dependency to your Package.swift:
.package(url: "https://github.com/Datadog/dd-sdk-ios.git", .upToNextMajor(from: "3.0.0"))
In your project, link the following libraries:
DatadogCore
DatadogRUM
You can use CocoaPods to install dd-sdk-ios:
pod 'DatadogCore'
pod 'DatadogRUM'
You can use Carthage to install dd-sdk-ios:
github "DataDog/dd-sdk-ios"
Note: Datadog does not provide prebuilt Carthage binaries. This means Carthage builds the SDK from source. To build and integrate the SDK, run:
carthage bootstrap --use-xcframeworks --no-use-binaries
After building, add the following XCFrameworks to your Xcode project (in the “Frameworks, Libraries, and Embedded Content” section):
DatadogInternal.xcframework
DatadogCore.xcframework
DatadogRUM.xcframework
Step 2 - Specify application details in the UI
- Navigate to Error Tracking > Settings > Browser and Mobile.
- Click New Application.
- Enter an application name and select iOS as the application type.
- Click Create Application to generate a unique Datadog application ID and client token.
Step 3 - Initialize the library
Update the initialization snippet
In the initialization snippet, set an environment name and service name.
To ensure the safety of your data, you must use a client token. If you used only Datadog API keys to configure the dd-sdk-ios library, they would be exposed client-side in the iOS application’s byte code.
For more information about setting up a client token, see the Client token documentation.
The SDK should be initialized as early as possible in the app lifecycle, specifically in the AppDelegate’s application(_:didFinishLaunchingWithOptions:) callback. This ensures all measurements, including application startup duration, are captured correctly. For apps built with SwiftUI, you can use @UIApplicationDelegateAdaptor to hook into the AppDelegate.
Initializing the SDK elsewhere (for example, later during view loading) may result in inaccurate or missing telemetry, especially around app startup performance.
For more information, see Using Tags.
import DatadogCore

Datadog.initialize(
  with: Datadog.Configuration(
    clientToken: "<client token>",
    env: "<environment>",
    service: "<service name>"
  ),
  trackingConsent: trackingConsent
)
@import DatadogCore;

DDConfiguration *configuration = [[DDConfiguration alloc] initWithClientToken:@"<client token>" env:@"<environment>"];
configuration.service = @"<service name>";

[DDDatadog initializeWithConfiguration:configuration
                       trackingConsent:trackingConsent];
import DatadogCore

Datadog.initialize(
  with: Datadog.Configuration(
    clientToken: "<client token>",
    env: "<environment>",
    site: .eu1,
    service: "<service name>"
  ),
  trackingConsent: trackingConsent
)
@import DatadogCore;

DDConfiguration *configuration = [[DDConfiguration alloc] initWithClientToken:@"<client token>" env:@"<environment>"];
configuration.service = @"<service name>";
configuration.site = [DDSite eu1];

[DDDatadog initializeWithConfiguration:configuration
                       trackingConsent:trackingConsent];
import DatadogCore

Datadog.initialize(
  with: Datadog.Configuration(
    clientToken: "<client token>",
    env: "<environment>",
    site: .us3,
    service: "<service name>"
  ),
  trackingConsent: trackingConsent
)
@import DatadogCore;

DDConfiguration *configuration = [[DDConfiguration alloc] initWithClientToken:@"<client token>" env:@"<environment>"];
configuration.service = @"<service name>";
configuration.site = [DDSite us3];

[DDDatadog initializeWithConfiguration:configuration
                       trackingConsent:trackingConsent];
import DatadogCore

Datadog.initialize(
  with: Datadog.Configuration(
    clientToken: "<client token>",
    env: "<environment>",
    site: .us5,
    service: "<service name>"
  ),
  trackingConsent: trackingConsent
)
@import DatadogCore;

DDConfiguration *configuration = [[DDConfiguration alloc] initWithClientToken:@"<client token>" env:@"<environment>"];
configuration.service = @"<service name>";
configuration.site = [DDSite us5];

[DDDatadog initializeWithConfiguration:configuration
                       trackingConsent:trackingConsent];
import DatadogCore

Datadog.initialize(
  with: Datadog.Configuration(
    clientToken: "<client token>",
    env: "<environment>",
    site: .us1_fed,
    service: "<service name>"
  ),
  trackingConsent: trackingConsent
)
@import DatadogCore;

DDConfiguration *configuration = [[DDConfiguration alloc] initWithClientToken:@"<client token>" env:@"<environment>"];
configuration.service = @"<service name>";
configuration.site = [DDSite us1_fed];

[DDDatadog initializeWithConfiguration:configuration
                       trackingConsent:trackingConsent];
import DatadogCore

Datadog.initialize(
  with: Datadog.Configuration(
    clientToken: "<client token>",
    env: "<environment>",
    site: .ap1,
    service: "<service name>"
  ),
  trackingConsent: trackingConsent
)
@import DatadogCore;

DDConfiguration *configuration = [[DDConfiguration alloc] initWithClientToken:@"<client token>" env:@"<environment>"];
configuration.service = @"<service name>";
configuration.site = [DDSite ap1];

[DDDatadog initializeWithConfiguration:configuration
                       trackingConsent:trackingConsent];
import DatadogCore

Datadog.initialize(
  with: Datadog.Configuration(
    clientToken: "<client token>",
    env: "<environment>",
    site: .ap2,
    service: "<service name>"
  ),
  trackingConsent: trackingConsent
)
@import DatadogCore;

DDConfiguration *configuration = [[DDConfiguration alloc] initWithClientToken:@"<client token>" env:@"<environment>"];
configuration.service = @"<service name>";
configuration.site = [DDSite ap2];

[DDDatadog initializeWithConfiguration:configuration
                       trackingConsent:trackingConsent];
Instrument your webviews (optional)
Add the DatadogWebViewTracking module using your preferred dependency manager.
To track errors and performance issues within web content, enable webview tracking for your WKWebView instances. This allows you to monitor JavaScript errors, network requests, and user interactions that occur within embedded web pages, giving you complete visibility into your hybrid app’s web components.
Specify which hosts to track by providing a list of domains. Only web content from the specified hosts are monitored and reported to Datadog.
import DatadogWebViewTracking

let webview = WKWebView(...)

// start tracking webviews
WebViewTracking.enable(webView: webview, hosts: ["foo.bar"])

//stop tracking webviews (after the user stops navigating the web page)
WebViewTracking.disable(webView: webview)
For more information, see Web View Tracking.
Step 4 - Add crash reporting
Crash reporting captures fatal crashes when your app terminates unexpectedly, in addition to the errors that Error Tracking displays in a unified interface.
To enable crash reporting, add the package according to your dependency manager and update your initialization snippet.
To integrate using Apple’s Swift Package Manager, add the following as a dependency to your Package.swift:
.package(url: "https://github.com/Datadog/dd-sdk-ios.git", .upToNextMajor(from: "3.0.0"))
In your project, link the following libraries:
DatadogCrashReporting
You can use CocoaPods to install dd-sdk-ios:
pod 'DatadogCrashReporting'
You can use Carthage to install dd-sdk-ios:
github "DataDog/dd-sdk-ios"
In Xcode, link the following frameworks:
DatadogCrashReporting.xcframework
Update your initialization snippet to include Crash Reporting:
import DatadogCore
import DatadogCrashReporting

Datadog.initialize(...)

CrashReporting.enable()
Step 5 - Add app hang reporting
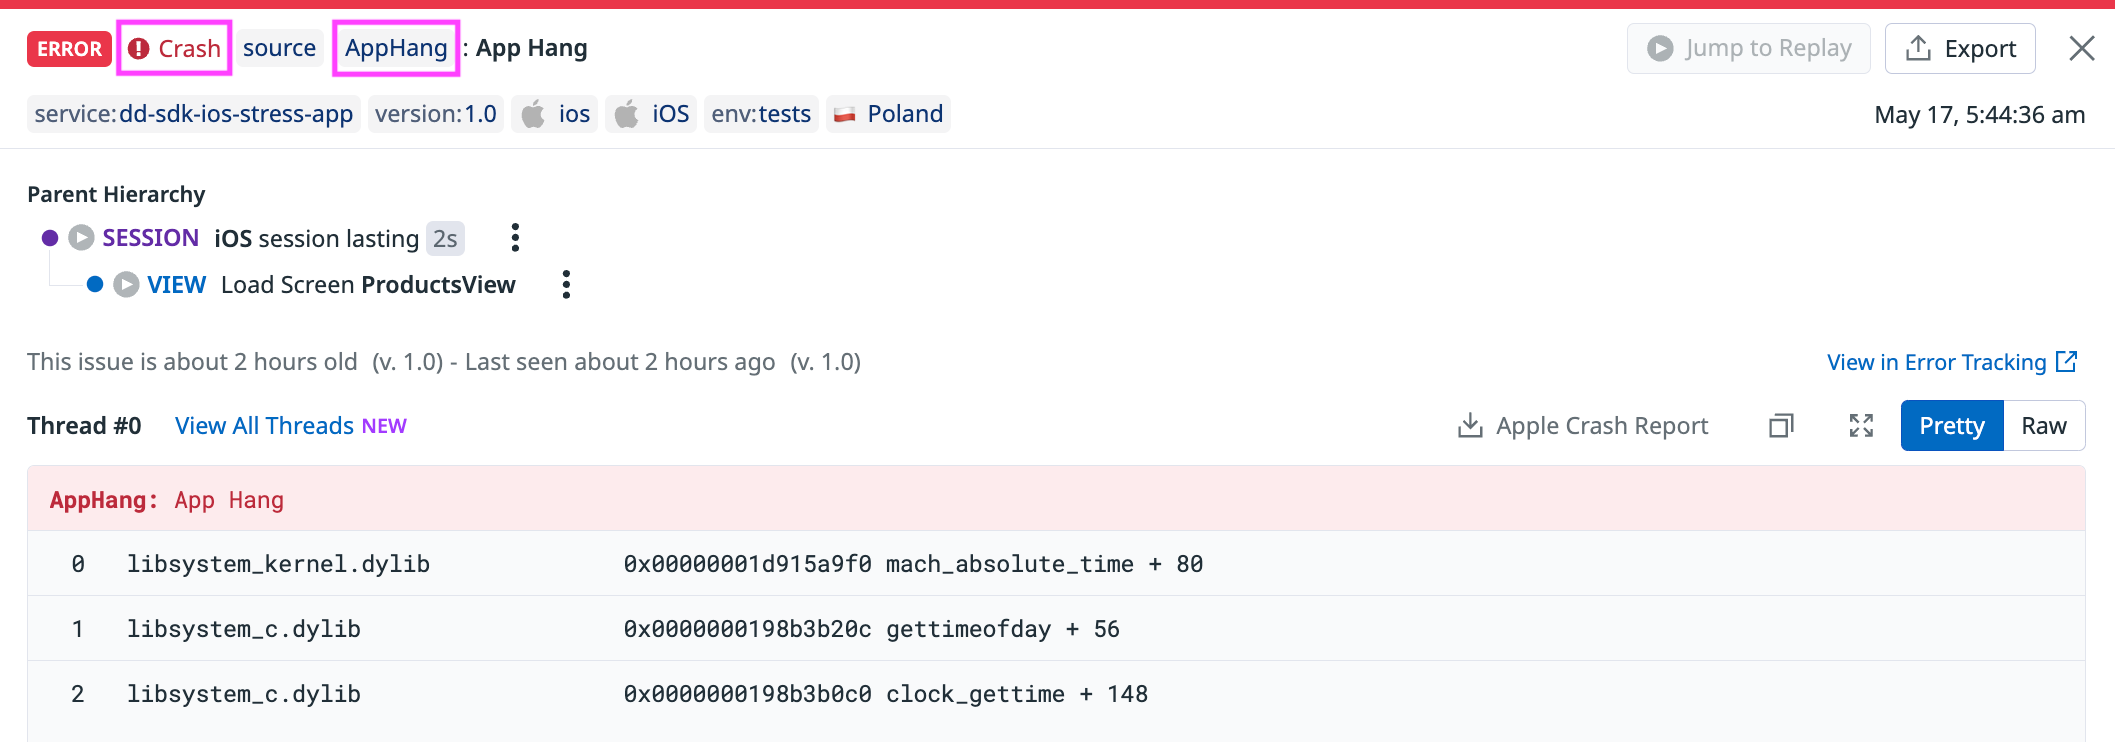
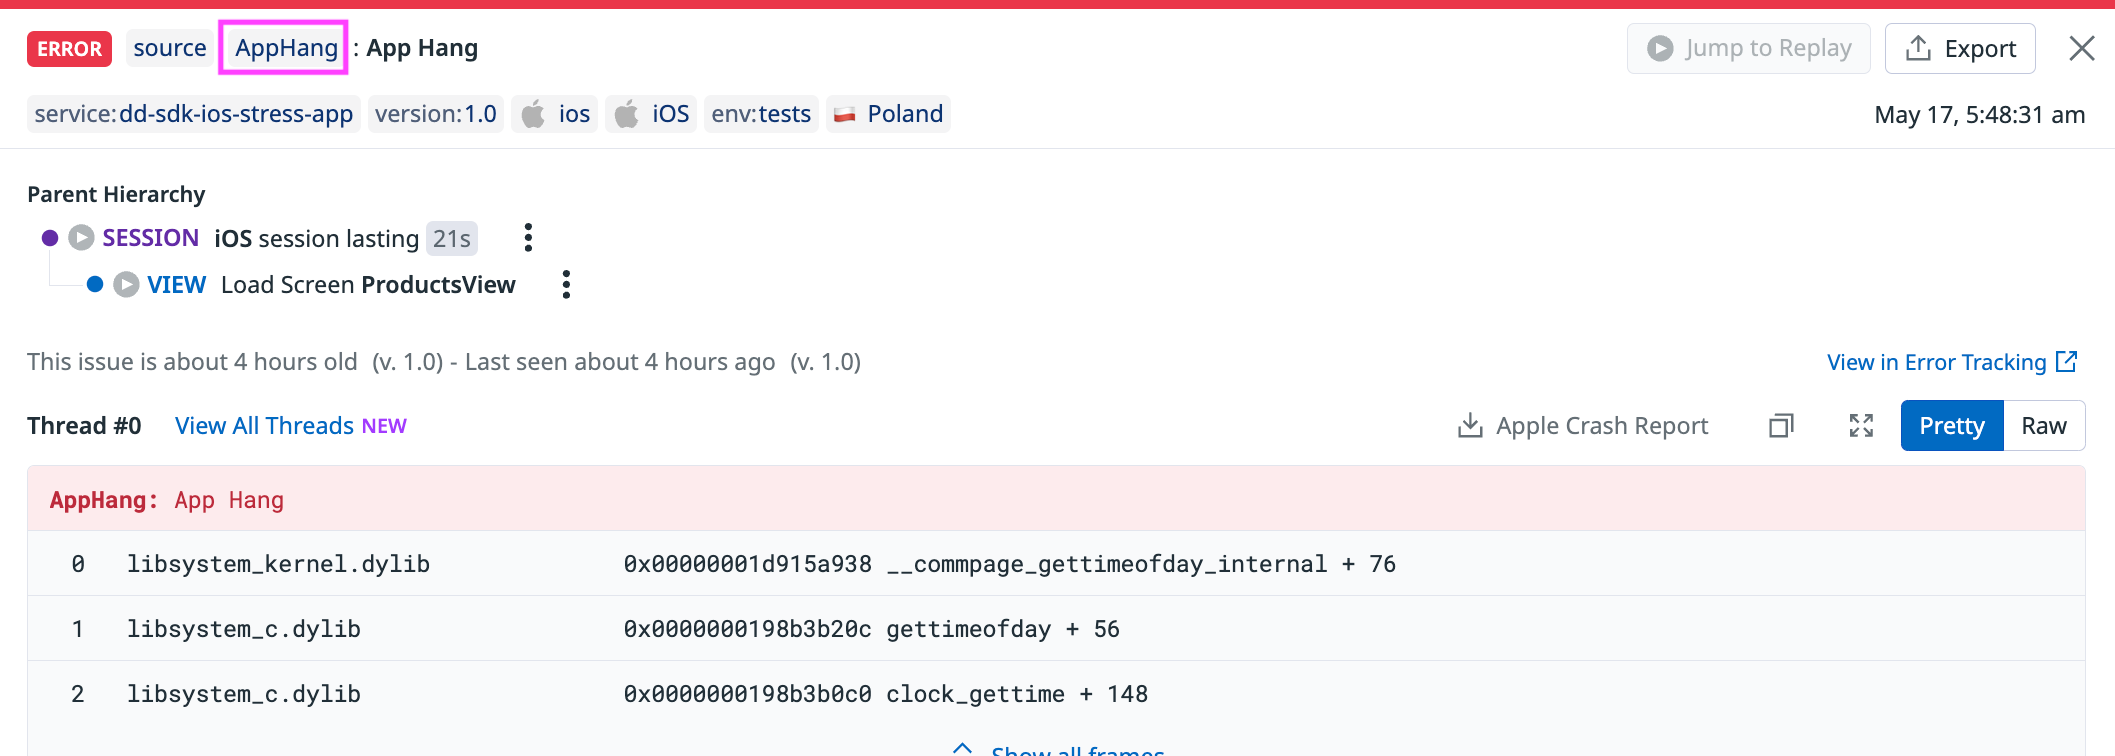
App hangs are an iOS-specific type of error that happens when the application is unresponsive for too long. App hangs are reported through the iOS SDK (not through Logs). By default, app hangs reporting is disabled, but you can enable it and set your own threshold to monitor app hangs that last longer than a duration you can specify in the appHangThreshold initialization parameter. When enabled, any main thread pause that is longer than the specified appHangThreshold is considered a “hang” in Error Tracking. A customizable threshold allows you to find the right balance between fine-grained and noisy observability. See Configure the app hang threshold for more guidance on setting this value.
There are two types of hangs:
Fatal app hang: How a hang gets reported if it never gets recovered and the app is terminated. Fatal app hangs are marked as a “Crash” in Error Tracking and the RUM explorer.
Non-fatal app hang: How a hang gets reported if the app recovers from a relatively short hang and continues running. Non-fatal app hangs do not have a “Crash” mark on them in Error Tracking and the RUM explorer.
Enable app hang monitoring
Enable app hang monitoring
To enable app hang monitoring:
Update the initialization snippet with the
appHangThresholdparameter set to the minimal duration you want app hangs to be reported, in seconds. For example, use0.25to report hangs lasting at least 250 ms:RUM.enable( with: RUM.Configuration( applicationID: "<application id>", appHangThreshold: 0.25 ) )See Configure the app hang threshold for more guidance on setting this value.
Make sure you follow the steps below to get deobfuscated stack traces, which transform cryptic memory addresses into readable function names and line numbers for effective debugging.
Configure the app hang threshold
Configure the app hang threshold
Choose the right threshold value based on your monitoring needs:
- For development and debugging:
- Start with
appHangThreshold: 0.25seconds (250 ms) to catch most performance issues - Adjust incrementally (lower or higher) to find the right setup for your specific needs
- Start with
- For production monitoring:
- Set
appHangThresholdbetween2.0and3.0seconds to filter out noisy hangs and focus on significant performance issues - This aligns with user experience expectations, where hangs under 2 seconds are less noticeable
- Set
Threshold limits
- Minimum:
0.1seconds (100 ms) - however, setting the threshold to such small values may lead to an excessive reporting of hangs - Recommended range:
0.25to3.0seconds - The SDK uses 2.5% tolerance to reduce CPU usage, which means some hangs that last close to the
appHangThresholdmay not be reported
Configuration example
RUM.enable(
    with: RUM.Configuration(
        applicationID: "<application id>",
        appHangThreshold: 2.0  // Report hangs lasting 2+ seconds
    )
)
Disable app hang monitoring
Disable app hang monitoring
To disable app hang monitoring, update the initialization snippet and set the appHangThreshold parameter to nil.
Step 6 - Get deobfuscated stack traces
Crash reports are collected in a raw format and mostly contain memory addresses. To map these addresses into legible symbol information (a process called symbolication), Datadog requires .dSYM files, which are generated in your application’s build or distribution process.
Note: Error Tracking supports symbolication of system symbol files for iOS v14+ arm64 and arm64e architecture. .dSYM files are limited in size to 2 GB each.
To help you debug errors, Datadog uses a unique generated build ID to deobfuscate stack traces, matching them with their corresponding mapping files. This process occurs regardless of whether the mapping files were uploaded during pre-production or production builds, ensuring the correct information is available for efficient QA processes when reviewing crashes and errors in Datadog.
For iOS applications, the matching of stack traces and symbol files relies on their uuid field.
Find your .dSYM files
Find your .dSYM files
Every iOS application produces .dSYM files for each application module. These files minimize an application’s binary size and enable faster download speed. Each application version contains a set of .dSYM files.
Depending on your setup, you may need to download .dSYM files from App Store Connect or find them on your local machine.
| Bitcode Enabled | Description |
|---|---|
| Yes | .dSYM files are available after App Store Connect completes processing your application’s build. |
| No | Xcode exports .dSYM files to $DWARF_DSYM_FOLDER_PATH at the end of your application’s build. Ensure that the DEBUG_INFORMATION_FORMAT build setting is set to DWARF with dSYM File. By default, Xcode projects only set DEBUG_INFORMATION_FORMAT to DWARF with dSYM File for the Release project configuration. |
Upload your .dSYM files
Upload your .dSYM files
By uploading your .dSYM files to Datadog, you gain access to the file path and line number of each frame in an error’s related stack trace.
After your application crashes and you restart the application, the iOS SDK uploads a crash report to Datadog.
Note: Re-uploading a .dSYM file with the same application version does not override the existing one.
You can use the command line tool @datadog/datadog-ci to upload your .dSYM files:
export DATADOG_API_KEY="<API KEY>"

// if you have a zip file containing dSYM files
npx @datadog/datadog-ci dsyms upload appDsyms.zip

// if you have a folder containing dSYM files
npx @datadog/datadog-ci dsyms upload /path/to/appDsyms/
Note: To configure the tool using the EU endpoint, set the DATADOG_SITE environment variable to datadoghq.eu. To override the full URL for the intake endpoint, define the DATADOG_DSYM_INTAKE_URL environment variable.
For example, to configure for different Datadog sites:
# For EU endpoint
export DATADOG_SITE="datadoghq.eu"
export DATADOG_API_KEY="<API KEY>"
npx @datadog/datadog-ci dsyms upload appDsyms.zip

# For custom intake URL
export DATADOG_DSYM_INTAKE_URL="https://your-custom-endpoint.com"
export DATADOG_API_KEY="<API KEY>"
npx @datadog/datadog-ci dsyms upload appDsyms.zip
The Fastlane plugin helps you upload .dSYM files to Datadog from your Fastlane configuration.
Add
fastlane-plugin-datadogto your project.fastlane add_plugin datadogConfigure Fastlane to upload your symbols.
# download_dsyms action feeds dsym_paths automatically
lane :upload_dsym_with_download_dsyms do
  download_dsyms
  upload_symbols_to_datadog(api_key: "datadog-api-key")
end
For more information, see fastlane-plugin-datadog.
The Datadog Upload dSYMs GitHub Action allows you to upload your symbols in your GitHub Action jobs:
name: Upload dSYM Files

jobs:
  build:
    runs-on: macos-latest

    steps:
      - name: Checkout
        uses: actions/checkout@v2

      - name: Generate/Download dSYM Files
        uses: ./release.sh

      - name: Upload dSYMs to Datadog
        uses: DataDog/upload-dsyms-github-action@v1
        with:
          api_key: ${{ secrets.DATADOG_API_KEY }}
          site: datadoghq.com
          dsym_paths: |
            path/to/dsyms/folder
            path/to/zip/dsyms.zip
For more information, see dSYMs commands.
Test your implementation
To verify your iOS Crash Reporting and Error Tracking configuration, issue a crash in your application and confirm that the error appears in Datadog.
Run your application on an iOS simulator or a real device. Ensure that the debugger is not attached. Otherwise, Xcode captures the crash before the iOS SDK does.
Execute the code containing the crash:
func didTapButton() {
fatalError("Crash the app")
}
After the crash happens, restart your application and wait for the iOS SDK to upload the crash report in Error Tracking.
Advanced Error Tracking features
Set tracking consent (GDPR compliance)
Set tracking consent (GDPR compliance)
To be compliant with the GDPR regulation, the iOS SDK requires the tracking consent value at initialization.
The trackingConsent setting can be one of the following values:
.pending: The iOS SDK starts collecting and batching the data but does not send it to Datadog. The iOS SDK waits for the new tracking consent value to determine what to do with the batched data..granted: The iOS SDK starts collecting the data and sends it to Datadog..notGranted: The iOS SDK does not collect any data, and doesn’t send logs, traces, or events to Datadog.
To change the tracking consent value after the iOS SDK is initialized, use the Datadog.set(trackingConsent:) API call. The iOS SDK changes its behavior according to the new value.
For example, if the current tracking consent is .pending:
If you change the value to
.granted, the iOS SDK sends all current and future data to Datadog.If you change the value to
.notGranted, the iOS SDK wipes all current data and does not collect future data.
Sample session rates
Sample session rates
To control the data your application sends to Datadog, you can specify a sampling rate for sessions while initializing the iOS SDK. The rate is a percentage between 0 and 100. By default, sessionSamplingRate is set to 100 (keep all sessions).
For example, to only keep 50% of sessions, use:
let configuration = RUM.Configuration(
    applicationID: "<application id>",
    sessionSampleRate: 50
)
DDRUMConfiguration *configuration = [[DDRUMConfiguration alloc] initWithApplicationID:@"<application id>"];
configuration.sessionSampleRate = 50;
Send data when device is offline
Send data when device is offline
The iOS SDK ensures data remains available when an end user’s device is offline. In cases of low-network areas, or when the device battery is too low, the device first stores all events in batches. It sends them as soon as the network is available and the battery is high enough to ensure the iOS SDK does not impact the end user’s experience. If the network is not available while your application is in the foreground, or if a data upload fails, the device keeps the batch until it can complete a successful upload.
This means that even if users open your application while offline, no data is lost.
Note: To ensure the iOS SDK does not use too much disk space, the device automatically discards the data on the disk if the data gets too old.
Add watchdog terminations reporting
Add watchdog terminations reporting
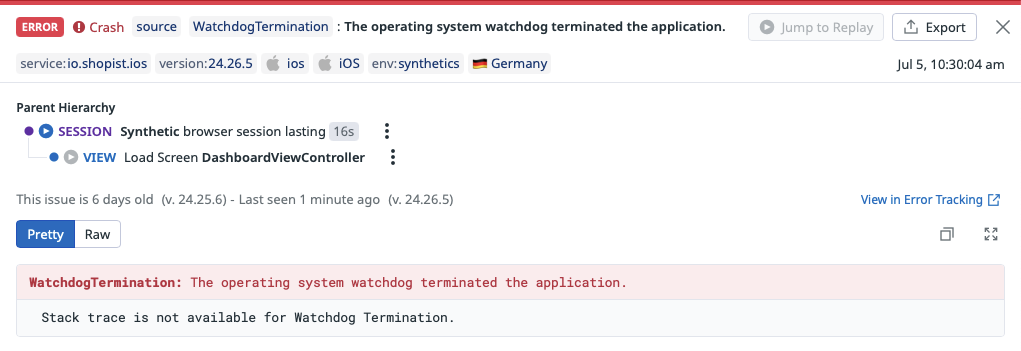
In the Apple ecosystem, the operating system employs a watchdog mechanism to monitor the health of applications, and terminates them if they become unresponsive or consume excessive resources like CPU and memory. These watchdog terminations are fatal and not recoverable (more details in the official Apple documentation).
By default, watchdog terminations reporting is disabled, but you can enable it by using the trackWatchdogTerminations initialization parameter.
When enabled, the app reports a watchdog termination and attaches to the previous user session on the next application launch, if all of the following conditions are true:
The application was not upgraded in the meantime,
And it did not call neither
exit, norabort,And it did not crash, either because of an exception, or because of a fatal app hang,
And it was not force-quitted by the user,
And the device did not reboot (which includes upgrades of the operating system).
Enable watchdog terminations reporting
To enable watchdog terminations reporting:
Update the initialization snippet with the
trackWatchdogTerminationsflag:RUM.enable( with: RUM.Configuration( applicationID: "<application id>", trackWatchdogTerminations: true ) )
Disable watchdog terminations reporting
To disable watchdog terminations reporting, update the initialization snippet and set the trackWatchdogTerminations parameter to false.
Further reading
お役に立つドキュメント、リンクや記事:


