- 重要な情報
- はじめに
- 用語集
- Standard Attributes
- ガイド
- インテグレーション
- エージェント
- OpenTelemetry
- 開発者
- Administrator's Guide
- API
- Partners
- DDSQL Reference
- モバイルアプリケーション
- CoScreen
- CoTerm
- Remote Configuration
- Cloudcraft
- アプリ内
- ダッシュボード
- ノートブック
- DDSQL Editor
- Reference Tables
- Sheets
- Watchdog
- アラート設定
- メトリクス
- Bits AI
- Internal Developer Portal
- Error Tracking
- Change Tracking
- Service Management
- Actions & Remediations
- インフラストラクチャー
- Cloudcraft
- Resource Catalog
- ユニバーサル サービス モニタリング
- Hosts
- コンテナ
- Processes
- サーバーレス
- ネットワークモニタリング
- Cloud Cost
- アプリケーションパフォーマンス
- APM
- Continuous Profiler
- データベース モニタリング
- Data Streams Monitoring
- Data Jobs Monitoring
- Data Observability
- Digital Experience
- RUM & セッションリプレイ
- Synthetic モニタリング
- Continuous Testing
- Product Analytics
- Software Delivery
- CI Visibility (CI/CDの可視化)
- CD Visibility
- Deployment Gates
- Test Visibility
- Code Coverage
- Quality Gates
- DORA Metrics
- Feature Flags
- セキュリティ
- セキュリティの概要
- Cloud SIEM
- Code Security
- クラウド セキュリティ マネジメント
- Application Security Management
- Workload Protection
- Sensitive Data Scanner
- AI Observability
- ログ管理
- Observability Pipelines(観測データの制御)
- ログ管理
- CloudPrem
- 管理
Exception Replay in Error Tracking
This product is not supported for your selected Datadog site. ().
このページは日本語には対応しておりません。随時翻訳に取り組んでいます。
翻訳に関してご質問やご意見ございましたら、お気軽にご連絡ください。
翻訳に関してご質問やご意見ございましたら、お気軽にご連絡ください。
Exception Replay is generally available for Python, Java, .NET, PHP, and is enabled by default
when supported.
Overview
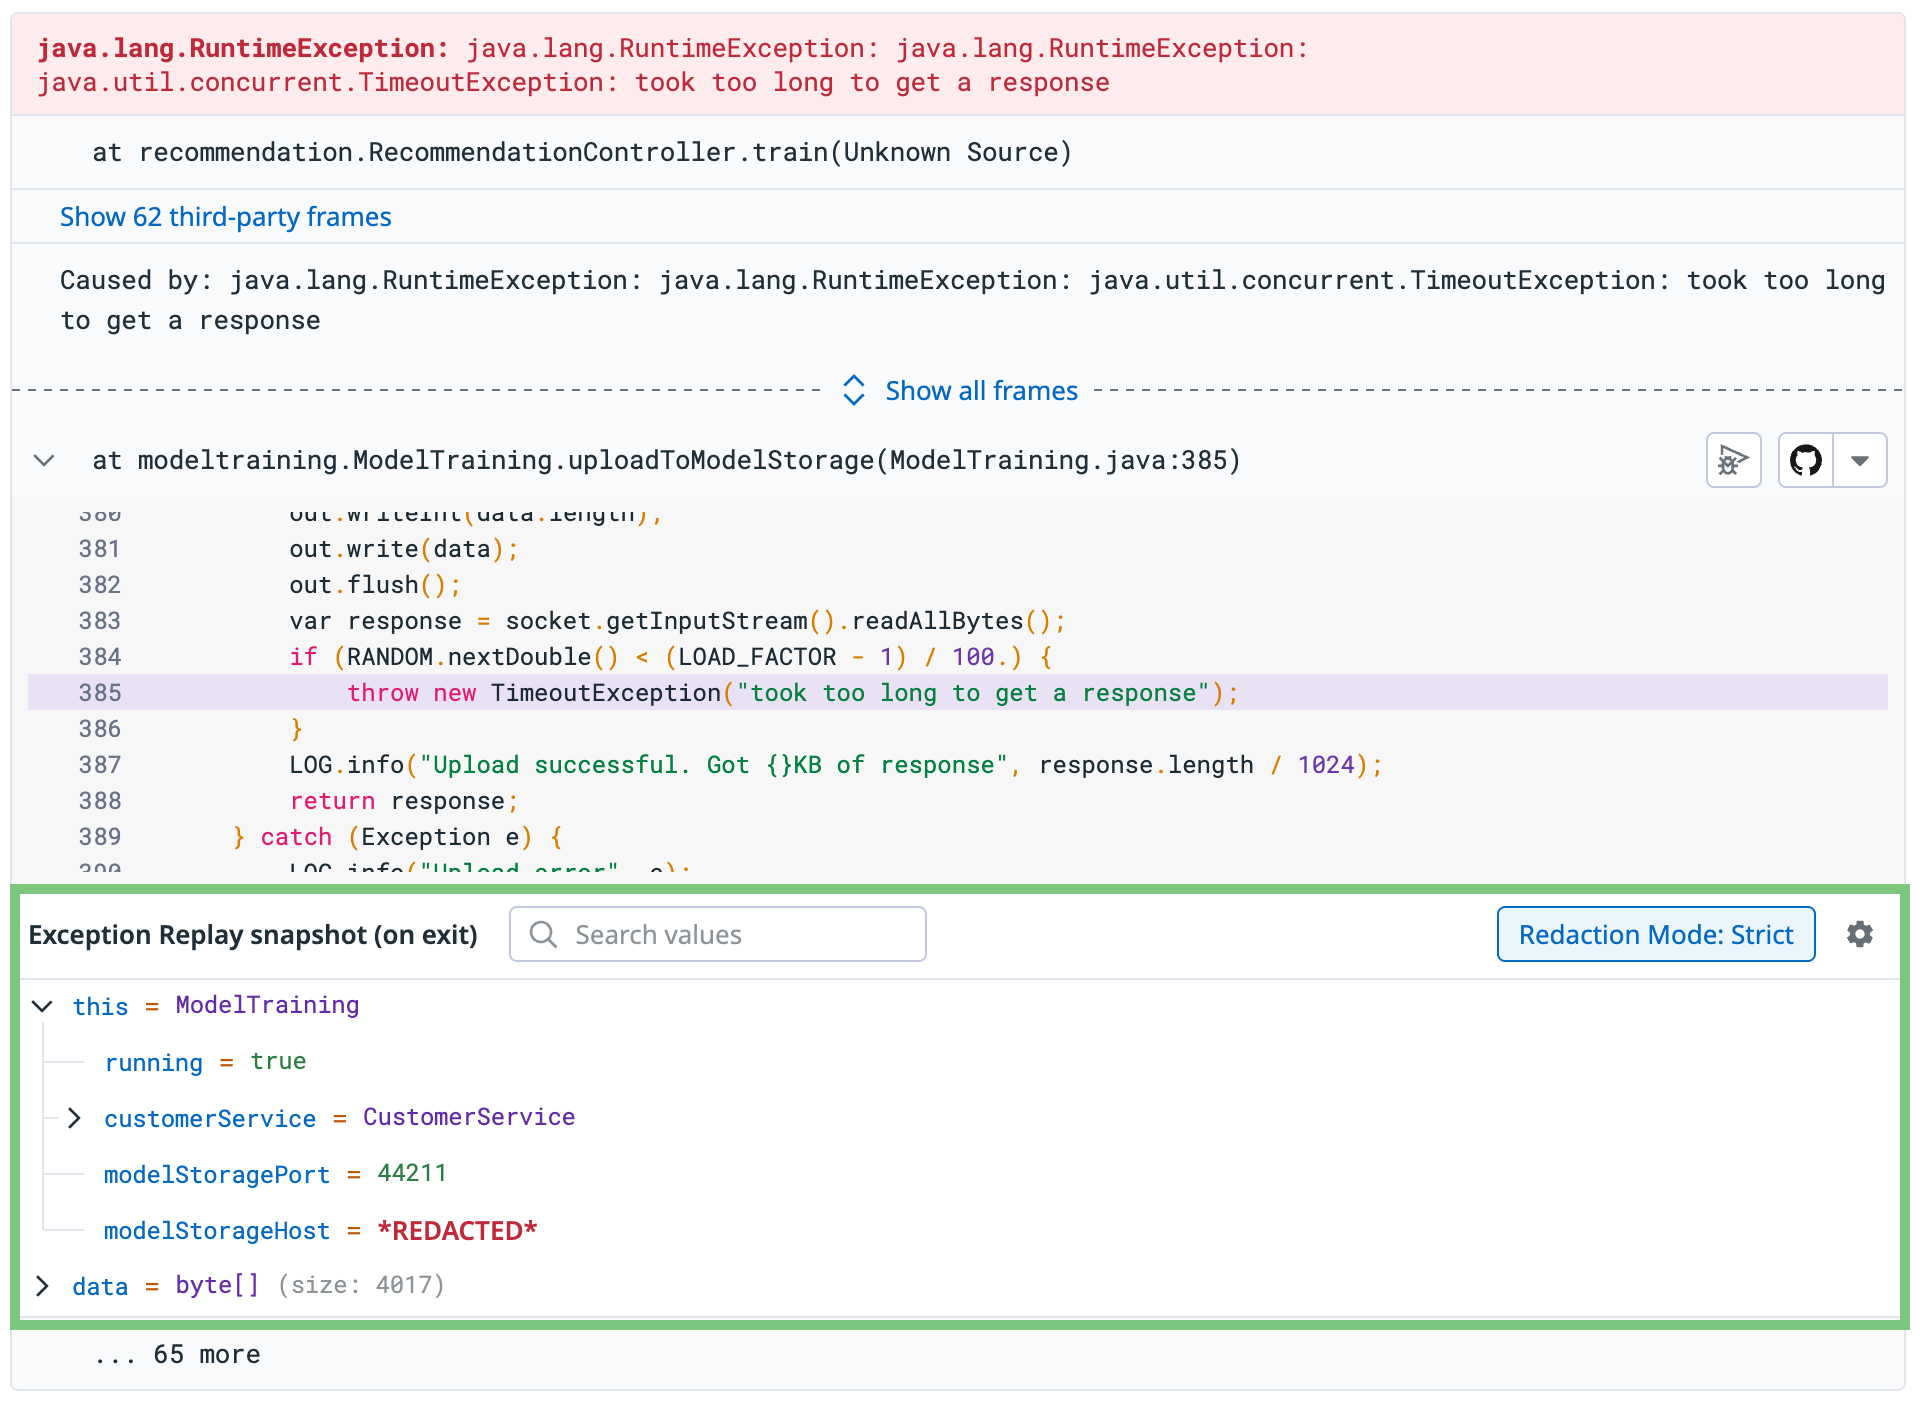
Exception Replay captures execution context and local variable values when an exception occurs, helping you diagnose, reproduce, and resolve issues faster. It records the surrounding state, including the stack trace and variable snapshots, then surfaces this data directly in Error Tracking alongside the rest of the issue details.
Exception Replay is designed for production use. Snapshots are rate-limited, and sensitive data is automatically redacted. When enabled, it waits for exceptions in an application and captures snapshots of the stack trace and local variables before forwarding them to Datadog.
What products are supported?
Exception Replay is available only for APM-based exceptions and does not support errors from Logs or RUM.
Requirements & Setup
Exception Replay supports Python, Java, .NET, and PHP, and captures only APM-based exceptions. It requires the Datadog Agent and an APM-instrumented application. You can enable it for an entire environment, an individual service in-app, or a specific service using environment variables.
The enablement method depends on your tracer version and whether Remote Configuration is available. See the table below for details.
| By Environment (Bulk) | By Service (In-App) | By Service (Env Var) | |
|---|---|---|---|
| How to Enable | Enabled by default | Settings page | Environment variables |
| Agent Version | v7.49.0+ | v7.49.0+ | v7.49.0+ |
| Minimum Tracer Versions | Python ≥ 3.15.0 Java ≥ 1.54.0 .NET ≥ 3.29.0 | Python ≥ 3.10.0 Java ≥ 1.48.0 .NET ≥ 3.29.0 | Python ≥ 1.16.0 Java ≥ 1.47.0 .NET ≥ 2.53.0 PHP ≥ 1.12.1 |
| Remote Configuration Required? | Yes | Yes | No |
To enable Exception Replay in-app, navigate to the Exception Replay Settings page in Error Tracking, select the desired environment or service, and toggle it to Enabled.
If in-app enablement isn’t available, set the environment variable:
DD_EXCEPTION_REPLAY_ENABLED=true
This can also be used to override in-app configuration and takes precedence when both are set.
Create a logs index for Exception Replay snapshots
Create a logs index dedicated to Exception Replay snapshots and configure it with the desired retention and no sampling.
- Set the filter to match
source:dd_debugger. - Ensure the index takes precedence over other indexes matching this tag (the first match wins).
Why create a logs index?
Exception Replay snapshots are emitted as logs enriched with links back to the originating APM spans.
Link your source code
If you enable the Datadog Source Code Integration, you can see code previews directly inside your Error Tracking stack traces. When Exception Replay snapshots are captured, you can hover over variable names in the code preview to view their captured values.
Sensitive data redaction
Exception Replay applies automatic mode- and identifier-based redaction to ensure sensitive data is protected before snapshots becomes available.
Mode-based redaction
Exception Replay has two redaction modes:
- Strict Mode: Redacts all values except numbers and Booleans.
- Targeted Mode: Redacts known sensitive patterns such as credit card numbers, API keys, IPs, and other PII.
These redaction modes cannot be disabled, only switched, and Targeted Mode is applied automatically in common
pre-production environments like staging or preprod.
Identifier-based redaction
Variable values associated with common sensitive identifiers (for example, password, accessToken, and similar terms)
are scrubbed before snapshots leave the host. Additional language-specific redaction rules are built into each tracer
(for example, the Python tracer maintains a list of default sensitive identifiers).
You can extend redaction behavior through:
- Custom identifier-based redaction
- Class/type-based redaction rules
- Sensitive Data Scanner rules
See the Dynamic Instrumentation Sensitive Data Scrubbing instructions and Sensitive Data Scanner documentation for configuration details.
Why DI instructions?
Exception Replay is built on Dynamic Instrumentation (DI), so its
sensitive data scrubbing configuration options also apply here.
Troubleshooting
Missing variable values
Exception Replay snapshots are rate-limited to one snapshot per exception type per instance per hour. In some runtimes, a snapshot is only captured after the second occurrence for a given exception.
Additional reasons a snapshot may not appear
- Exception Replay not enabled
- Snapshot occurred outside selected time window
- Third-party package exclusions (use
DD_THIRD_PARTY_DETECTION_EXCLUDESto include these) - Logs with
source:dd_debuggermissing due to Log Index retention settings or Exclusion Filters in preceding indexes - Exception Replay is not available in the FedRAMP region
- Java: On JDK 18 and below, classes compiled with the
-parametersflag may not be supported. Spring 6+, Spring Boot 3+, and Scala use this flag by default.
Use the query @error.debug_info_captured:true in Error Tracking Explorer to find errors with Exception Replay
snapshots.

