- 重要な情報
- はじめに
- 用語集
- Standard Attributes
- ガイド
- インテグレーション
- エージェント
- OpenTelemetry
- 開発者
- Administrator's Guide
- API
- Partners
- DDSQL Reference
- モバイルアプリケーション
- CoScreen
- CoTerm
- Remote Configuration
- Cloudcraft
- アプリ内
- ダッシュボード
- ノートブック
- DDSQL Editor
- Reference Tables
- Sheets
- Watchdog
- アラート設定
- メトリクス
- Bits AI
- Internal Developer Portal
- Error Tracking
- Change Tracking
- Service Management
- Actions & Remediations
- インフラストラクチャー
- Cloudcraft
- Resource Catalog
- ユニバーサル サービス モニタリング
- Hosts
- コンテナ
- Processes
- サーバーレス
- ネットワークモニタリング
- Cloud Cost
- アプリケーションパフォーマンス
- APM
- Continuous Profiler
- データベース モニタリング
- Data Streams Monitoring
- Data Jobs Monitoring
- Data Observability
- Digital Experience
- RUM & セッションリプレイ
- Synthetic モニタリング
- Continuous Testing
- Product Analytics
- Software Delivery
- CI Visibility (CI/CDの可視化)
- CD Visibility
- Deployment Gates
- Test Visibility
- Code Coverage
- Quality Gates
- DORA Metrics
- Feature Flags
- セキュリティ
- セキュリティの概要
- Cloud SIEM
- Code Security
- クラウド セキュリティ マネジメント
- Application Security Management
- Workload Protection
- Sensitive Data Scanner
- AI Observability
- ログ管理
- Observability Pipelines(観測データの制御)
- ログ管理
- CloudPrem
- 管理
Error Tracking
このページは日本語には対応しておりません。随時翻訳に取り組んでいます。
翻訳に関してご質問やご意見ございましたら、お気軽にご連絡ください。
翻訳に関してご質問やご意見ございましたら、お気軽にご連絡ください。
Overview
It is critical for your system’s health to consistently monitor the errors collected by Datadog. When there are many individual error events, it becomes hard to prioritize errors for troubleshooting.
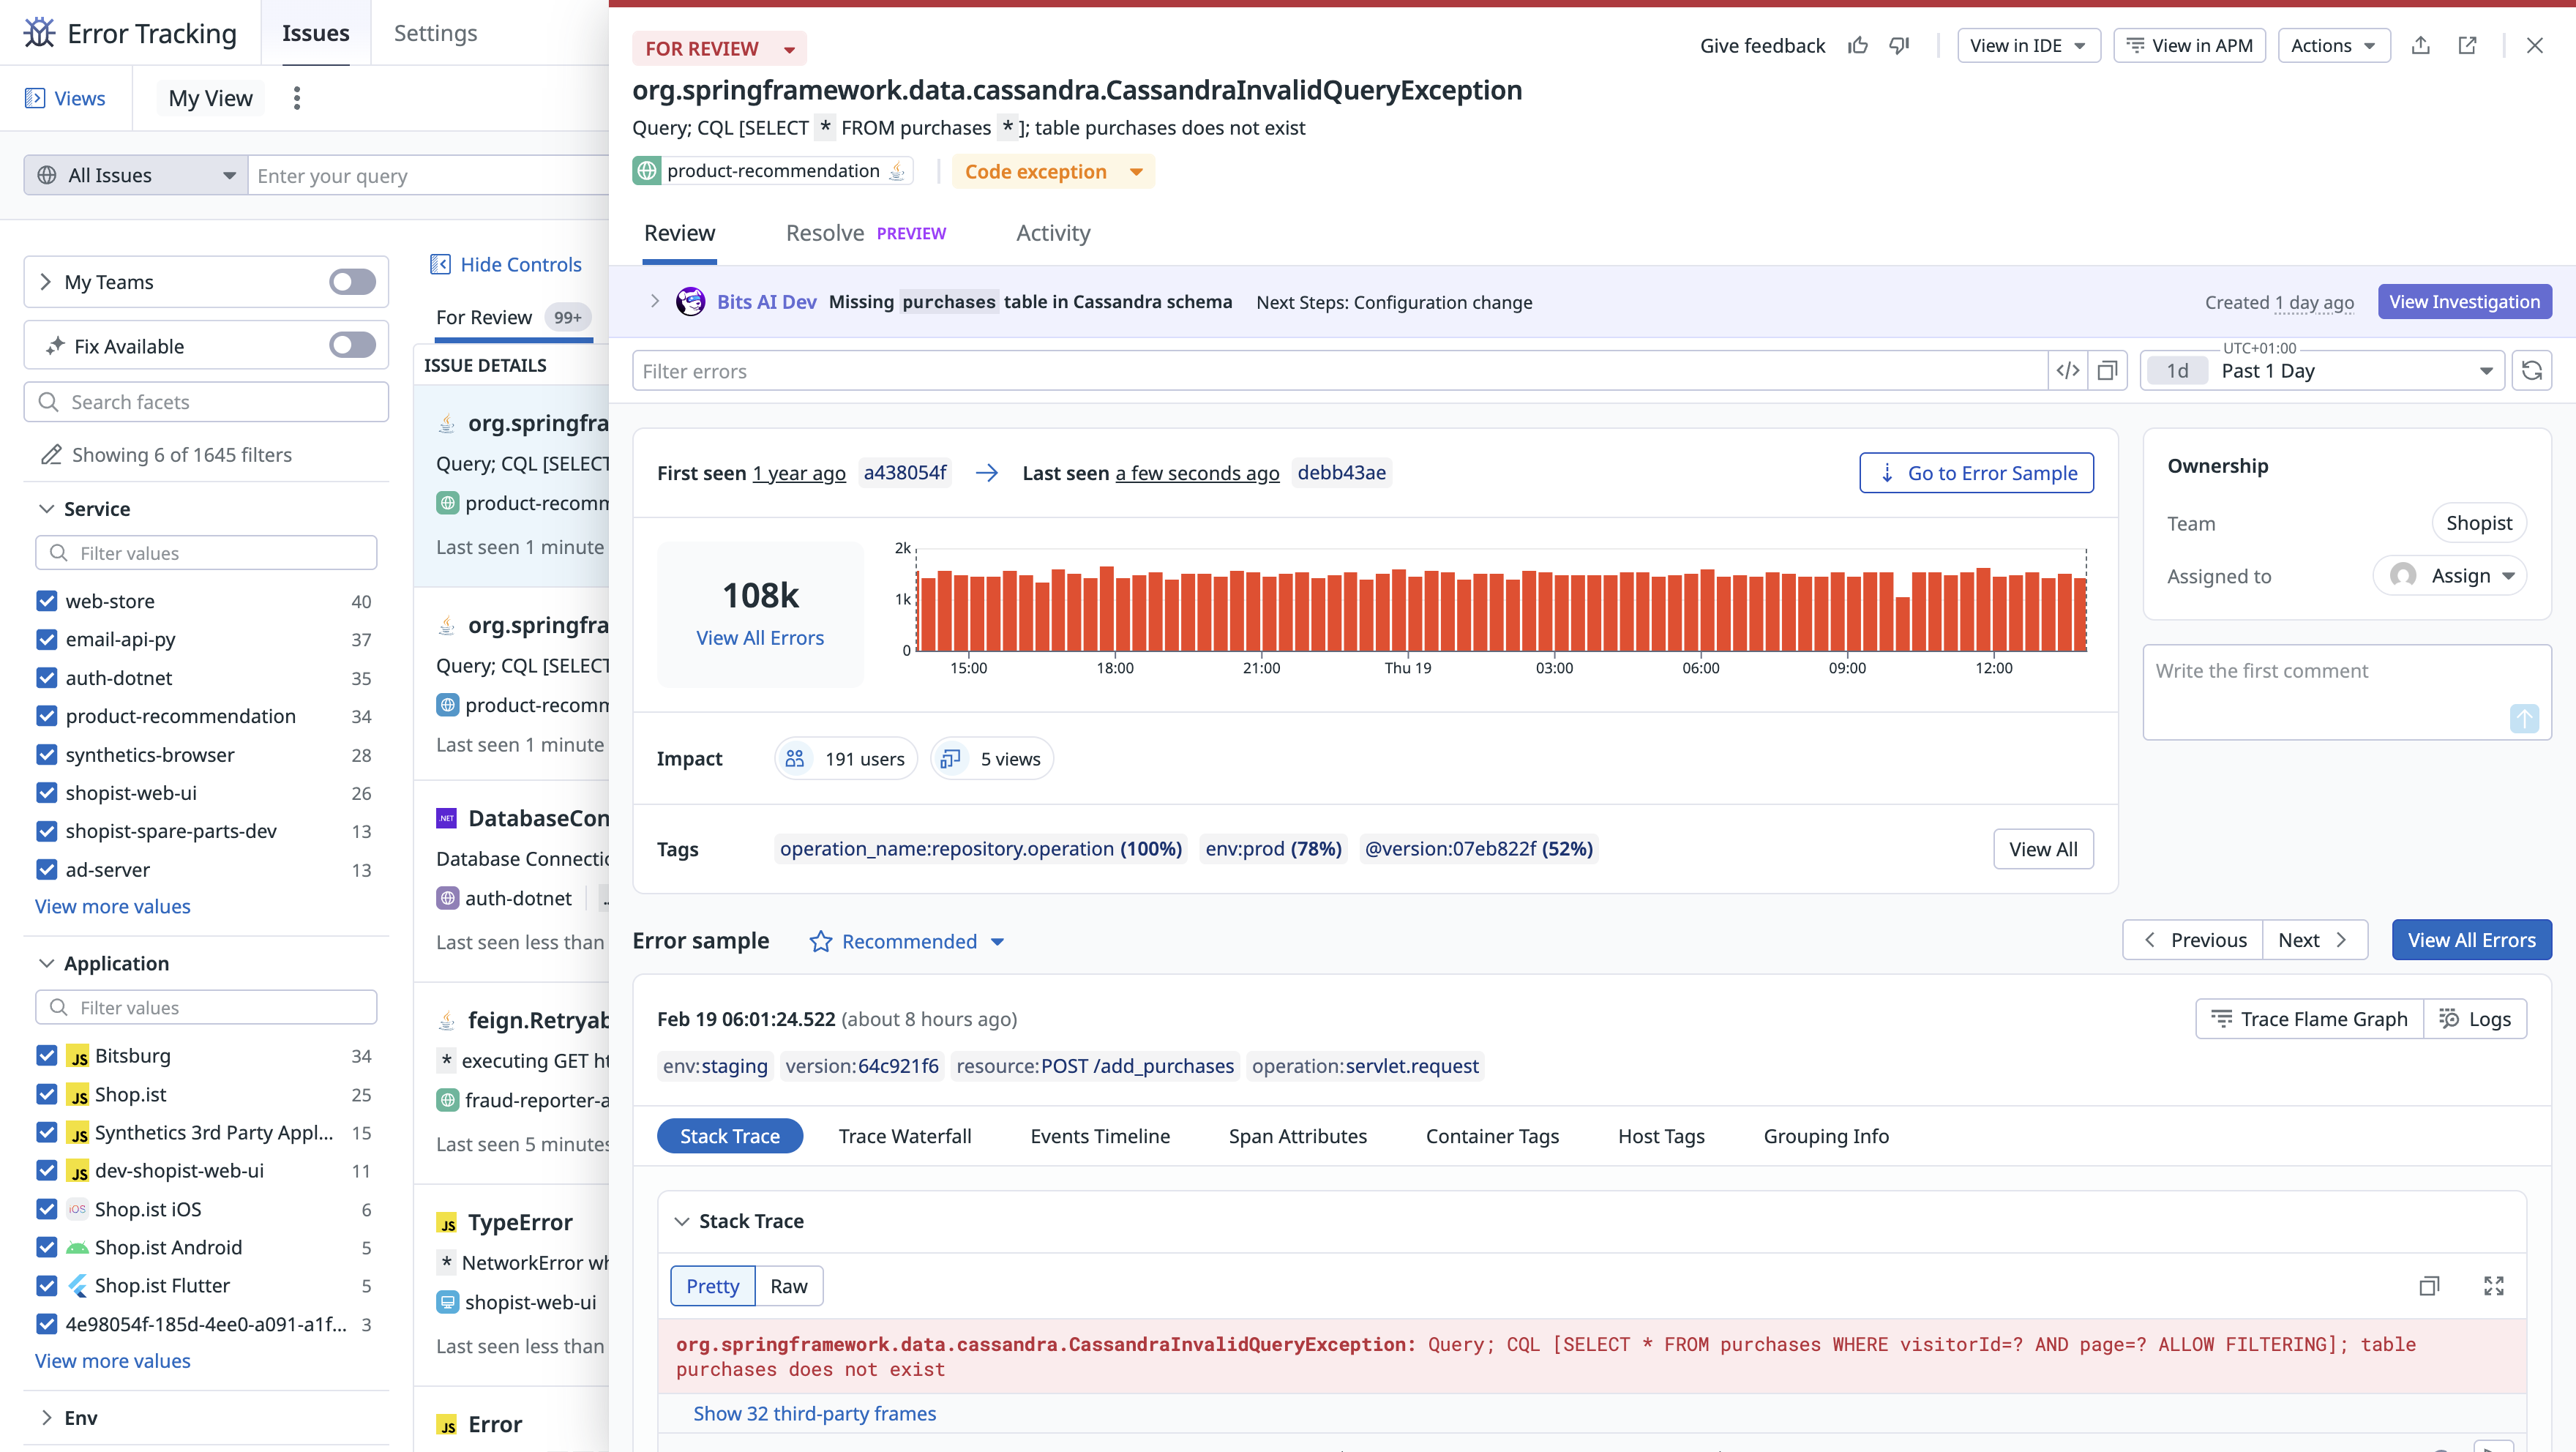
Error Tracking simplifies debugging by grouping thousands of similar errors into a single issue. An issue is an aggregation of error data that provides insights such as
- How many users have been impacted
- When the error first occurred
- Which commit probably caused the error
Error Tracking enables you to:
- Track, triage, and debug fatal errors
- Group similar errors into issues, so that you can more easily identify important errors and reduce noise
- Set monitors on error tracking events, such as high error volume or new issues
- Follow issues over time to know when they first started, if they are still ongoing, and how often they occur
Additional features are available depending on the source of the error. See supported error sources.
For developers
Developers can triage and fix issues completely within IntelliJ IDEA, PyCharm, WebStorm, GoLand, PhpStorm, and RubyMine using the Error Tracking integration in the Datadog plugin for JetBrains IDEs. Ask your local AI agent to analyze and fix errors with a single click to provide the full error context.
Getting started
- Take a tour of key Error Tracking features in the Error Tracking Explorer documentation.
- Use the product-specific links in the next section to set up Error Tracking for a particular error source.
Setup
To get started with Datadog Error Tracking, choose one of the following setup options:
Supported error sources
Error Tracking captures and processes errors across your web, mobile, and backend applications. You can instrument your applications and services using the Browser SDK, Mobile SDK, or ingest errors from your Logs, Traces, and Real User Monitoring events.
Additional features are available depending on the source of the error. For example, in errors originating from an APM trace, the Exception Replay feature automatically captures production variable values.
For details, see the product-specific Error Tracking documentation:

