イネーブルメントウェビナーセッションに参加
Database Monitoring を使って、コストのかかるクエリや遅いクエリをすばやく特定する方法を学びましょう。ボトルネックに対処するために、実行の詳細を正確に調べましょう。
Datadog Database Monitoring は、すべてのホストにわたるデータベースの詳細な可視性を提供します。データベースの正常性とパフォーマンスを理解し、問題が発生したときにトラブルシューティングを行うために、過去のクエリパフォーマンスメトリクスを掘り下げ、計画とホストレベルのメトリクスをすべて 1 か所で説明します。
はじめに
Datadog Database Monitoring は、Postgres、MySQL、Oracle、SQL Server、MongoDB、および Amazon DocumentDB のセルフホスト型およびクラウド管理型バージョンに対応しています。Datadog Database Monitoring を開始するには、まずデータベースを構成し、Datadog Agent をインストールしてください。セットアップ手順については、ご利用のデータベース技術を選択してください。
Postgres
MySQL
Oracle
SQL Server
MongoDB
Amazon DocumentDB
Datadog Database Monitoring の調査
Datadog の Database Monitoring に移動します。
クエリパフォーマンスメトリクスを掘り下げる
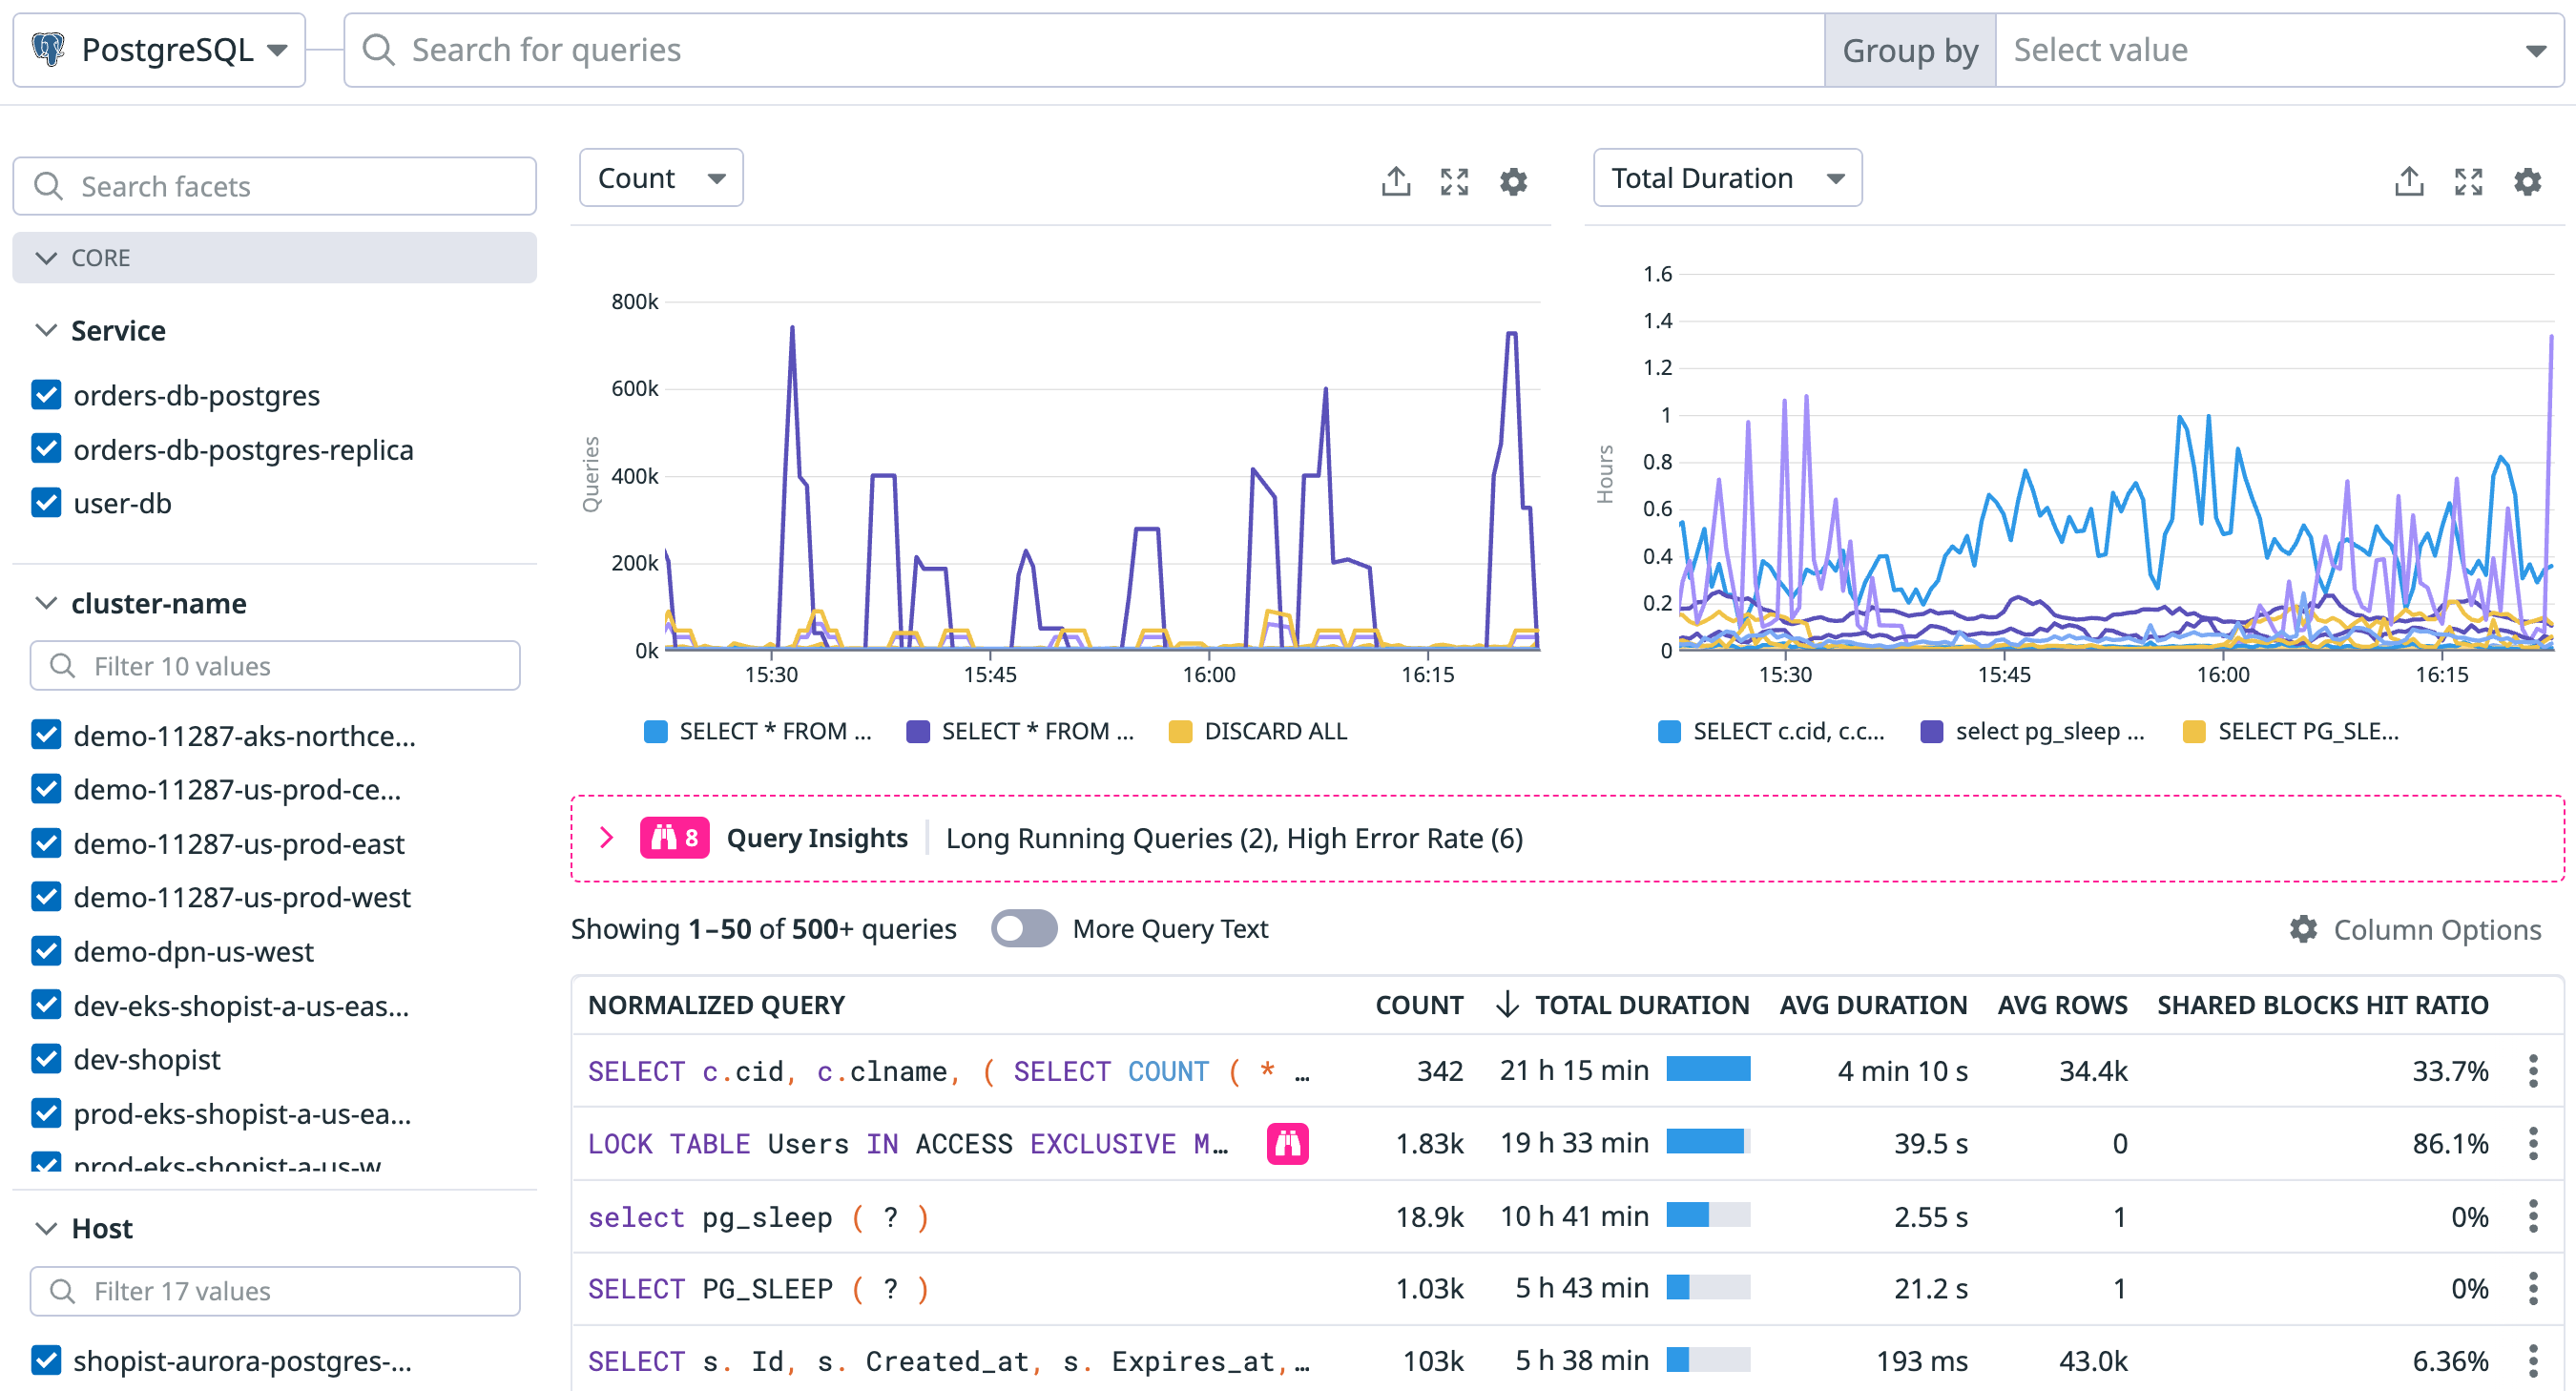
クエリメトリクスビューには、正規化されたクエリの過去のクエリパフォーマンスが表示されます。インフラストラクチャーまたはデータセンターのアベイラビリティーゾーンなどのカスタムタグによってパフォーマンスの傾向を視覚化し、異常についてアラートを設定します。
- 遅いクエリと、最も時間を消費しているクエリを特定します。
- 更新/返された行など、APM によってキャプチャされないデータベースレベルのメトリクスを表示します。
- チーム、ユーザー、クラスター、ホストなどの任意のディメンションでクエリをフィルタリングおよびグループ化します。
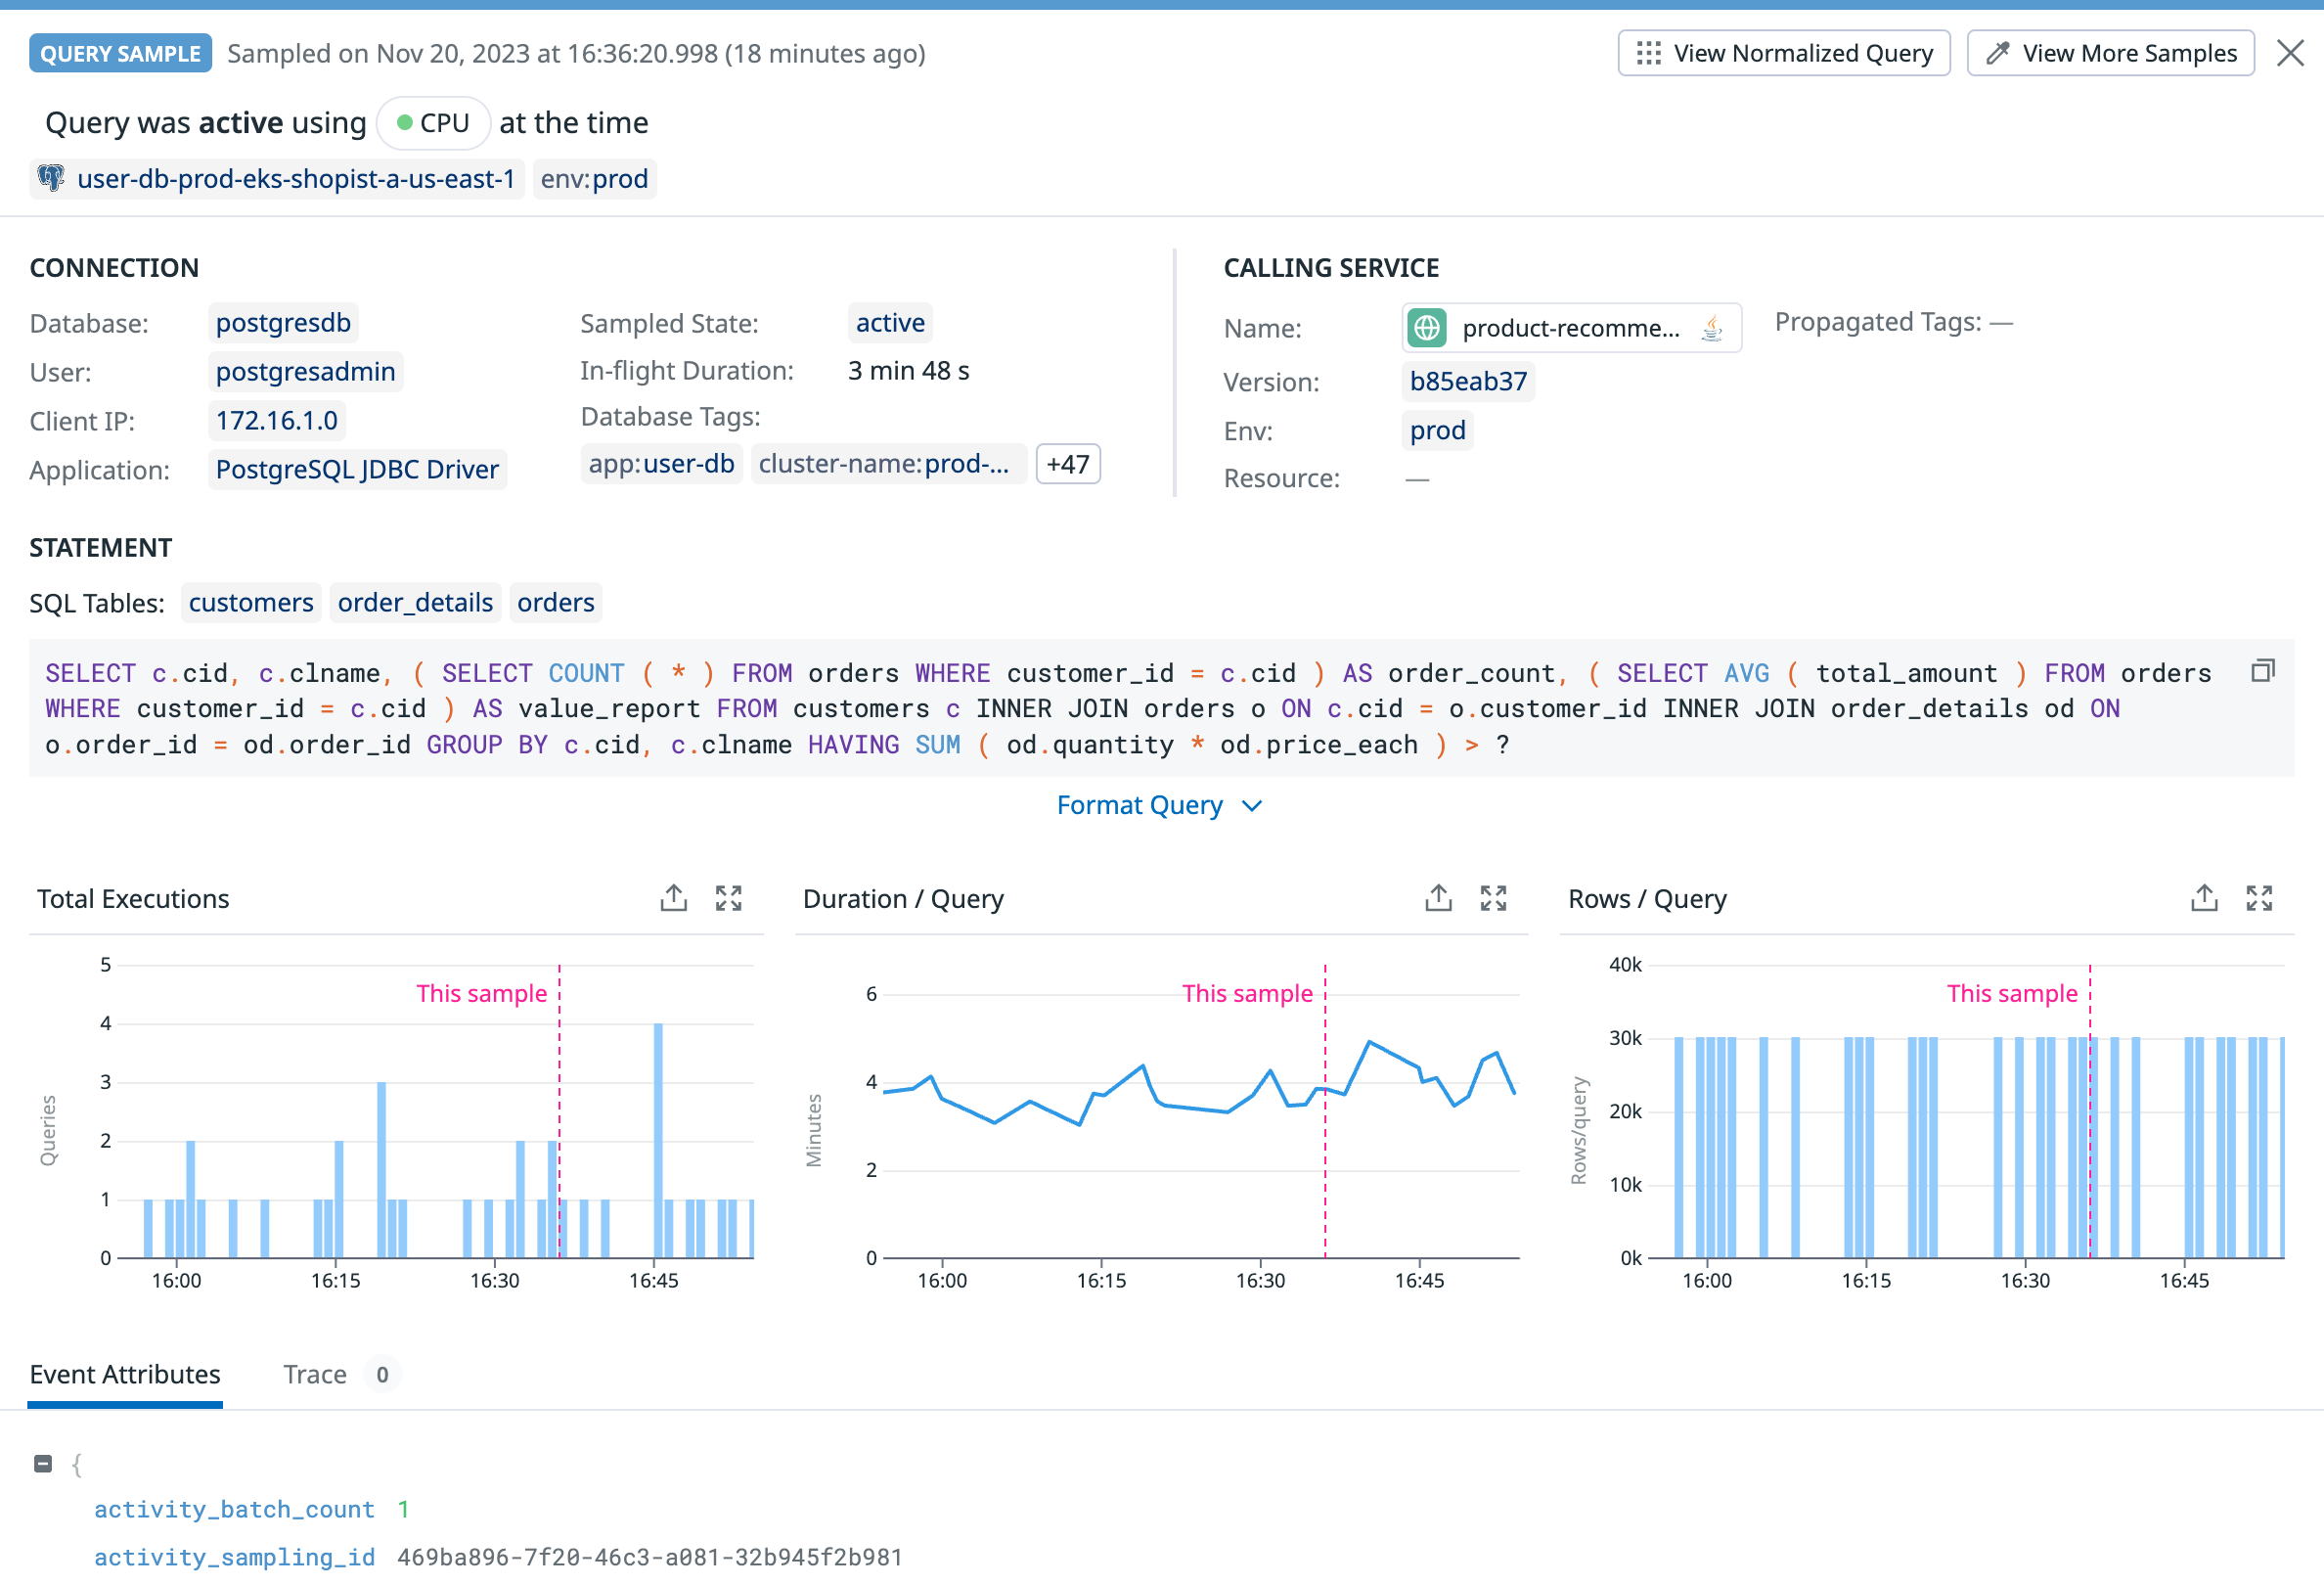
クエリサンプルを確認する
Query Samples ビューは、特定の時間に実行されているクエリを理解するのに役立ちます。各実行を、クエリおよび関連するクエリの平均パフォーマンスと比較します。
- メトリクスによってキャプチャされない、異常に遅いがまれなクエリを識別します。
- クエリの実行時間または実行コストの外れ値を見つけます。
- 特定のクエリ実行をユーザー、アプリケーション、またはクライアントホストに関連付けます。
実行する前に理解する
Explain Plans は、データベースがクエリの実行をどのように計画しているかを理解するのに役立ちます。
- 各操作をステップスルーして、ボトルネックを特定します。
- クエリの効率を改善し、大きなテーブルでのコストのかかる順次スキャンを節約します。
- クエリの計画が時間の経過とともにどのように変化するかを確認します。
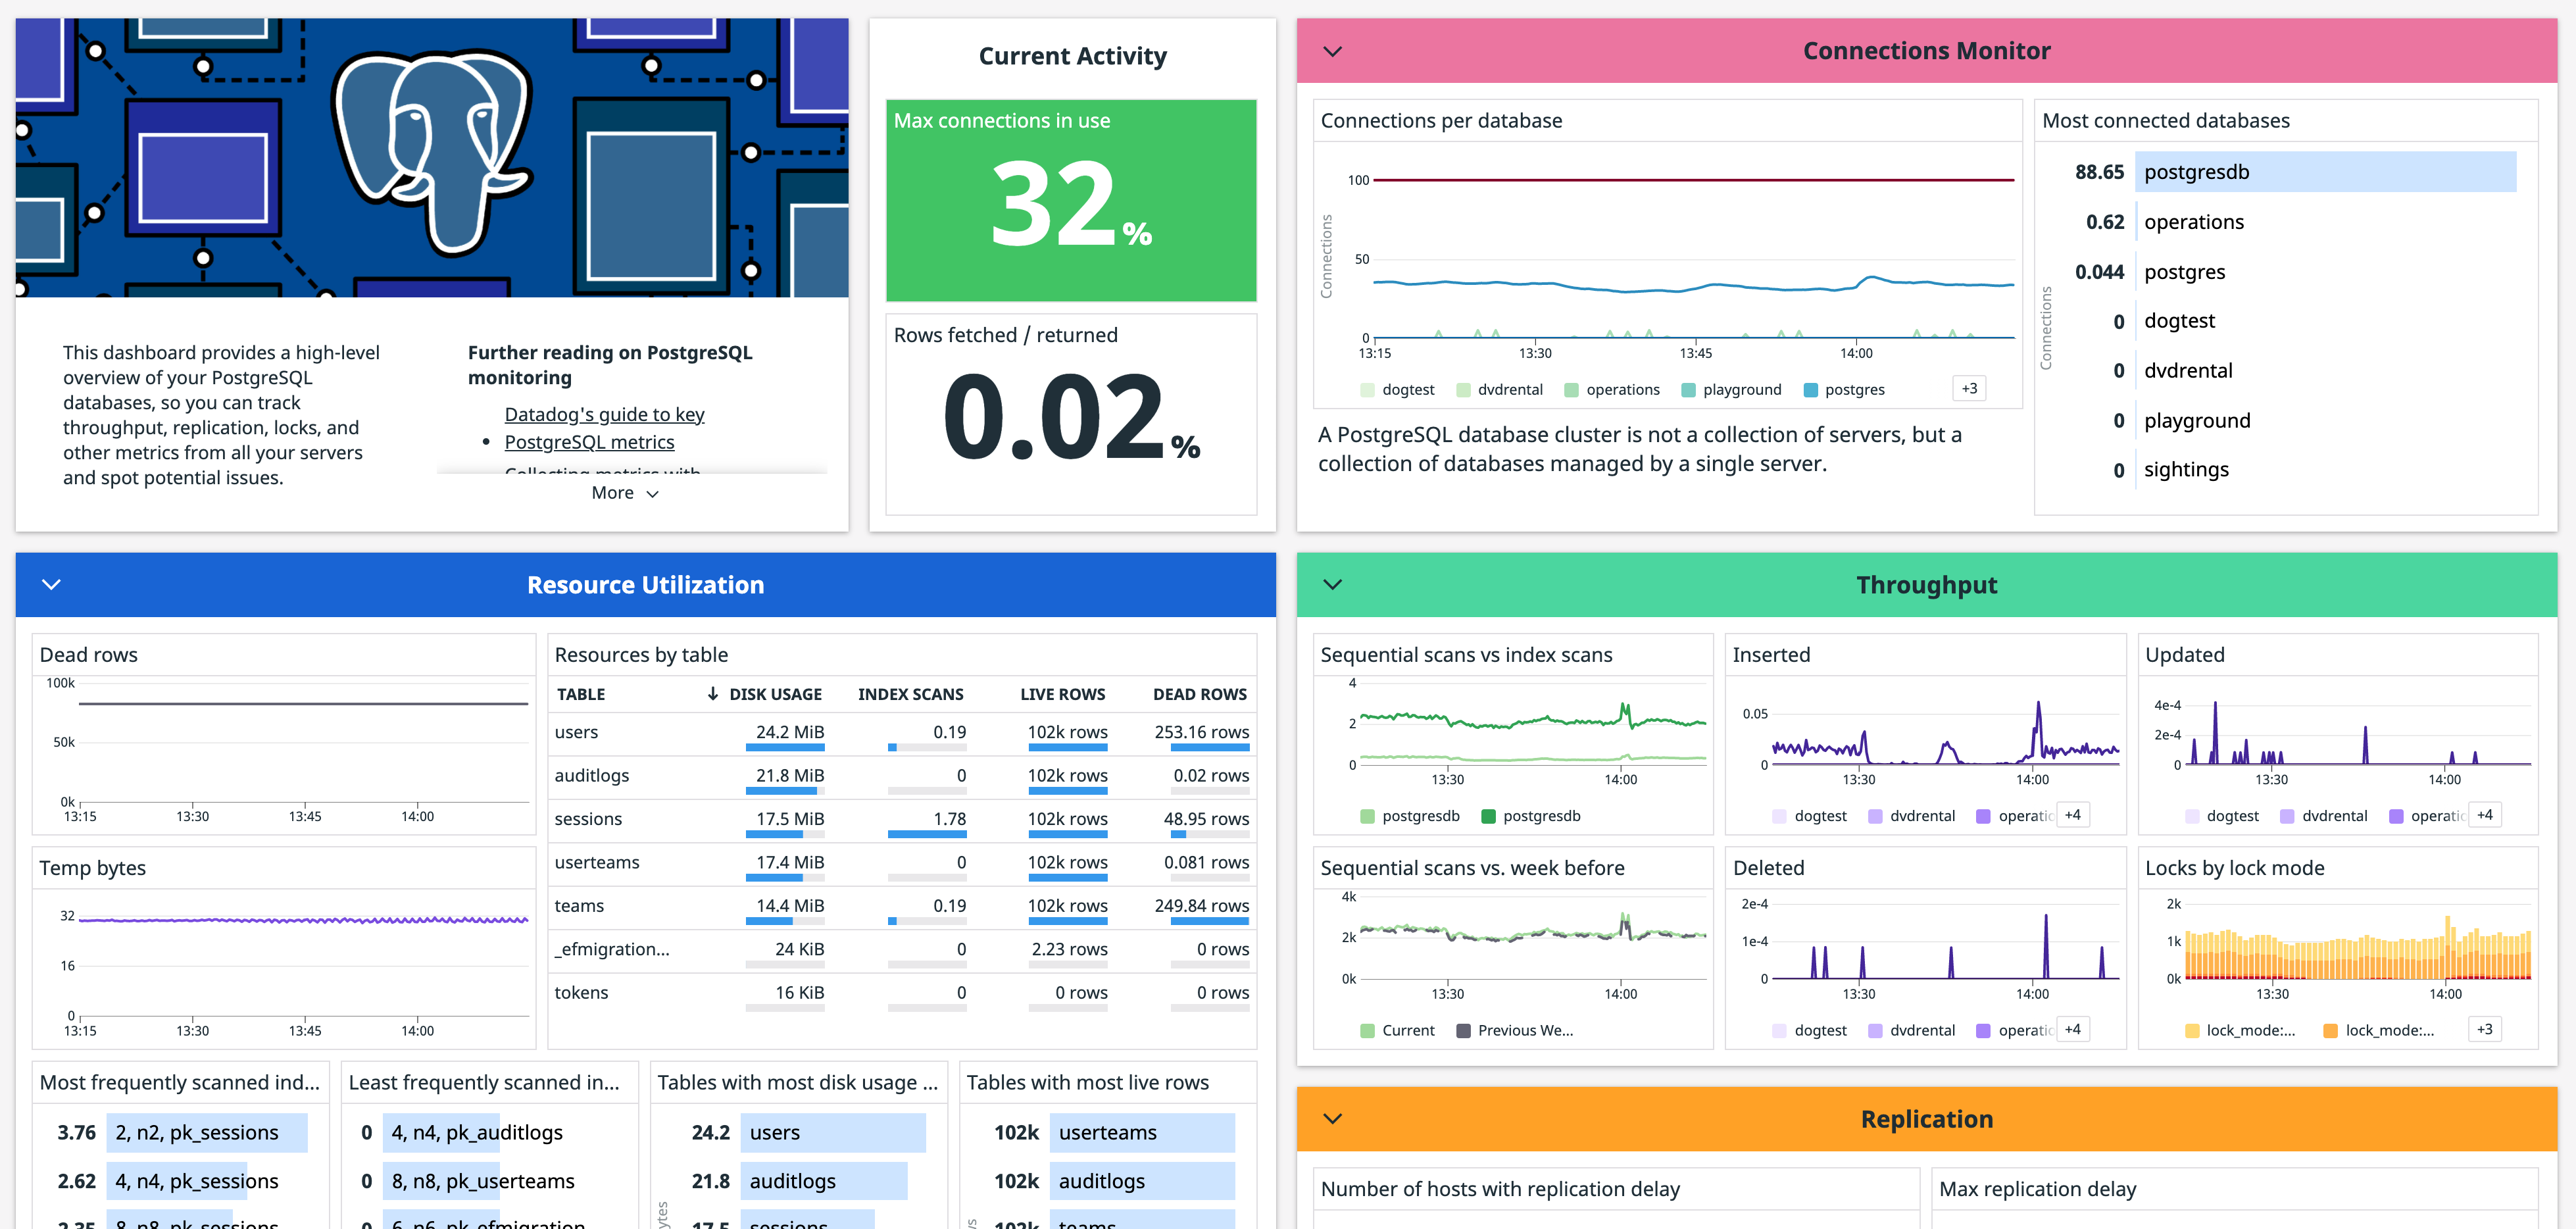
強化されたダッシュボードですべてを視覚化
セルフホストインスタンスとクラウド管理インスタンスの両方の強化されたインテグレーションダッシュボードでデータベースとシステムのメトリクスを一緒に表示することにより、問題のある領域をすばやく特定します。ダッシュボードのクローンを作成して、独自のカスタムメトリクスを使用してカスタマイズおよび拡張します。Query Metrics ページと Query Samples ページの上部にある Dashboards リンクをクリックして、Database Monitoring ダッシュボードに移動します。
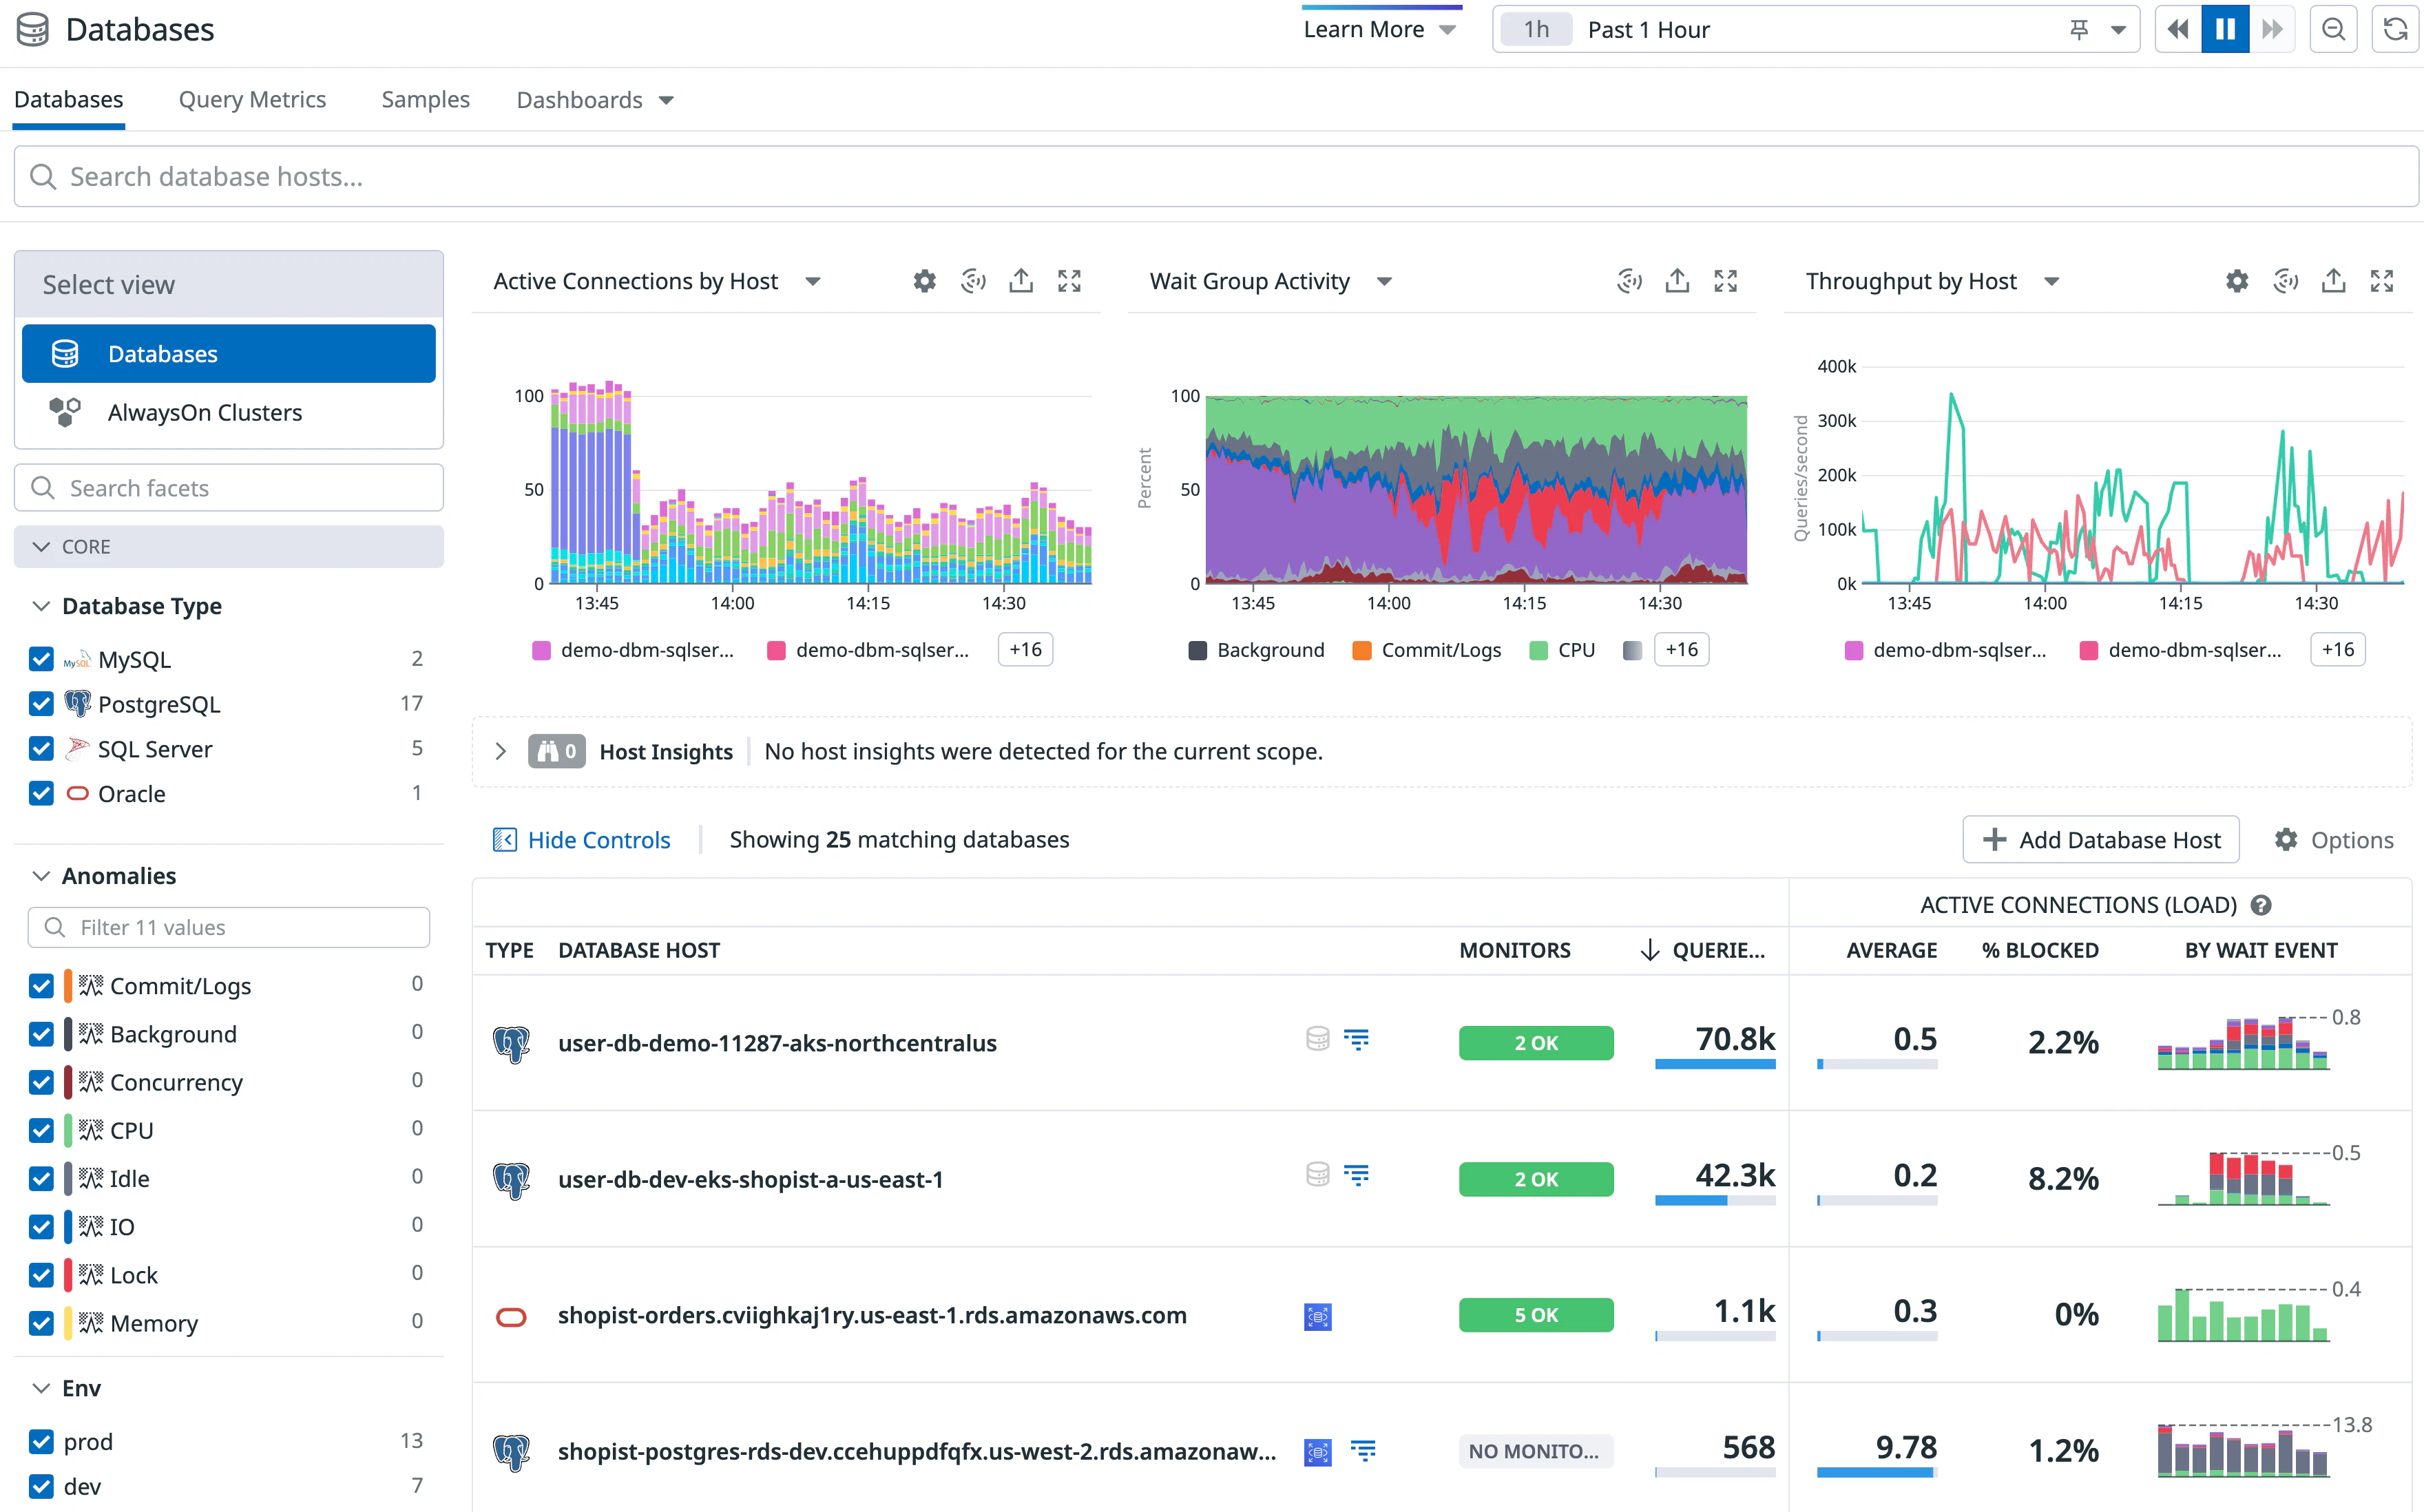
ホストの健全性とパフォーマンスを最適化する
Databases ページでは、データベースホストの健全性とアクティビティを評価できます。リストを並べ替えたりフィルタリングしたりすることで、トリガーされたアラートがあるホスト、クエリ量が多いホスト、その他の基準に優先順位を付けることができます。個々のホストをクリックすると、構成、一般的なブロッキングクエリ、呼び出し元のサービスなどの詳細が表示されます。詳細については、データベースホストの探索を参照してください。
最適化に関する推奨事項を表示
Recommendations ページは、問題点や最適化の機会を明確化し、重要度に応じた優先順位付けによって時間の節約に役立ちます。推奨事項を選択すると、問題の概要や対応に必要な次のステップなどの詳細を確認できます。
その他の参考資料

ラーニングセンターで Datadog DBM による Postgres データベースの監視をお試しください
Datadog ラーニングセンターは、このトピックに関する実践的なコースが充実しており、無料で参加することで Postgres データベースの非効率性を特定し、最適化することができます。