- 重要な情報
- はじめに
- 用語集
- Standard Attributes
- ガイド
- インテグレーション
- エージェント
- OpenTelemetry
- 開発者
- Administrator's Guide
- API
- Partners
- DDSQL Reference
- モバイルアプリケーション
- CoScreen
- CoTerm
- Remote Configuration
- Cloudcraft
- アプリ内
- ダッシュボード
- ノートブック
- DDSQL Editor
- Reference Tables
- Sheets
- Watchdog
- アラート設定
- メトリクス
- Bits AI
- Internal Developer Portal
- Error Tracking
- Change Tracking
- Service Management
- Actions & Remediations
- インフラストラクチャー
- Cloudcraft
- Resource Catalog
- ユニバーサル サービス モニタリング
- Hosts
- コンテナ
- Processes
- サーバーレス
- ネットワークモニタリング
- Cloud Cost
- アプリケーションパフォーマンス
- APM
- Continuous Profiler
- データベース モニタリング
- Data Streams Monitoring
- Data Jobs Monitoring
- Data Observability
- Digital Experience
- RUM & セッションリプレイ
- Synthetic モニタリング
- Continuous Testing
- Product Analytics
- Software Delivery
- CI Visibility (CI/CDの可視化)
- CD Visibility
- Deployment Gates
- Test Visibility
- Code Coverage
- Quality Gates
- DORA Metrics
- Feature Flags
- セキュリティ
- セキュリティの概要
- Cloud SIEM
- Code Security
- クラウド セキュリティ マネジメント
- Application Security Management
- Workload Protection
- Sensitive Data Scanner
- AI Observability
- ログ管理
- Observability Pipelines(観測データの制御)
- ログ管理
- CloudPrem
- 管理
Wildcard Widget
このページは日本語には対応しておりません。随時翻訳に取り組んでいます。
翻訳に関してご質問やご意見ございましたら、お気軽にご連絡ください。
翻訳に関してご質問やご意見ございましたら、お気軽にご連絡ください。
Overview
The Wildcard widget in Datadog extends the flexibility of the open-source Vega-Lite “Grammar of Graphics” language, and integrates it with the Datadog platform. The Wildcard widget allows you to create graphs that are not available within native Datadog widgets and query systems.
Use the Wildcard widget in Dashboards and Notebooks.
Best Practices
Datadog recommends using an existing dashboard widget to meet your use case. All native widgets have design and performance optimizations which are not available in the Wildcard widget. For known limitations, see the Additional information section.
However, if none of the Datadog widgets meets your visualization needs, a Wildcard widget is a fast way to get a new capability added to your Dashboards without waiting for a new feature or graph type to be added.
- Don’t start from scratch. Vega-Lite maintains a public gallery with over 150 official examples. If you’re not sure what type of graph you want to use, fork an existing example to test the visualization. Use Vega-Lite over Vega for simplicity and ease of debugging.
- Test the Wildcard widget. The flexibility of the Wildcard widget comes with the risk of creating slow, unappealing, or inconsistent visualizations. Test the Wildcard widget on a scratchpad or empty dashboard before adding Wildcard widgets to production.
- Validate your query. Datadog widgets guarantee that the data visualizations are semantically aligned with the query, which ensures the configuration builds the expected graph. With the Wildcard widget, you’re adding a custom Vega-Lite specification that defines how the request maps to visual elements. This creates the potential that you’ll fetch a data field that isn’t used in your visualization. Use the Data Preview to help debug mismatches.
Setup
After you create a Wildcard widget, you can configure the widget either as a new configuration or by importing a configuration from an existing widget.
Configure a new Wildcard widget
- Check native widgets. See if a Datadog widget can fulfill your requirements.
- If no Datadog widget meets your requirements, in a new or pre-existing dashboard, click Add Widgets.
- Click and drag the Wildcard Widget icon from the widget tray.
- Select from the Request Type dropdown. For more information on Scalar and Timeseries types, see the Formulas Scalar vs. Formulas Timeseries section of this page.
- Copy a Vega-Lite Definition from the public gallery to find a starter Vega-Lite specification.
- Open the Wildcard widget full screen editor and click Define Visual.
- Paste the copied Vega-Lite definition.
- Click Run to apply your configuration changes, see a preview of the visualization, and iterate on your design. Note: You must click Run to add your changes, however this does not save your configuration.
- (Optional) Debug Vega-Lite specification mismatches with Data Preview. Make sure the query in your Vega-Lite specification maps to the Datadog query.
- Click Save.
Formulas Scalar vs. Formulas Timeseries
In Datadog dashboards, visualizations are powered by a multiple request types, including scalar and timeseries. Each request type changes the number and type of fields available for the data in a Wildcard widget.
- Timeseries
- This data format is designed to display how your data changes over time.
- Use-cases: It’s ideal for monitoring metrics that fluctuate, such as CPU usage, memory consumption, or request rates. It helps identify trends, patterns, and anomalies over a specified time range.
- Scalar
- This data format aggregates your data producing 1 value per “group”. The scalar format is used for the toplist, treemap, pie chart, and table widget, where each group refers to 1 shape (bar, rectangle, slice, or row respectively) in your graph.
- Use-cases: It’s best for displaying key performance indicators (KPIs) or summary statistics such as averages, sums, or percentiles. It provides a summary view of the current state or a specific metric. If you are not describing changes over time, use Scalar.
The Timeseries data format emphasizes data trends over time, while the Scalar format focuses on presenting single, computed values for quick assessments. Choose the Timeseries type if you need to visualize time on an axis or require individual time buckets. If not visualizing against time, select the Scalar type for performance.
Note: The “Formulas” prefix is used specifically for Scalar and Timeseries formats because they are compatible with the Functions API. The other formats, such as Histogram and List, do not support this API.
Import data from an existing widget
- Copy from an existing Datadog widget using
cmd+c. - Open the Wildcard widget full screen editor.
- Paste with
cmd+v. - Click Save.
Command palette
The command palette provides quick access to Wildcard widget tools. Activate with cmd + shift + p or click the info icon at the top of the page.
Data Preview
The Data Preview table shows the response, fields, and values from your data request that are available to use in your Vega-lite specification. To access, click the arrow at the bottom of the Wildcard widget editor to Show data preview. There are three types of tables in the preview:
- Request Rows: Displays your actual data.
- Request Columns: Displays column summary statistics and data types.
- Internal Tables: Displays transformed data stored by Vega-Lite.
Map Datadog data to Vega-Lite specifications
Datadog native widgets automatically map the query results to the visualization elements, but the Wildcard widget requires you to add a custom Vega-Lite specification that defines how the Datadog query maps to visual elements. This creates the potential for a mismatch. With Data Preview, you can verify that the Vega-Lite specification maps to the correct query response.
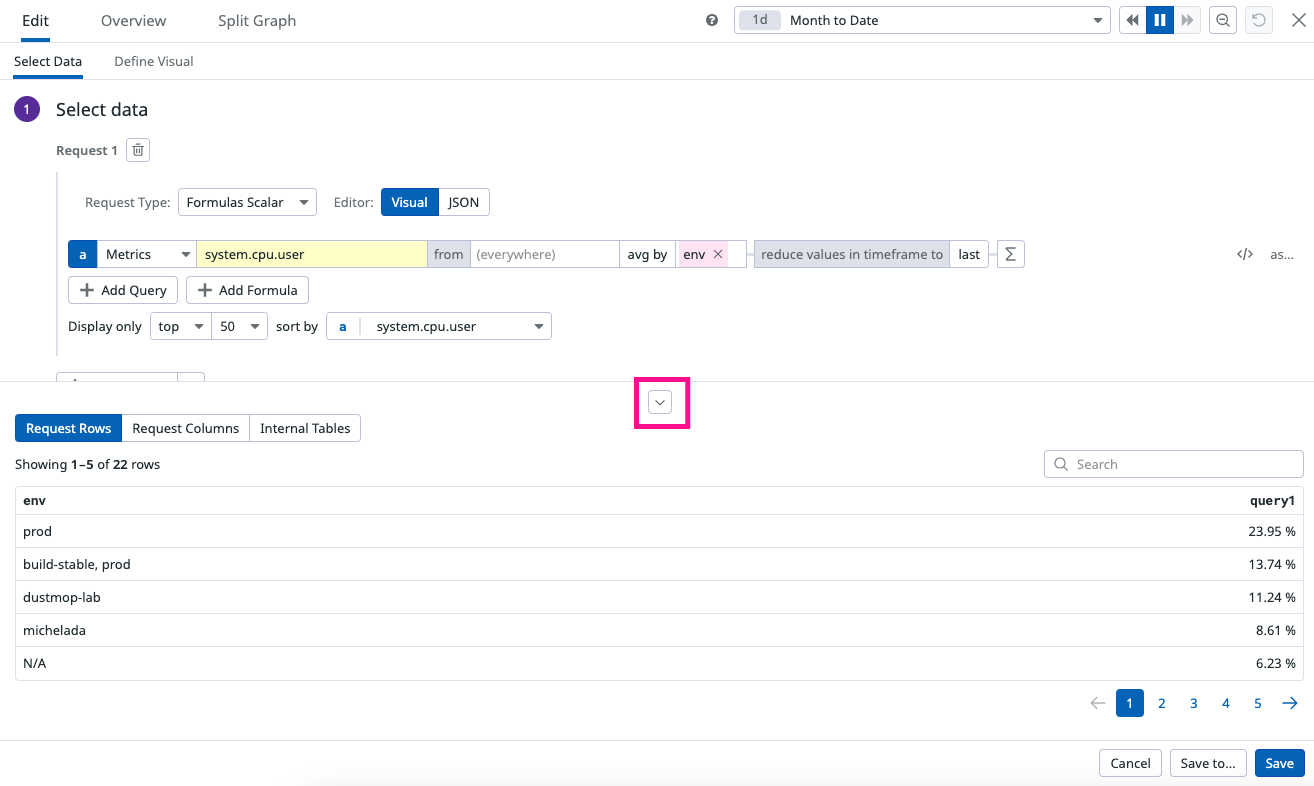
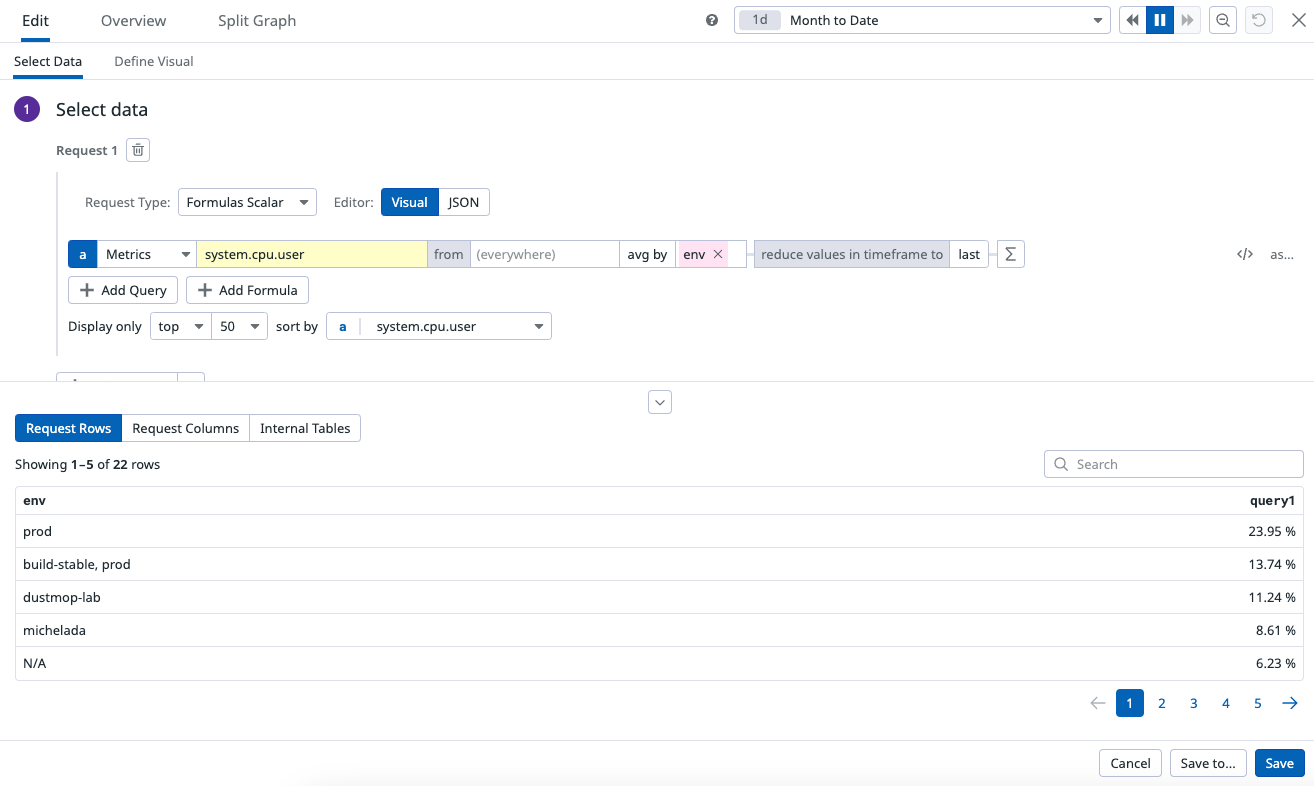
To see how Datadog values map to the Vega-Lite specification, start with the example metric query of system.cpu.user averaged by env:
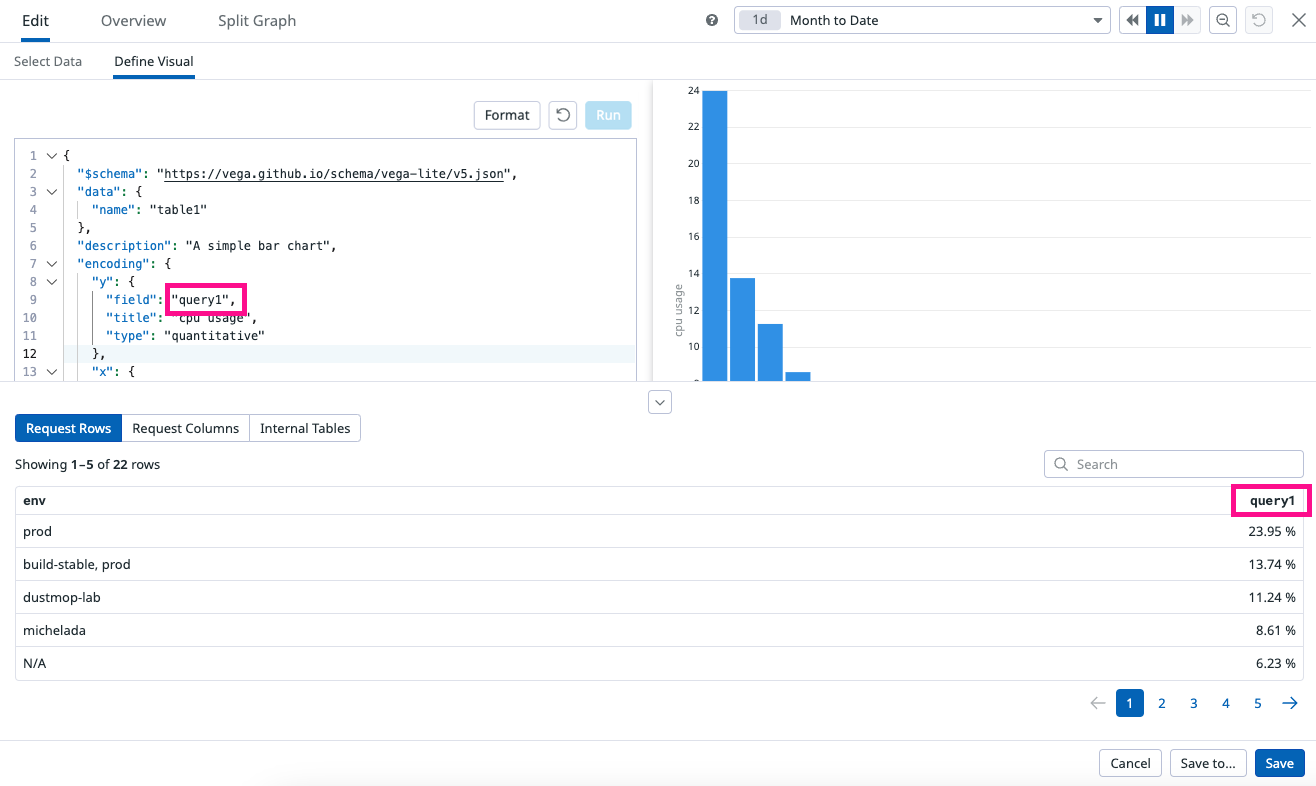
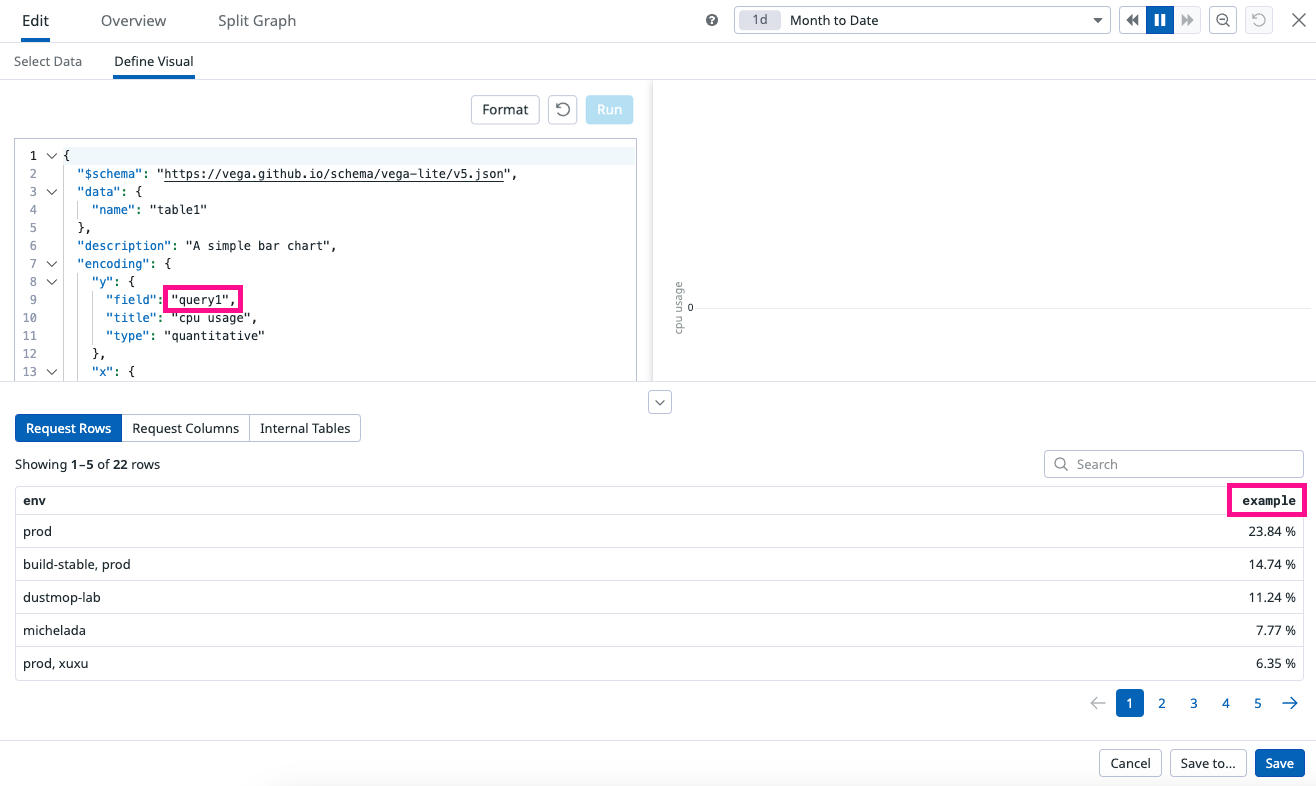
Click on the Define Visual tab to view how this query maps to Vega-Lite. Open the Data Preview panel and notice the matching query1 and env fields listed in the Vega-Lite specification and the Data Preview column.
  {
    "$schema": "https://vega.github.io/schema/vega-lite/v5.json",
    "data": {
      "name": "table1"
    },
    "encoding": {
      "x": {
        "field": "env",
        "type": "nominal"
      },
      "y": {
        "field": "query1",
        "type": "quantitative"
      }
    },
    "mark": {
      "type": "rect",
      "tooltip": {
        "content": "data"
      }
    }
}| Select data configuration | Define Visual Specification |
|---|---|
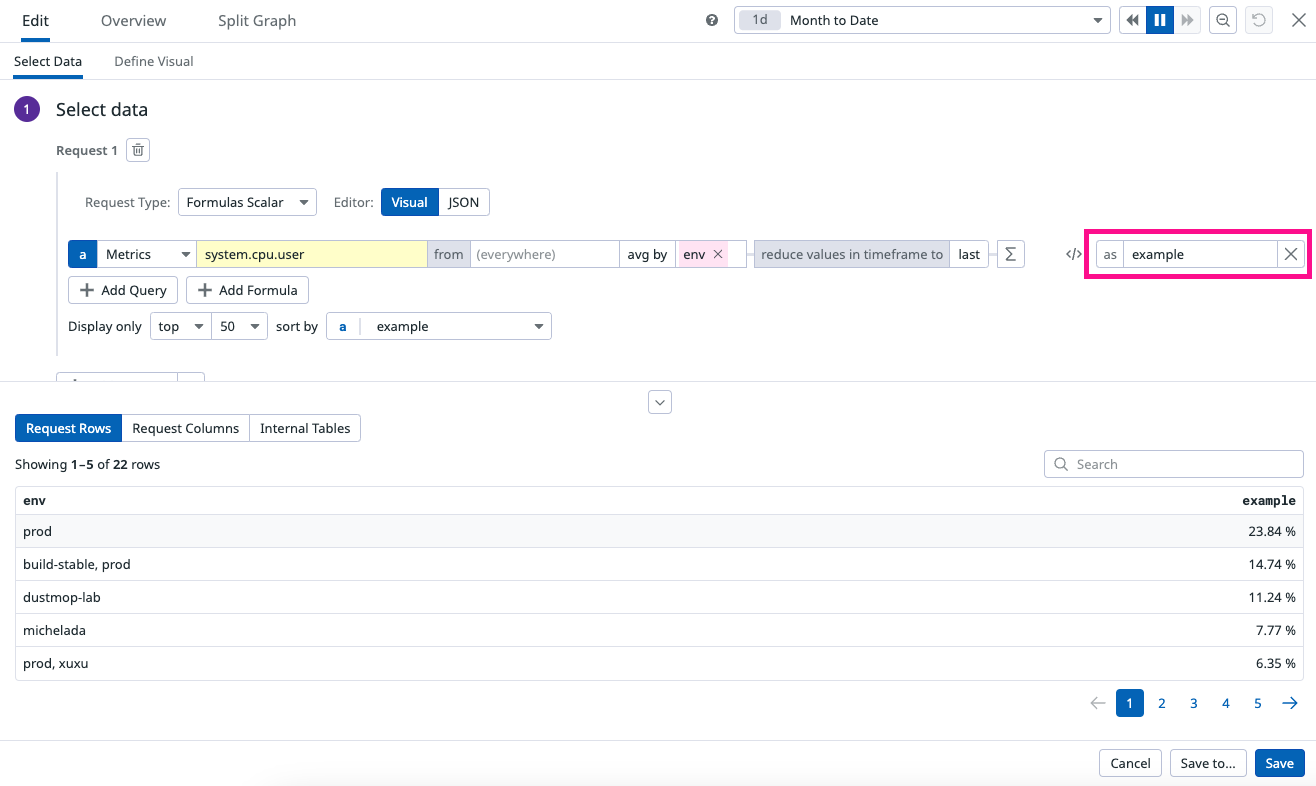
To demonstrate a mismatch between the Datadog data and the Vega-Lite specification, add an alias to the query. The visualization does not work because the Vega-lite specification still points to “query1”, but the Data Preview column shows that the new query is now the new alias “example”. To fix this visualization, you need to replace field:"query1" with field:"example".
| Select data configuration | Define Visual Specification |
|---|---|
Compatible data formats
The Wildcard Widget supports data requests from all data sources supported in native widgets:
| Request Type | Widgets that use this Request Type |
|---|---|
| Scalar Requests | Change, Pie Chart, Query Value, Scatter Plot, Table, Treemap, Top List, Distribution (of groups), Geomap |
| Timeseries Requests | Timeseries, Heatmap |
| Distribution Requests | Distribution (of points) |
| List requests | All “event” oriented data in the List widget |
Additional information
Choosing Between Vega and Vega-Lite
For simplicity and brevity, opt for Vega-Lite. The system supports Vega-Lite version 5.18.1. Reserve Vega for more complex or advanced visualization needs.
Terraform Integration
Use the datadog_dashboard_json resource when working with Wildcard widgets in Terraform dashboards.
Known Limitations
Avoid using Wildcard widgets for the following scenarios:
- Visualizations with high cardinality. If your visualizations have more than 5000 rows per request, consider pre-aggregating data on the backend before graphing.
- Network or hierarchical visualizations.
- Visuals requiring physics-based layouts.
- Advanced geographic mapping.
- 3D graphical representations.

