- 重要な情報
- はじめに
- 用語集
- Standard Attributes
- ガイド
- インテグレーション
- エージェント
- OpenTelemetry
- 開発者
- Administrator's Guide
- API
- Partners
- DDSQL Reference
- モバイルアプリケーション
- CoScreen
- CoTerm
- Remote Configuration
- Cloudcraft
- アプリ内
- ダッシュボード
- ノートブック
- DDSQL Editor
- Reference Tables
- Sheets
- Watchdog
- アラート設定
- メトリクス
- Bits AI
- Internal Developer Portal
- Error Tracking
- Change Tracking
- Service Management
- Actions & Remediations
- インフラストラクチャー
- Cloudcraft
- Resource Catalog
- ユニバーサル サービス モニタリング
- Hosts
- コンテナ
- Processes
- サーバーレス
- ネットワークモニタリング
- Cloud Cost
- アプリケーションパフォーマンス
- APM
- Continuous Profiler
- データベース モニタリング
- Data Streams Monitoring
- Data Jobs Monitoring
- Data Observability
- Digital Experience
- RUM & セッションリプレイ
- Synthetic モニタリング
- Continuous Testing
- Product Analytics
- Software Delivery
- CI Visibility (CI/CDの可視化)
- CD Visibility
- Deployment Gates
- Test Visibility
- Code Coverage
- Quality Gates
- DORA Metrics
- Feature Flags
- セキュリティ
- セキュリティの概要
- Cloud SIEM
- Code Security
- クラウド セキュリティ マネジメント
- Application Security Management
- Workload Protection
- Sensitive Data Scanner
- AI Observability
- ログ管理
- Observability Pipelines(観測データの制御)
- ログ管理
- CloudPrem
- 管理
Watchdog Explains
このページは日本語には対応しておりません。随時翻訳に取り組んでいます。
翻訳に関してご質問やご意見ございましたら、お気軽にご連絡ください。
翻訳に関してご質問やご意見ございましたら、お気軽にご連絡ください。
Overview
Watchdog Explains is an investigation assistant that detects anomalies on timeseries graphs and identifies which tags contribute to them. This allows you to immediately focus your investigation on problematic areas of your infrastructure or software stack.
To disable Watchdog Explains, see Disabling anomaly detection.
Watchdog Explains is available for Timeseries widgets with Metric data (avg, sum, min, and max aggregation).
How Watchdog Explains detects anomalies
Watchdog Explains applies anomaly detection to graphs on your dashboard by analyzing both the shape and value of the underlying timeseries. It identifies deviations from historical patterns, flagging spikes, dips, or gradual drifts that don’t align with expected behavior.
To account for seasonality, the algorithm looks back up to three weeks in time. For example, if a spike appears on a Monday at 9:00 a.m., Watchdog compares that datapoint against previous Mondays at the same hour. If similar patterns appear consistently, the spike is treated as seasonal and not flagged as an anomaly. This helps reduce false positives and ensures that only unexpected deviations are surfaced.
Anomalies can be sharp spikes or drops, but may also be more subtle trends like step changes or slope shifts.
Anomaly detection in Watchdog Explains works with Metrics data (avg, sum, min, and max aggregation).
Watchdog Explains isolates the cause with dimensional analysis
You can start your investigation from any timeseries graph that uses metric data. When Watchdog Explains detects an anomaly, it highlights the affected region with a pink box. To begin investigating, click Investigate Anomaly.
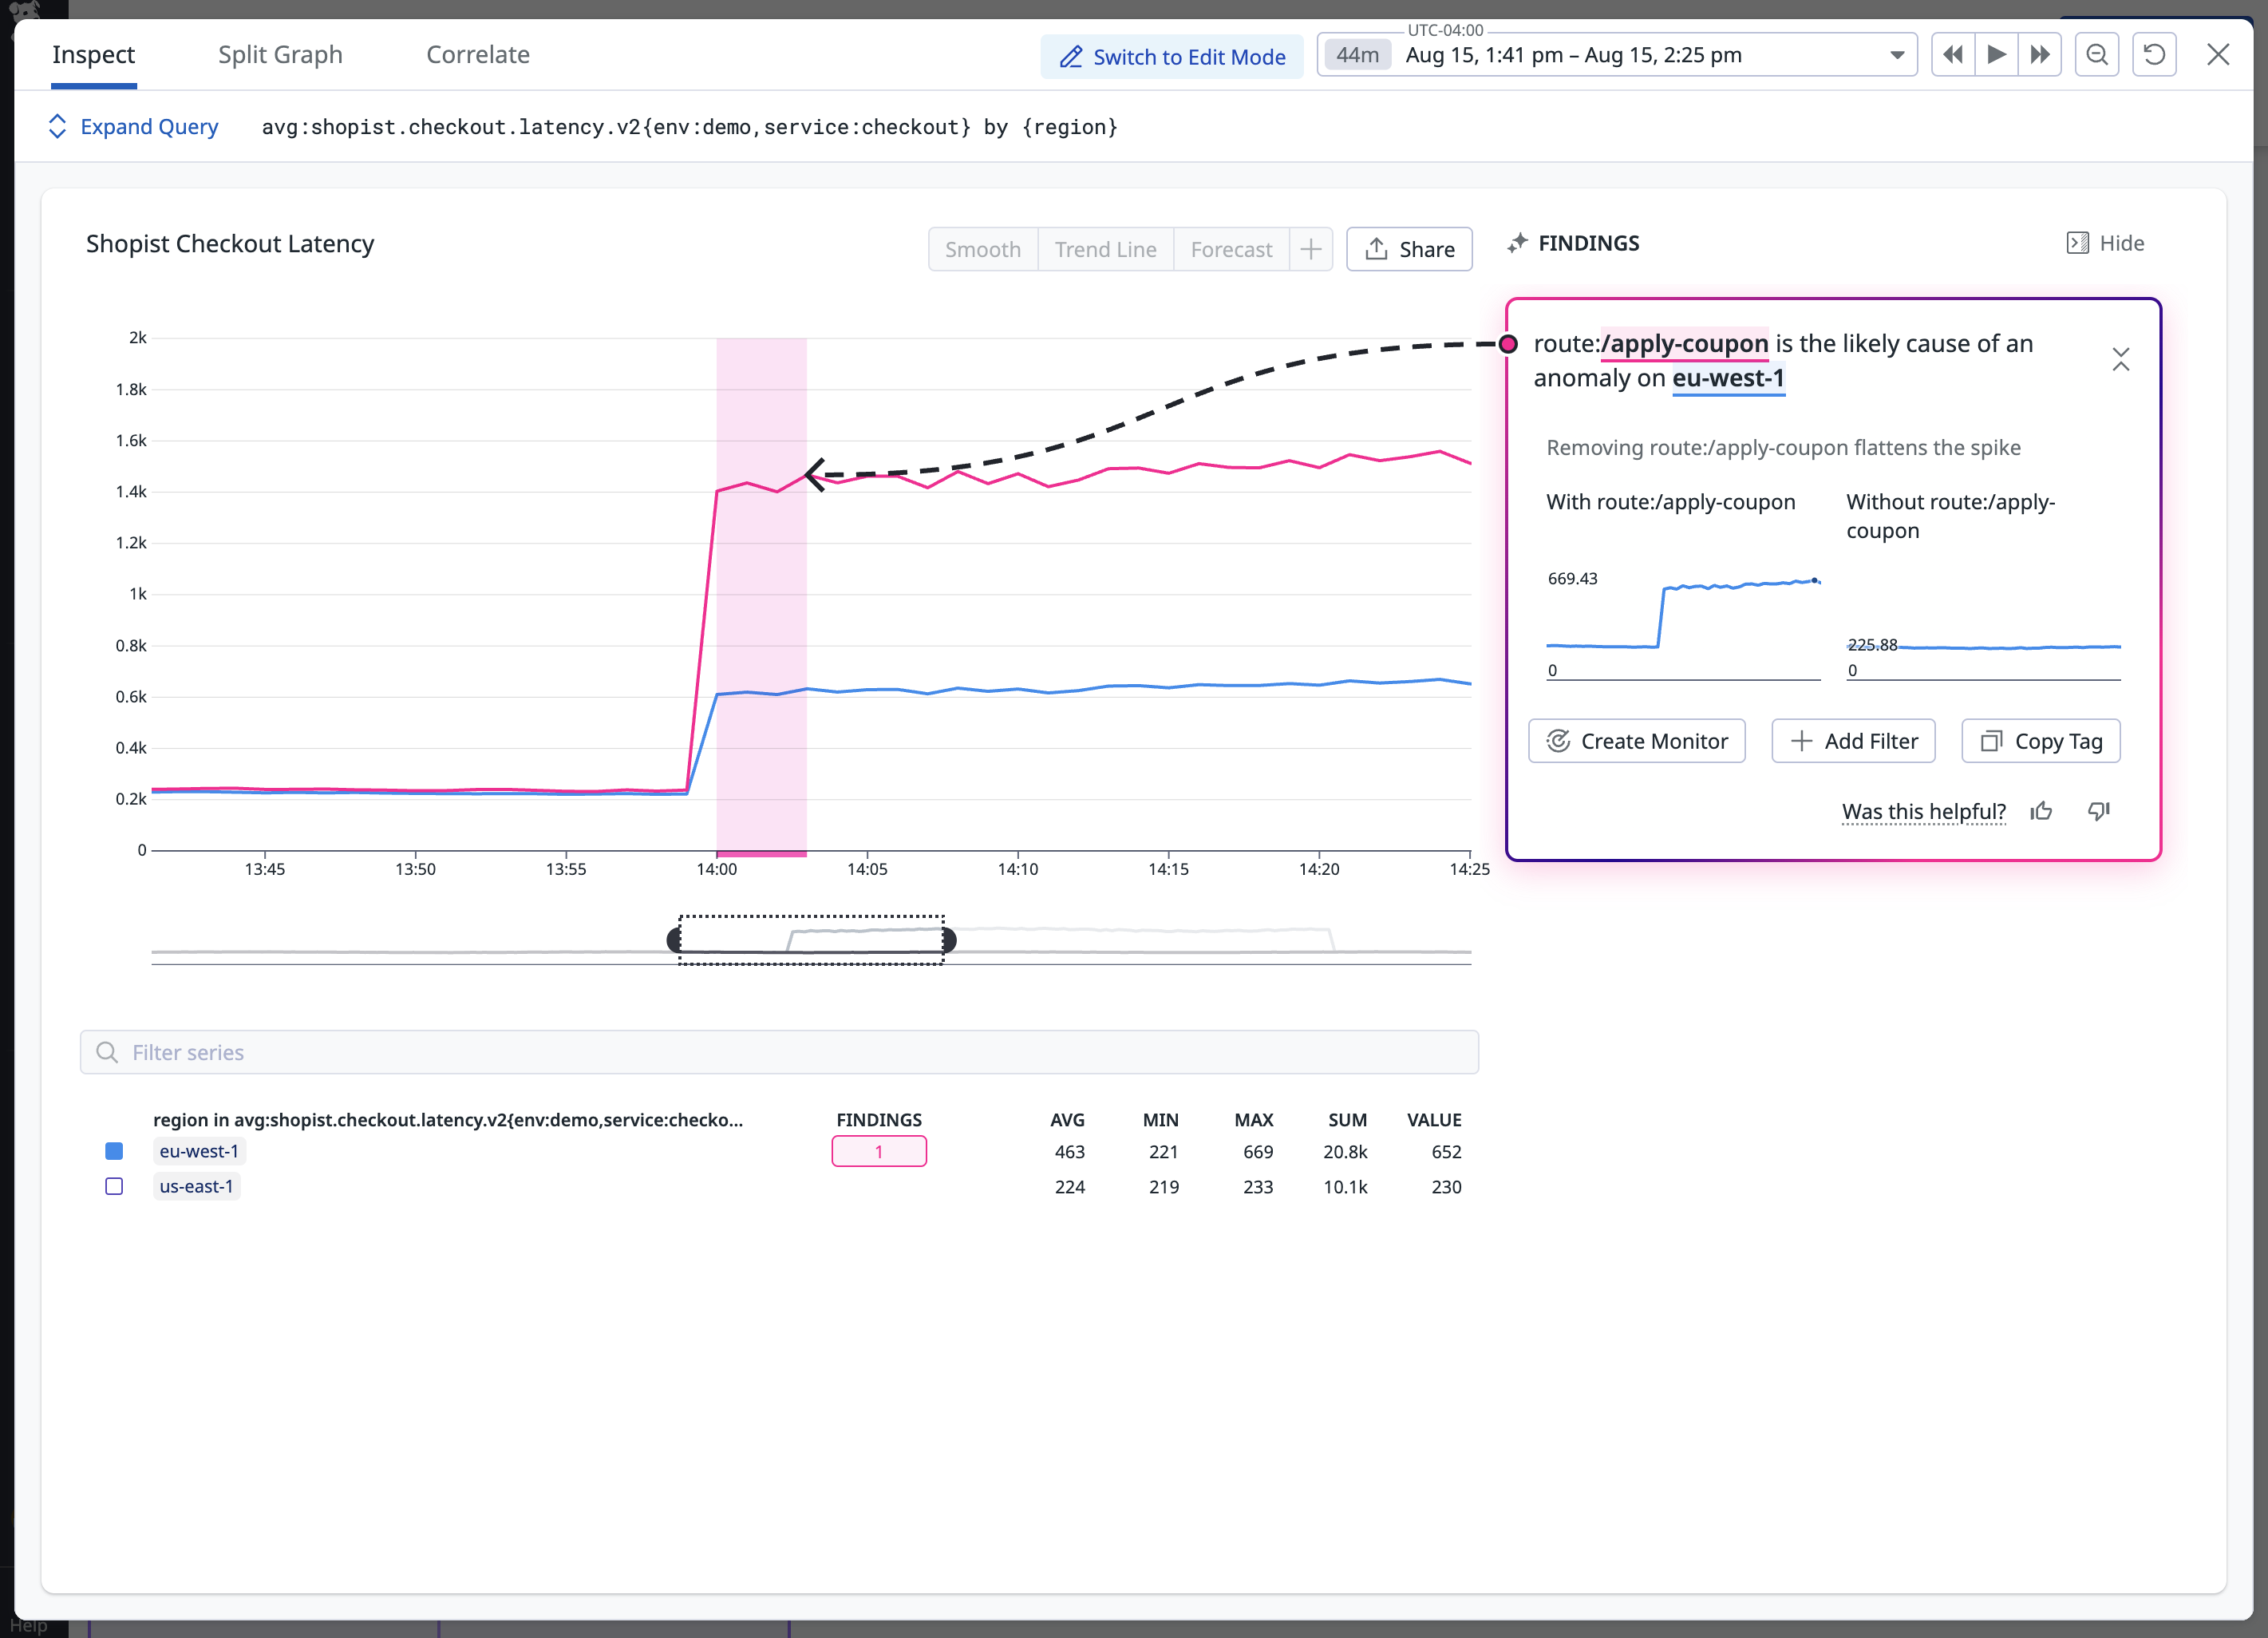
This opens a full-screen investigation view. Watchdog analyzes the anomaly and surfaces any tag groups that significantly contributed to the shape or scale of the anomaly. Click on a tag to see how removing or isolating that dimension affects the graph. Use this to identify root causes like specific customers, services, or environments.
Disabling anomaly detection
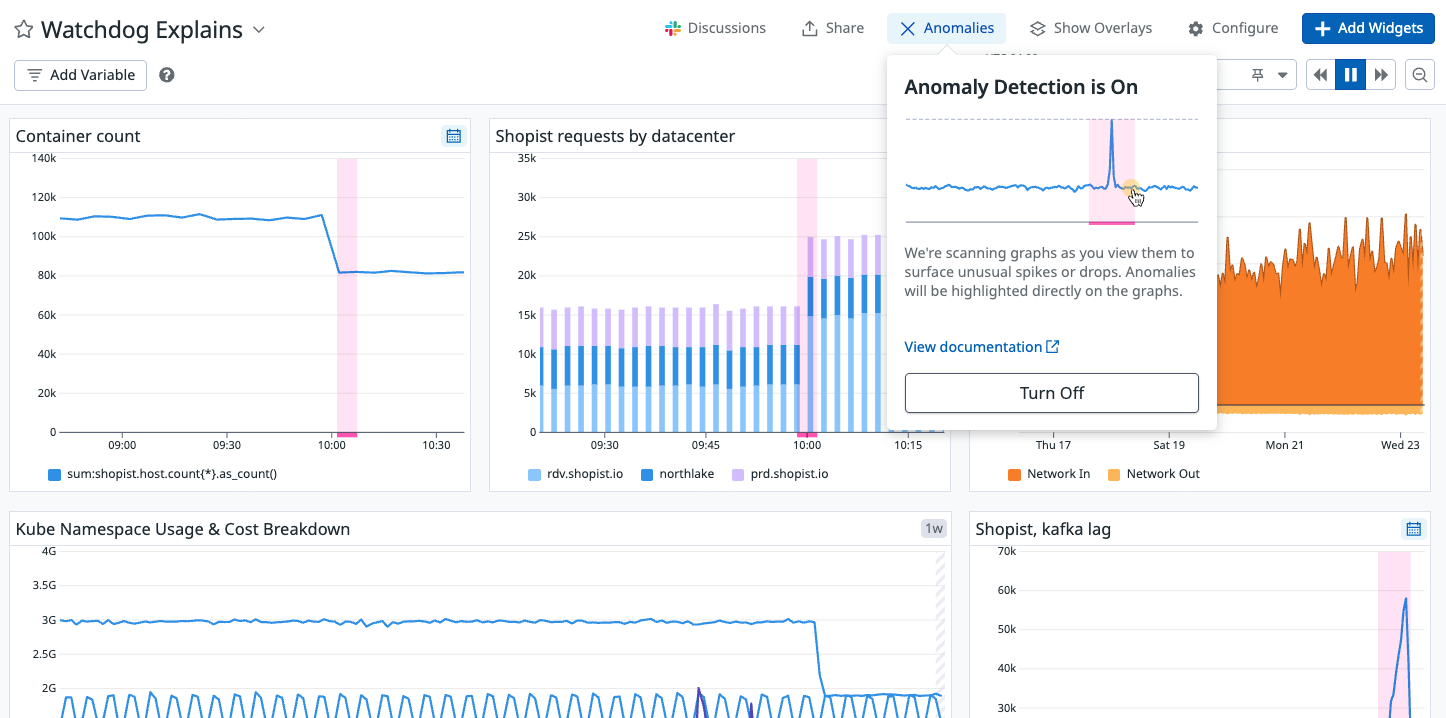
You can disable anomaly scanning on any dashboard. This only affects your view, other dashboard viewers still see anomalies unless they turn it off.
To disable anomaly detection on a dashboard, open Anomalies at the top of the dashboard and click Turn Off.


