- 重要な情報
- はじめに
- 用語集
- Standard Attributes
- ガイド
- インテグレーション
- エージェント
- OpenTelemetry
- 開発者
- Administrator's Guide
- API
- Partners
- DDSQL Reference
- モバイルアプリケーション
- CoScreen
- CoTerm
- Remote Configuration
- Cloudcraft
- アプリ内
- ダッシュボード
- ノートブック
- DDSQL Editor
- Reference Tables
- Sheets
- Watchdog
- アラート設定
- メトリクス
- Bits AI
- Internal Developer Portal
- Error Tracking
- Change Tracking
- Service Management
- Actions & Remediations
- インフラストラクチャー
- Cloudcraft
- Resource Catalog
- ユニバーサル サービス モニタリング
- Hosts
- コンテナ
- Processes
- サーバーレス
- ネットワークモニタリング
- Cloud Cost
- アプリケーションパフォーマンス
- APM
- Continuous Profiler
- データベース モニタリング
- Data Streams Monitoring
- Data Jobs Monitoring
- Data Observability
- Digital Experience
- RUM & セッションリプレイ
- Synthetic モニタリング
- Continuous Testing
- Product Analytics
- Software Delivery
- CI Visibility (CI/CDの可視化)
- CD Visibility
- Deployment Gates
- Test Visibility
- Code Coverage
- Quality Gates
- DORA Metrics
- Feature Flags
- セキュリティ
- セキュリティの概要
- Cloud SIEM
- Code Security
- クラウド セキュリティ マネジメント
- Application Security Management
- Workload Protection
- Sensitive Data Scanner
- AI Observability
- ログ管理
- Observability Pipelines(観測データの制御)
- ログ管理
- CloudPrem
- 管理
Metric Correlations
このページは日本語には対応しておりません。随時翻訳に取り組んでいます。
翻訳に関してご質問やご意見ございましたら、お気軽にご連絡ください。
翻訳に関してご質問やご意見ございましたら、お気軽にご連絡ください。
Overview
Metric Correlations is available for Timeseries widgets with the Metric data source.
Metric Correlations can help you find potential root causes for an observed issue by searching for other metrics that exhibited irregular behavior around the same time. Correlations scans your metrics from different sources such as dashboards, integrations, APM, and custom metrics.
Find correlated metrics
You can start your metric correlations exploration from any of your dashboards, notebooks, APM, Watchdog alerts, or monitor status pages.
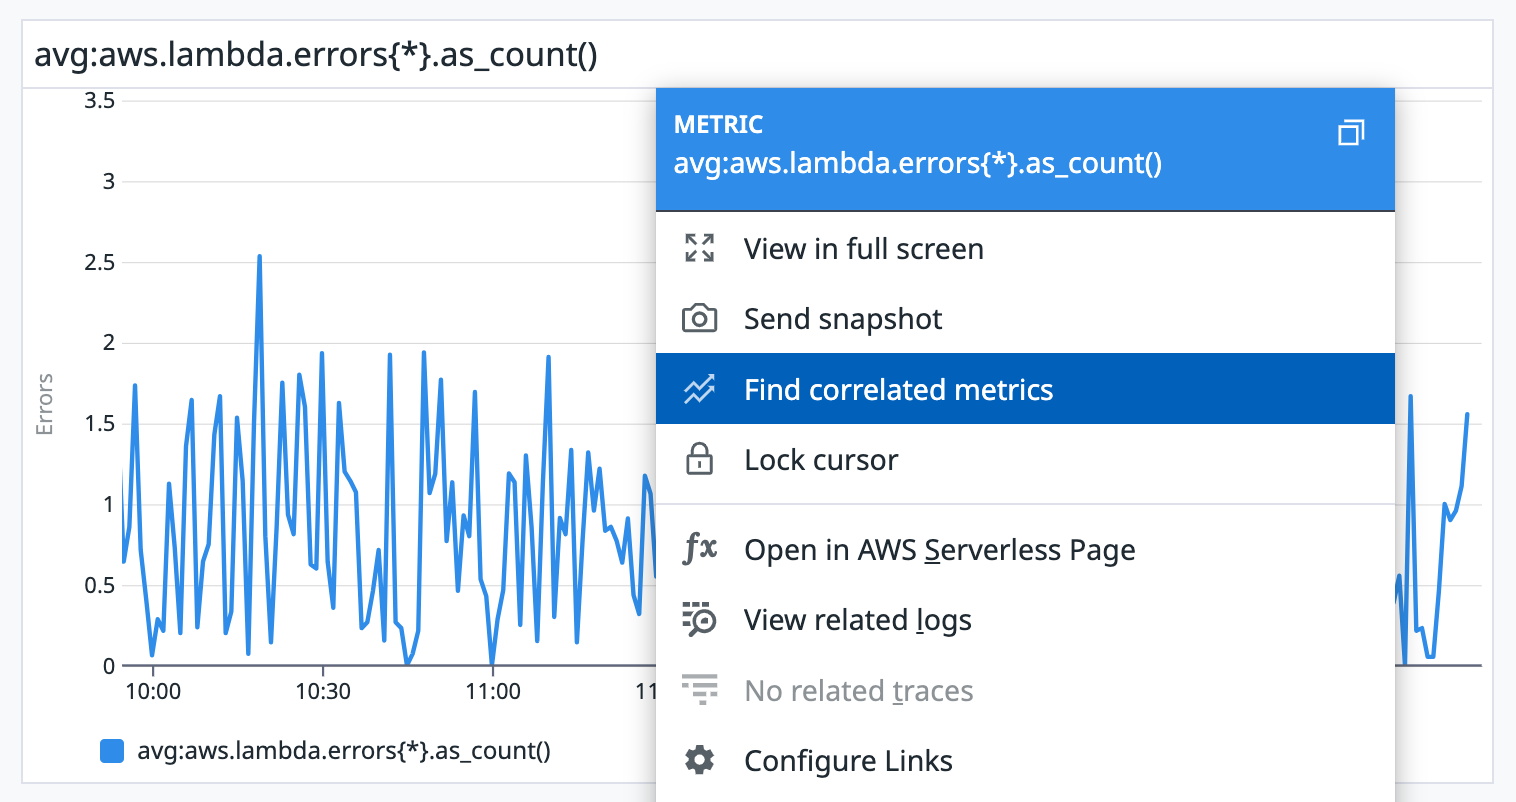
- Left click on any graph and select Find correlated metrics.
- From a full-screen graph, click the Correlations tab.
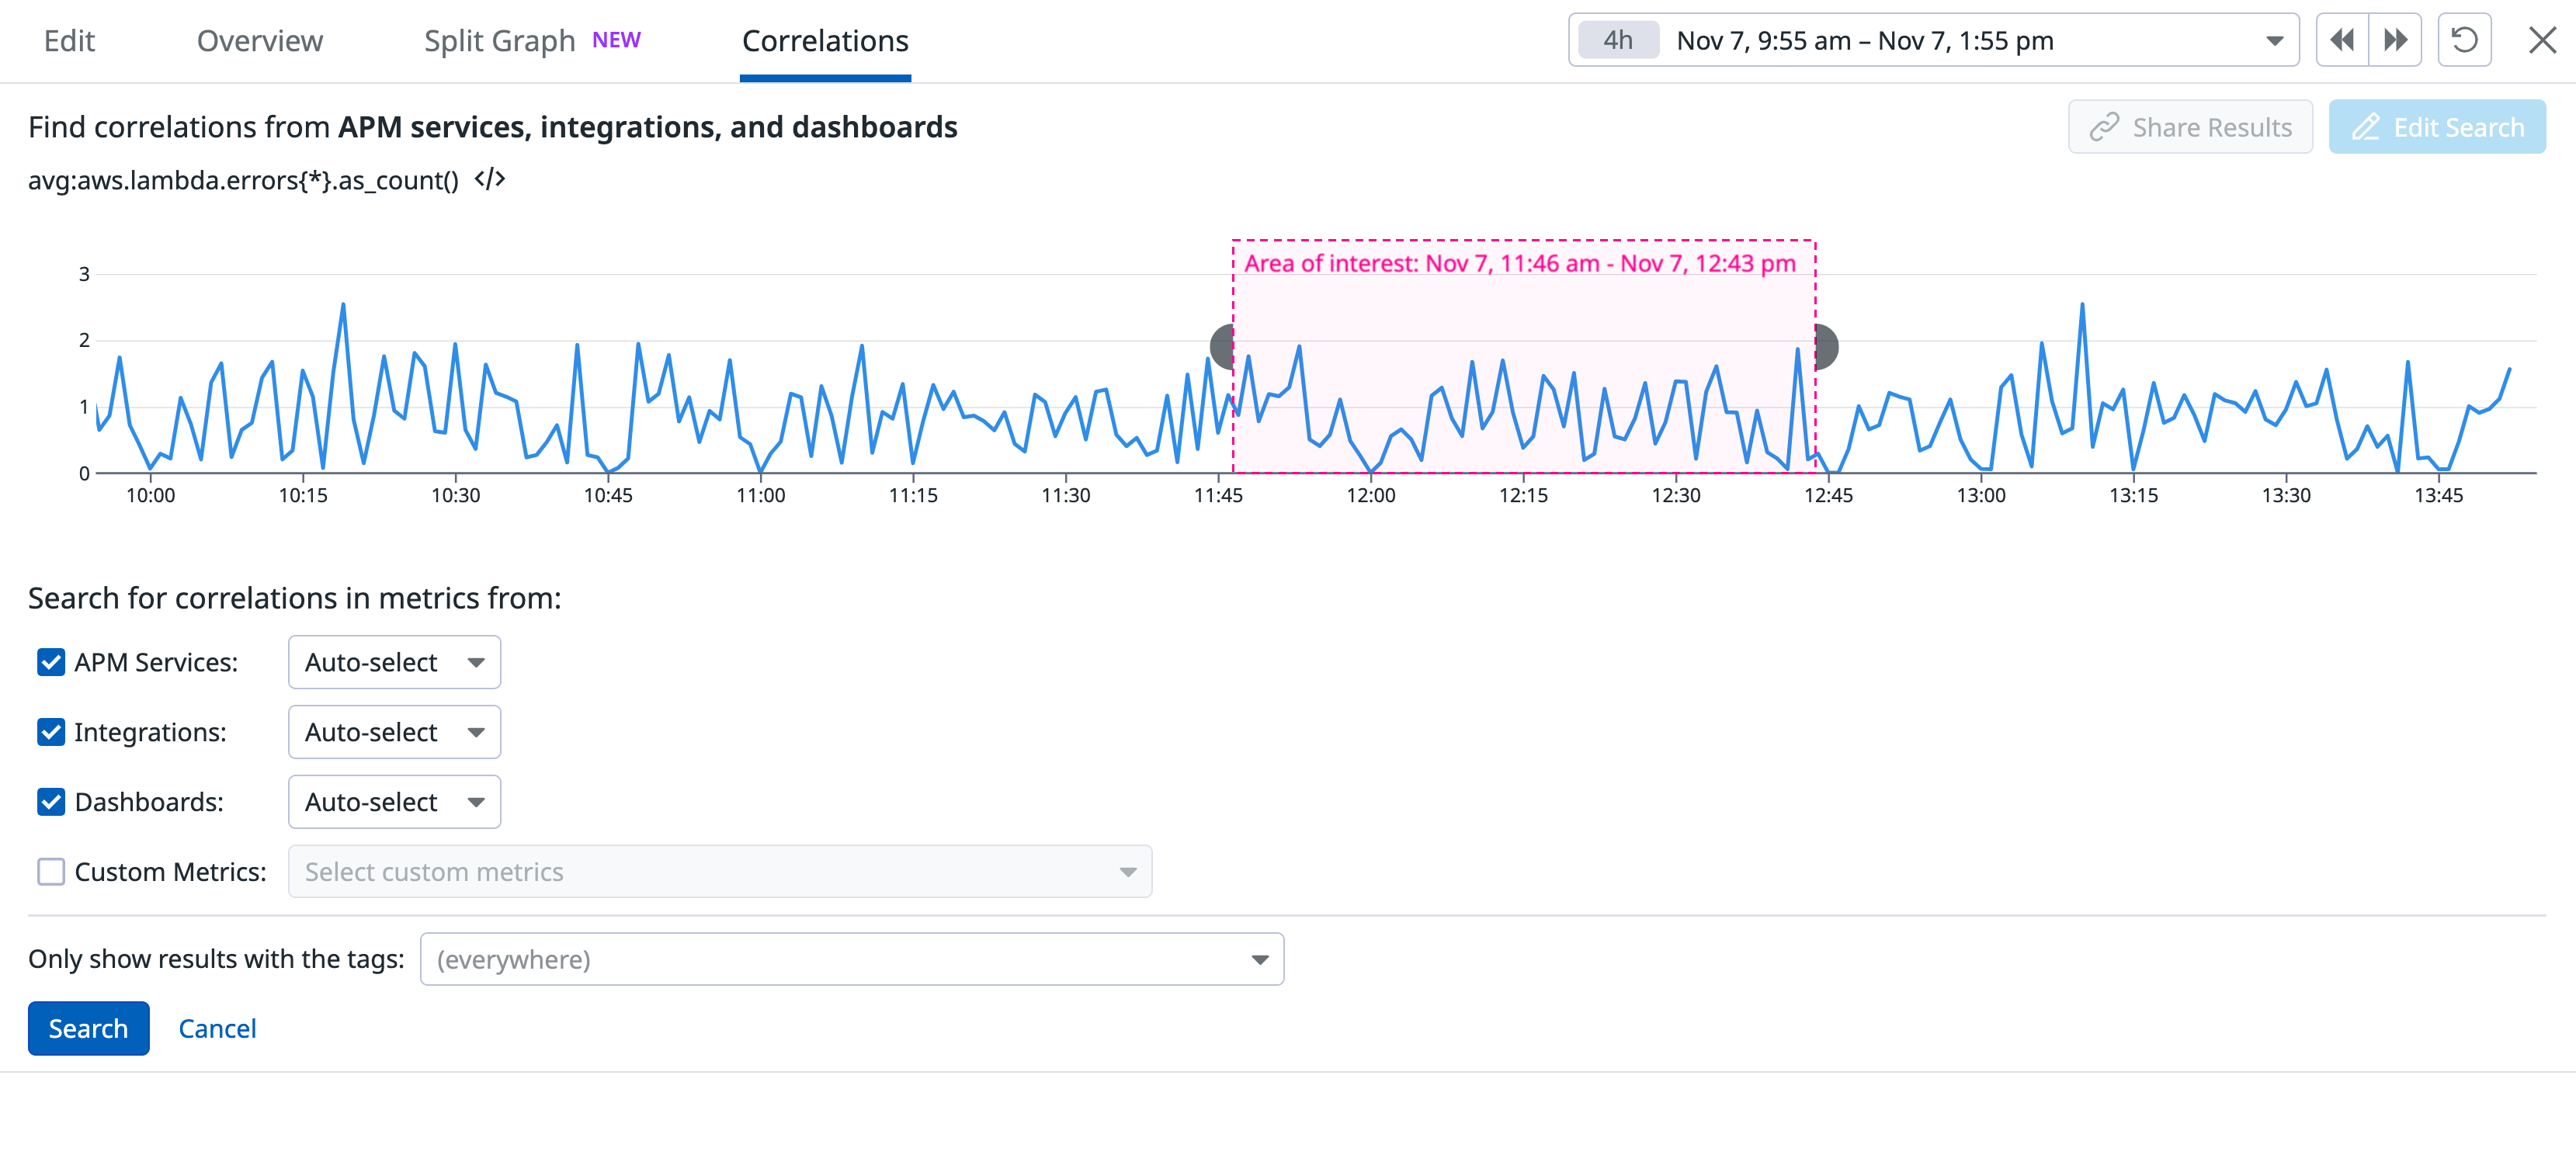
Correlations tries to automatically detect the area of interest (anomalous behavior) for your metric. If the area of interest is not selected automatically or needs adjustment, you can manually draw the area of interest from the edit search option. Datadog searches for other metrics that exhibit anomalous behavior at times matching the area of interest.
Note: Correlation searches are available for a single metric. For graphs with multiple metrics, select the series of interest. From a full-screen graph, select one series on the graph legend, then click the Correlations tab.
Customize your search
You can customize the default search parameters of correlations. From a full-screen graph, on the Correlations tab, click the Edit Search button, or click directly on the graph.
- Click and drag on the graph to set the time frame for your correlations search.
- Define the sources you want correlations to search from (APM services, integrations, dashboards, or custom metrics).
- Select Auto-select or Custom select from specific categories. For custom metrics, at least one selection is required.
- Custom metrics is the only category not selected by default. Choose metric namespaces or single metrics to search correlations upon.
- Use the tag filter box to scope the search by a tag.
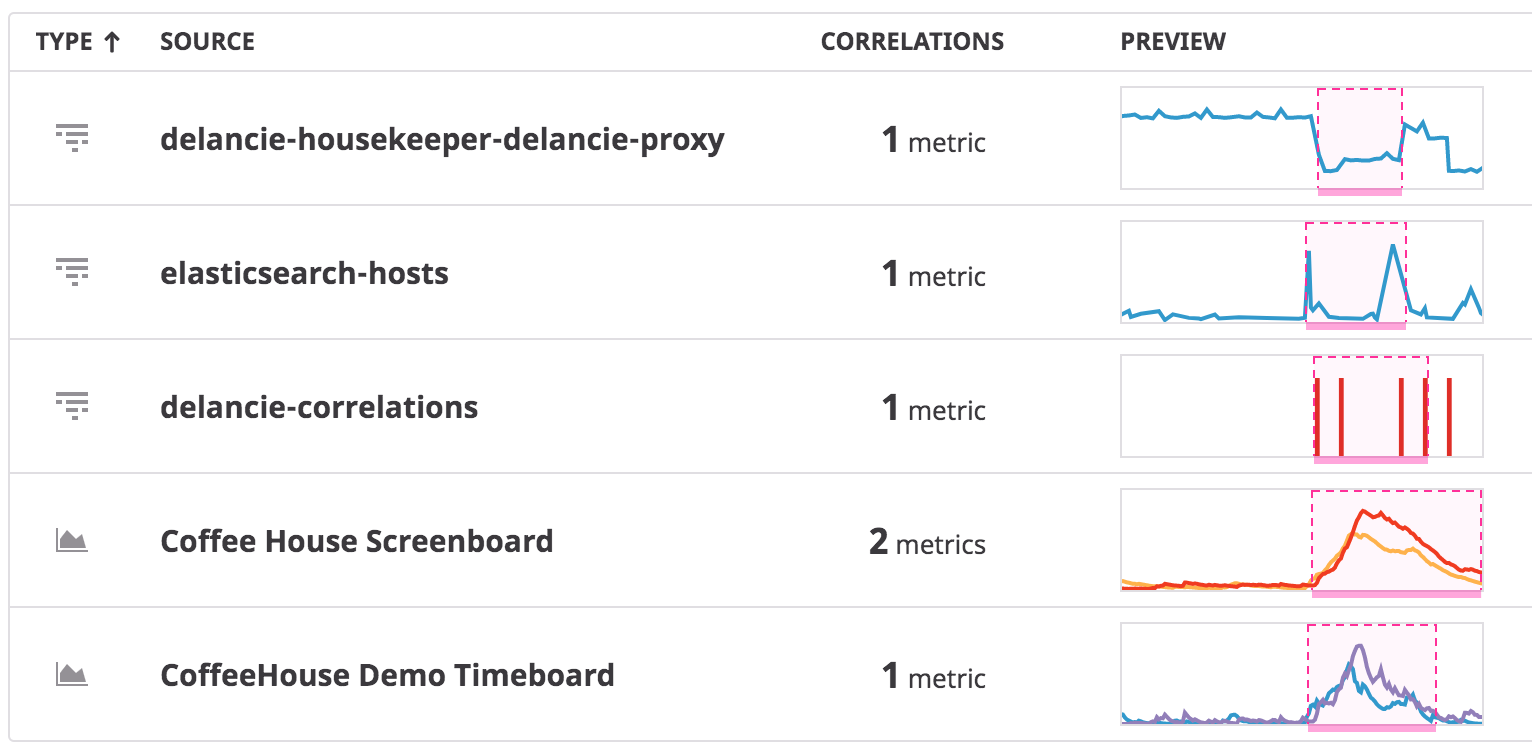
A list of search results is displayed below the search graph with the following:
- Type: A graphic representing the source type (APM service, integration, dashboard, or custom metric).
- Source: The name of the source for the correlated metrics.
- Correlations: The number of correlated metrics found.
- Preview: A preview graph of the correlated metrics.
As results load, you can explore the details without waiting for all results.
Investigate
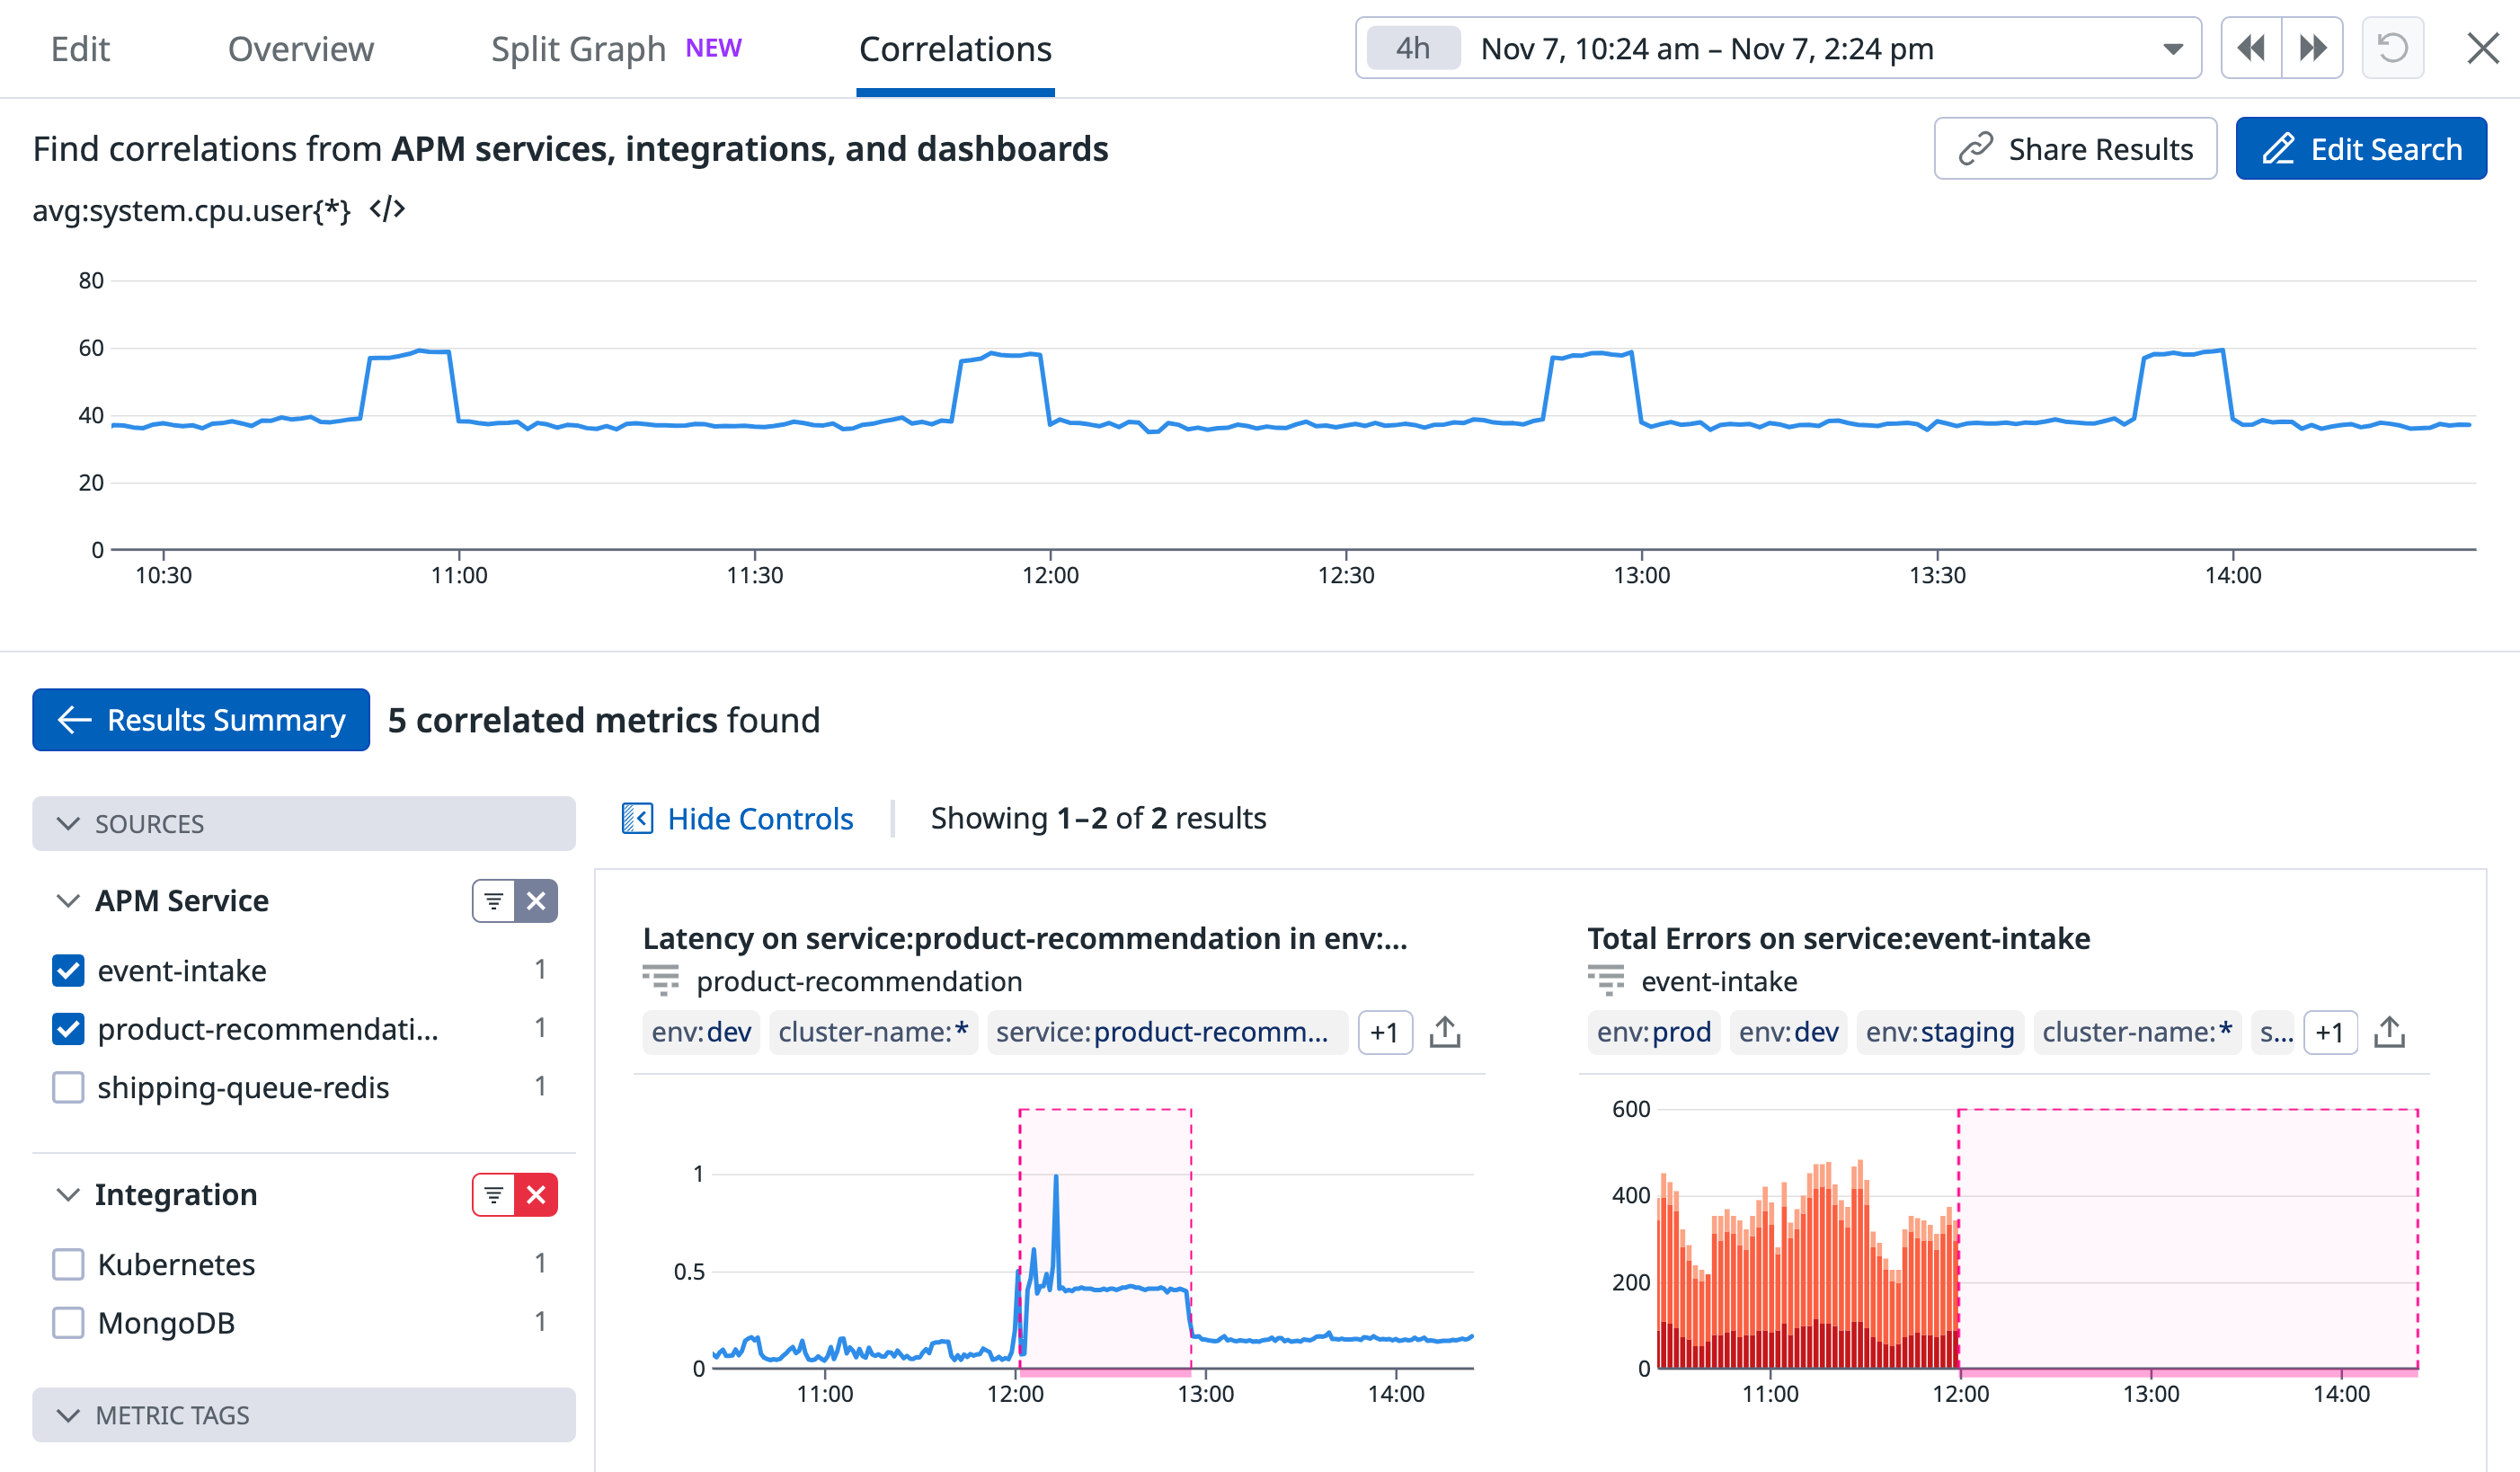
From the results list, select a row to investigate the details of that correlation.
- Similar to dashboards, hovering over a graph creates a time-synced line on all other graphs.
- To view all sources, remove the filter in the menu.
- Sources for each metric are linked by name. For example, dashboard names link to the dashboard.
- Use the export icon to export the graph to a dashboard, notebook, or copy the query.


