Suricata - Network Protocols
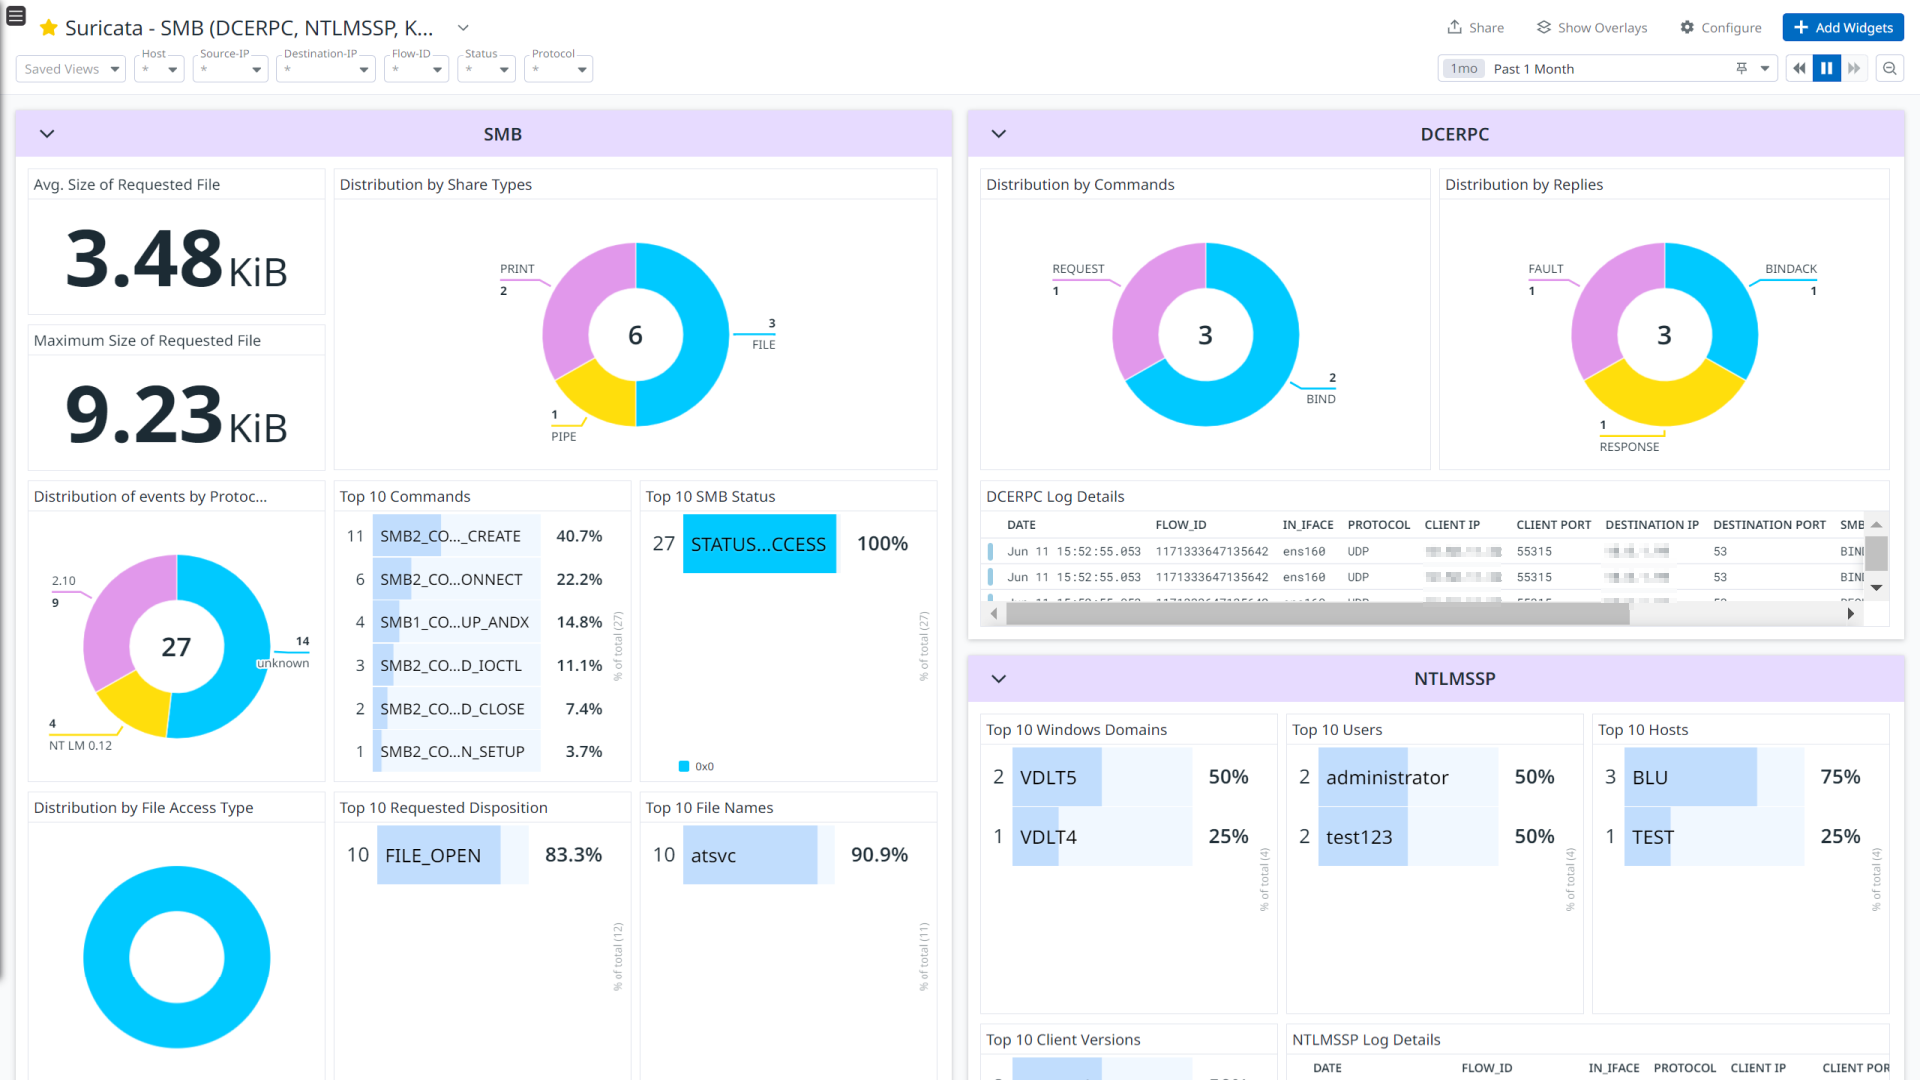
Suricata - SMB (DCERPC, NTLMSSP, Kerberos)
Overview
Suricata is a high performance, open source network analysis and threat detection software used by most private and public organizations, and embedded by major vendors to protect their assets.
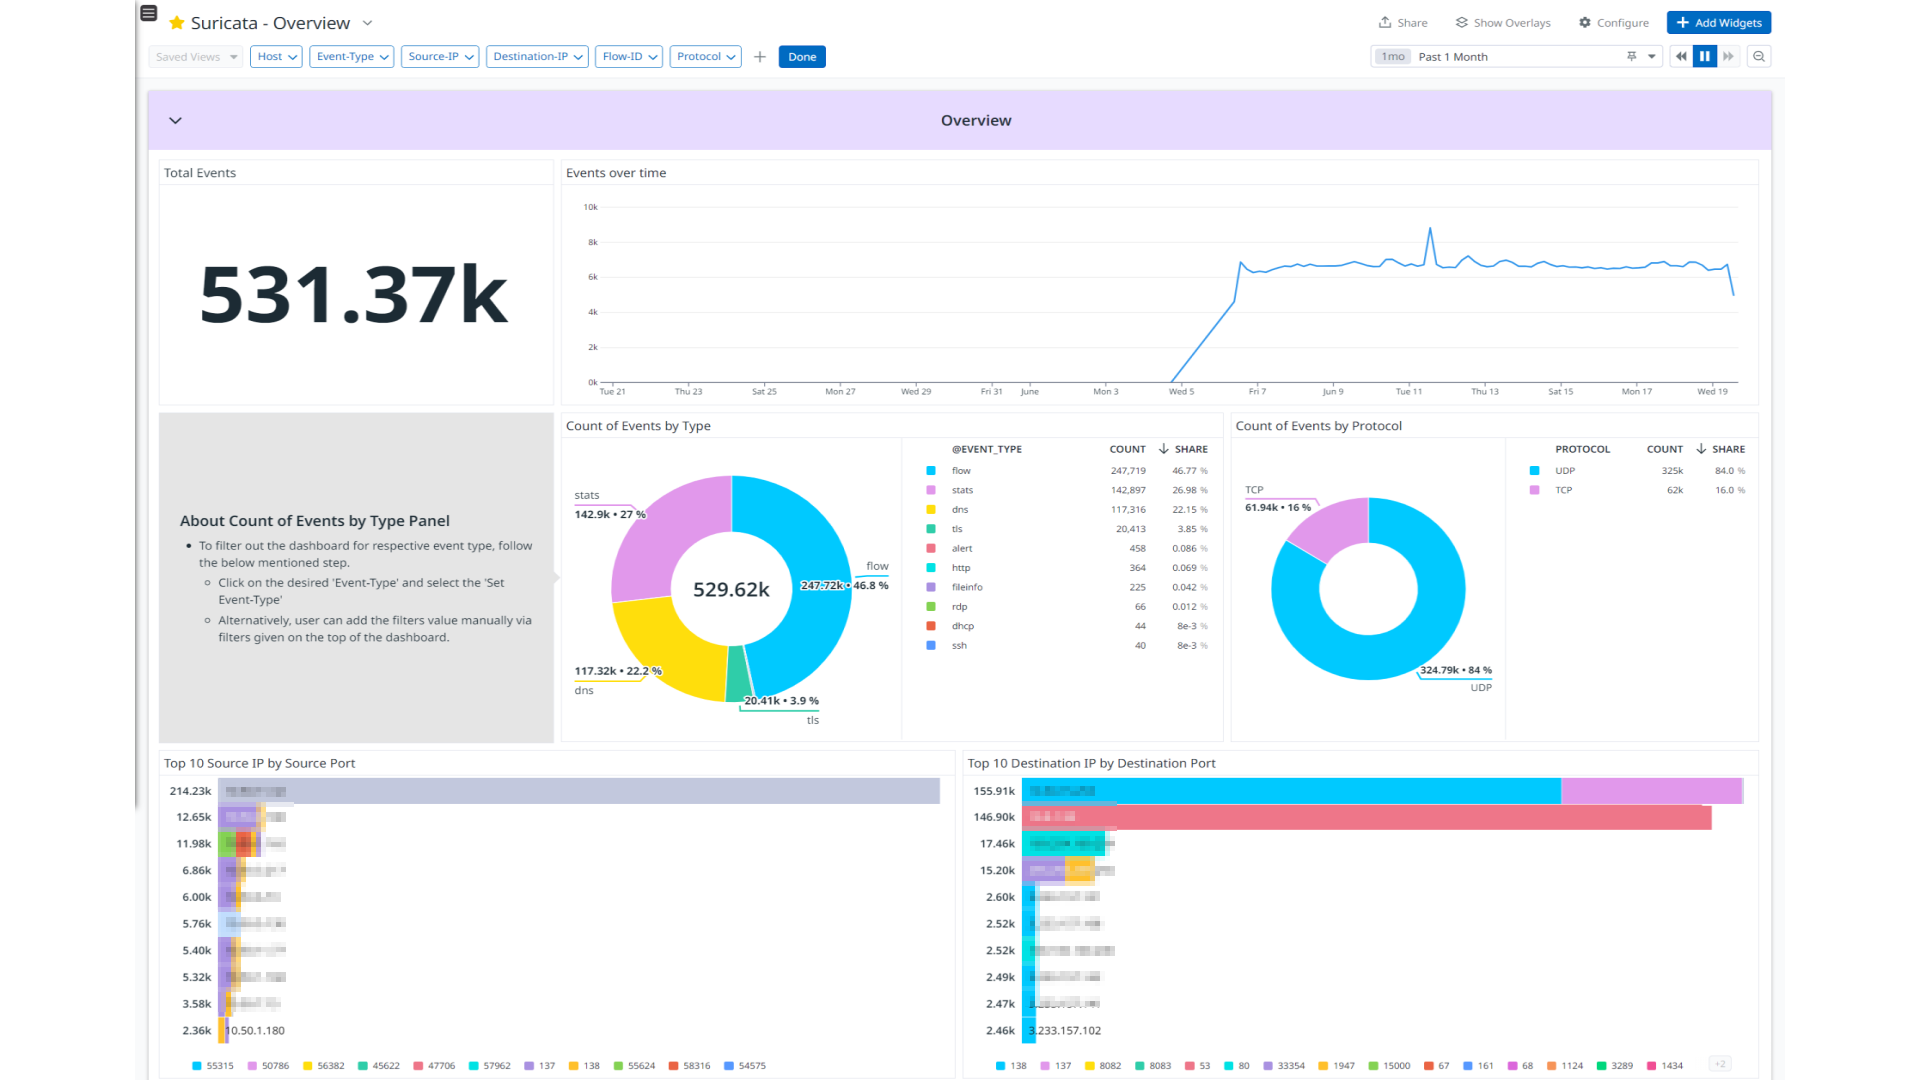
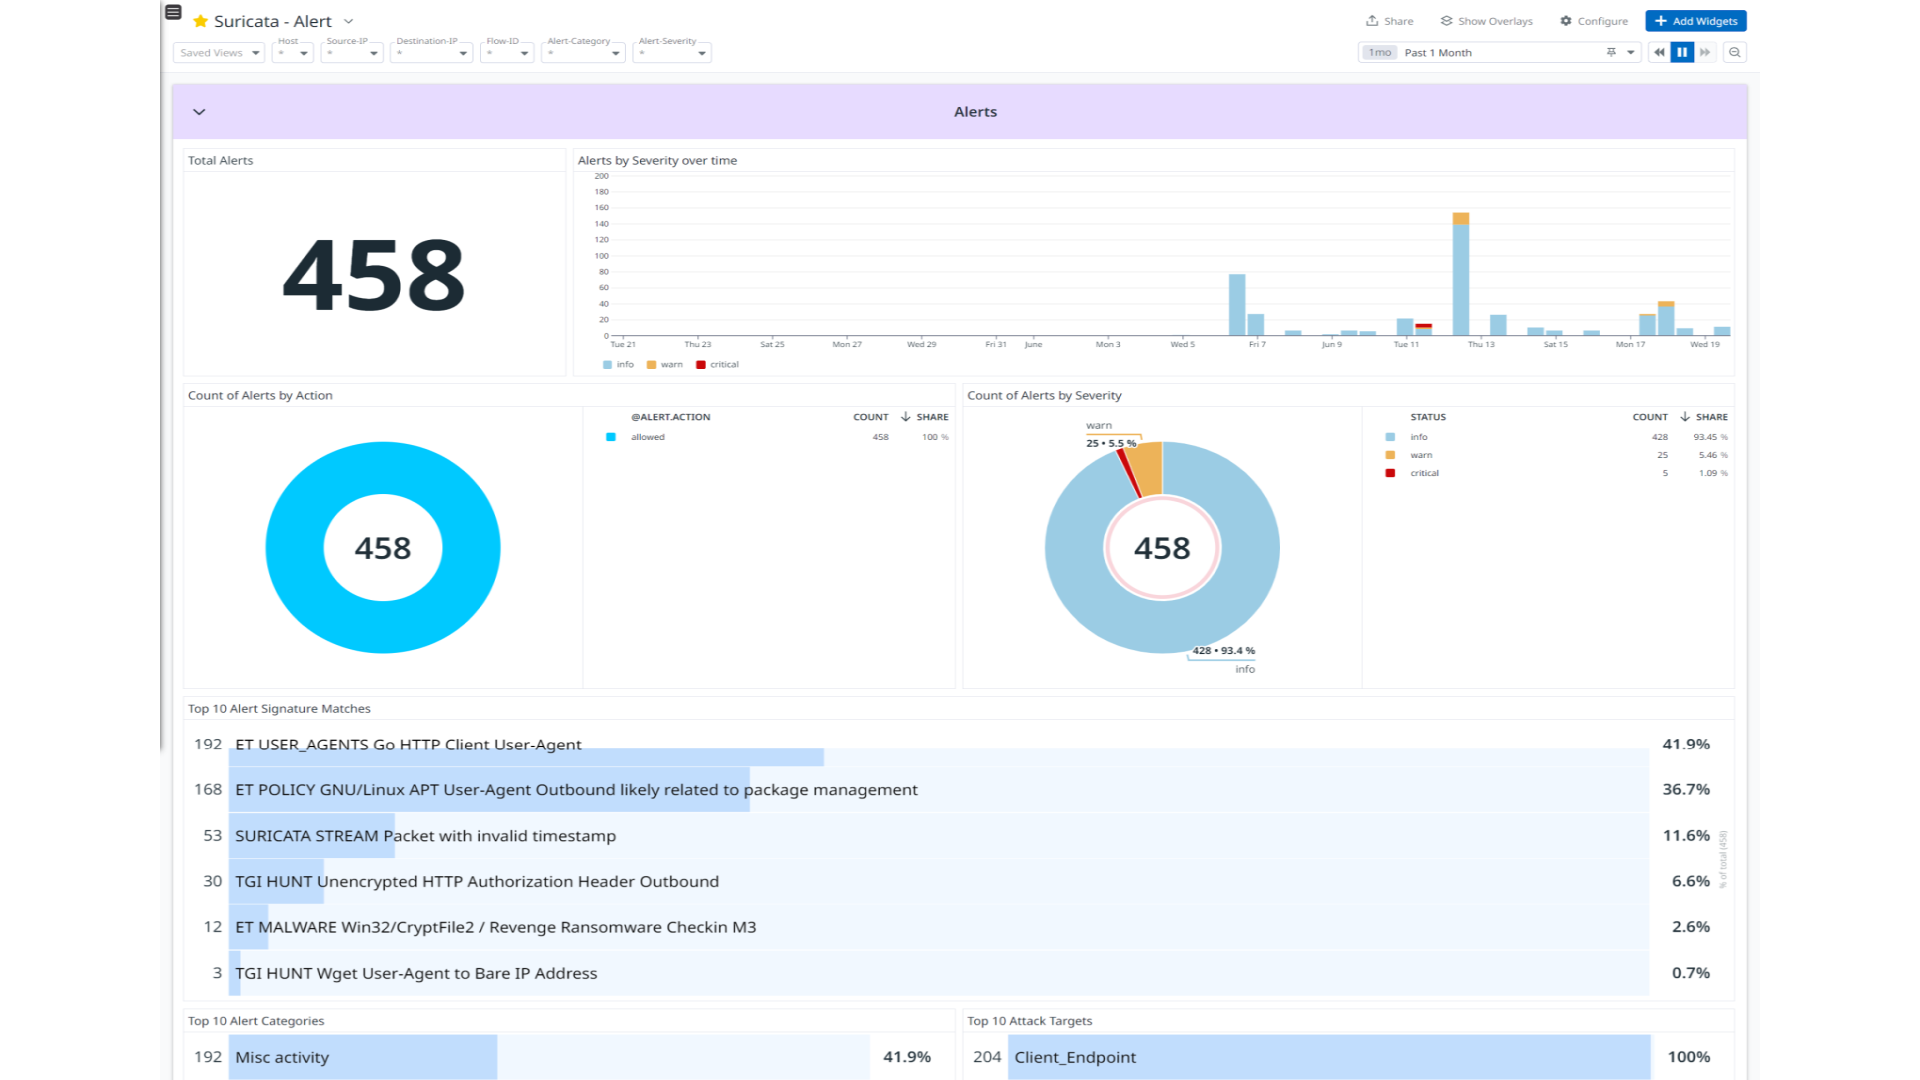
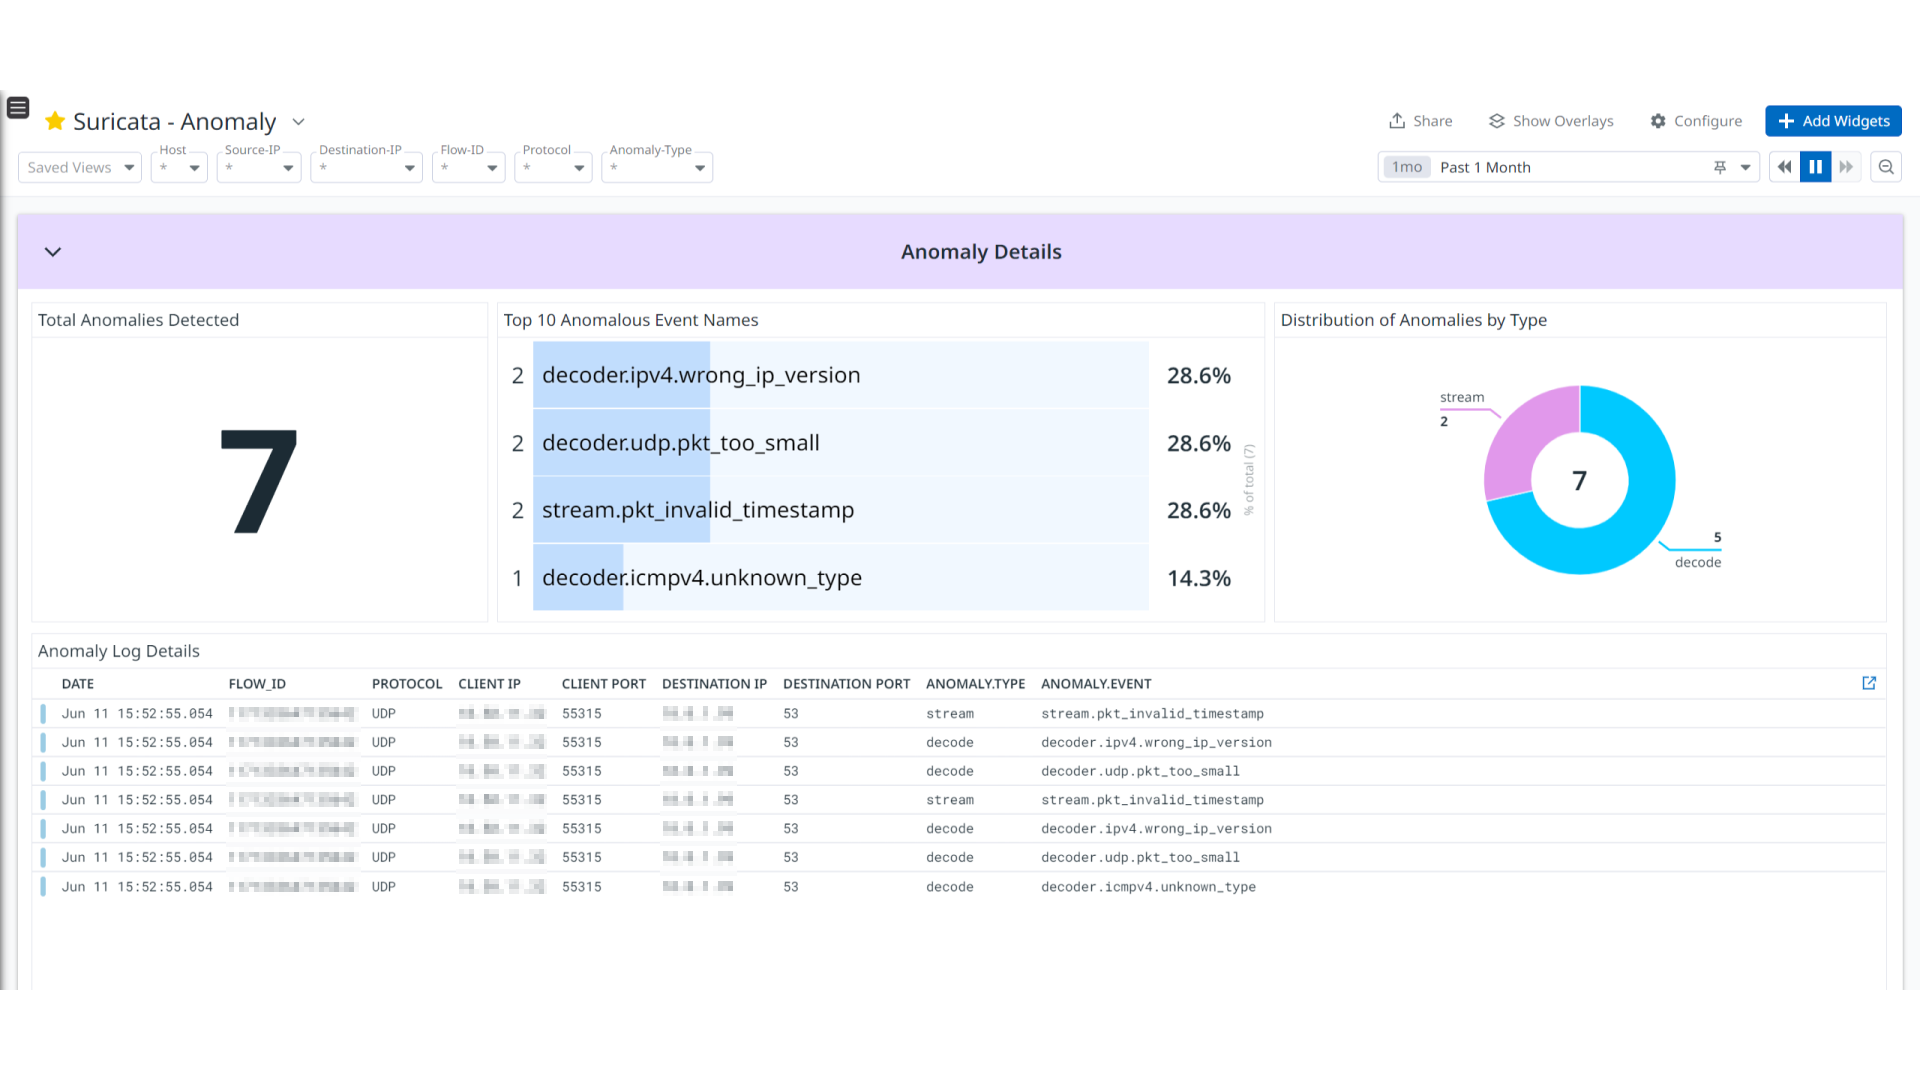
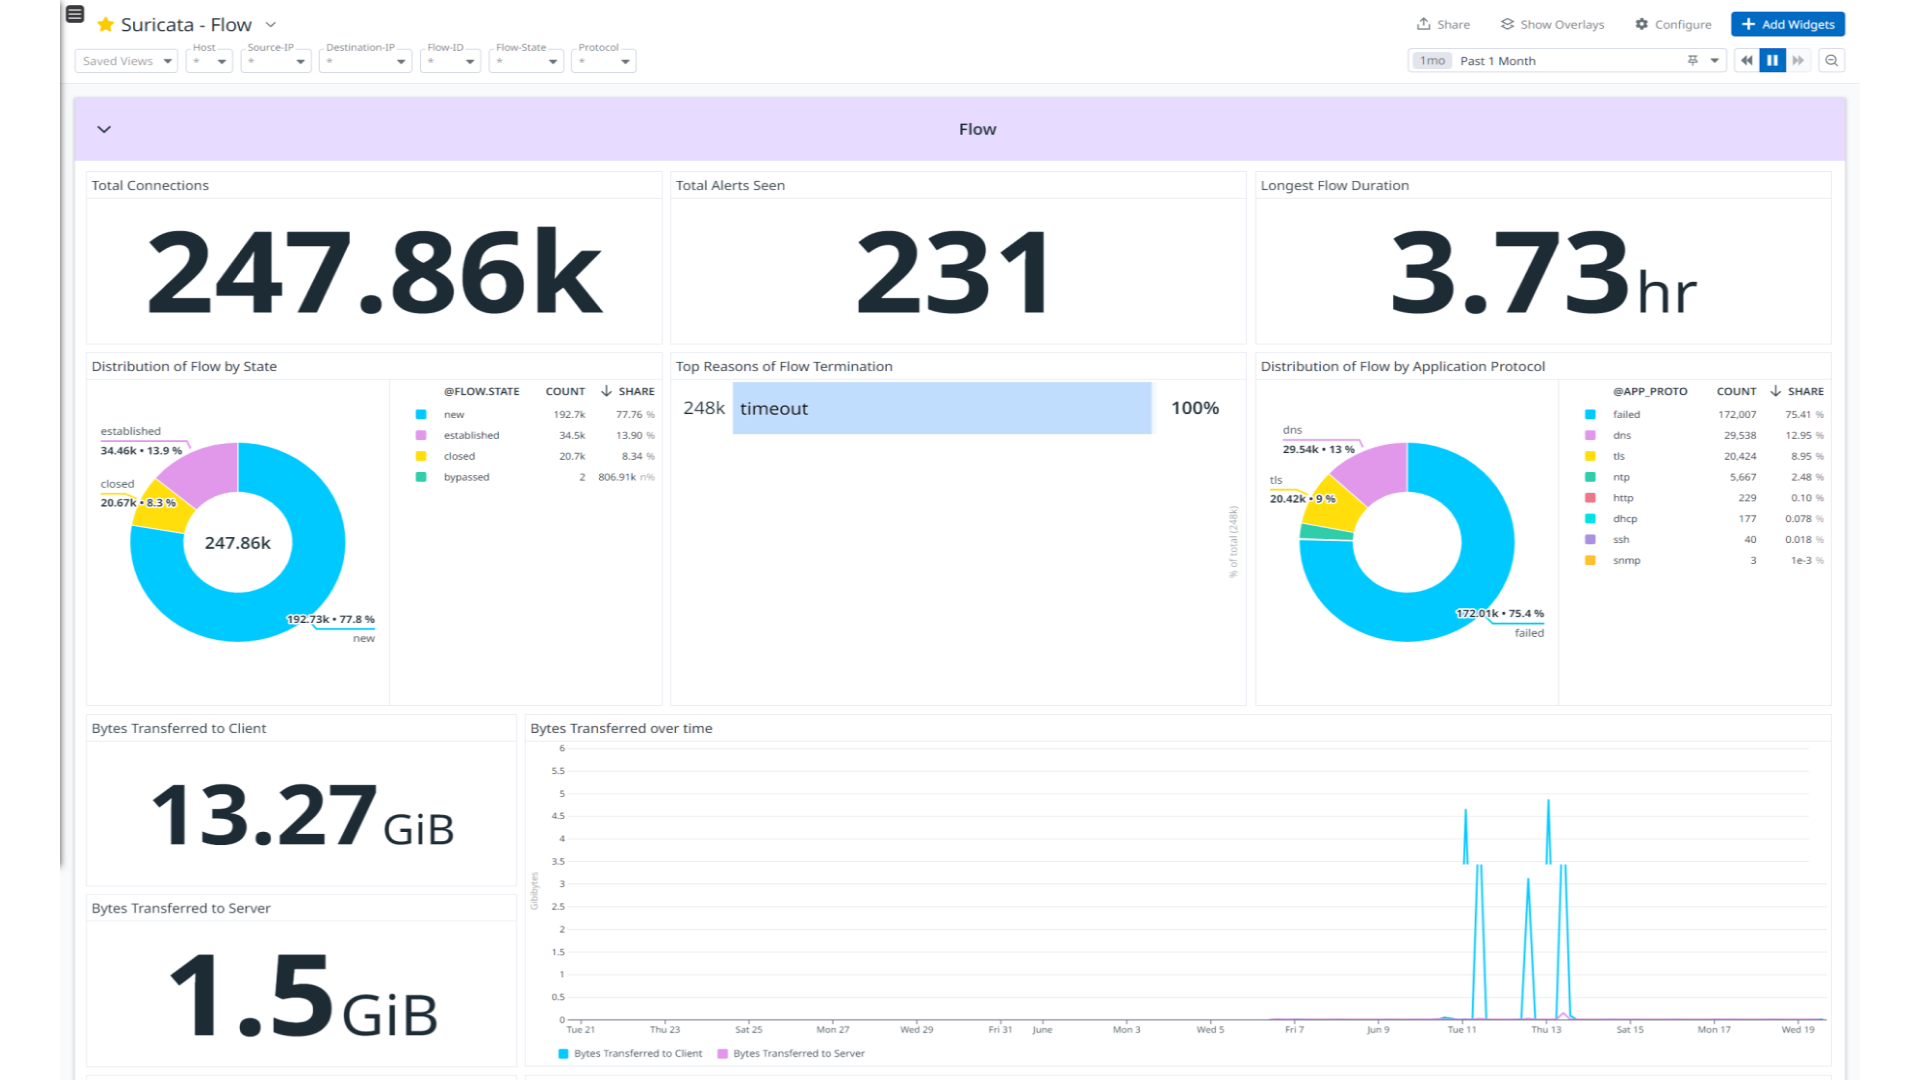
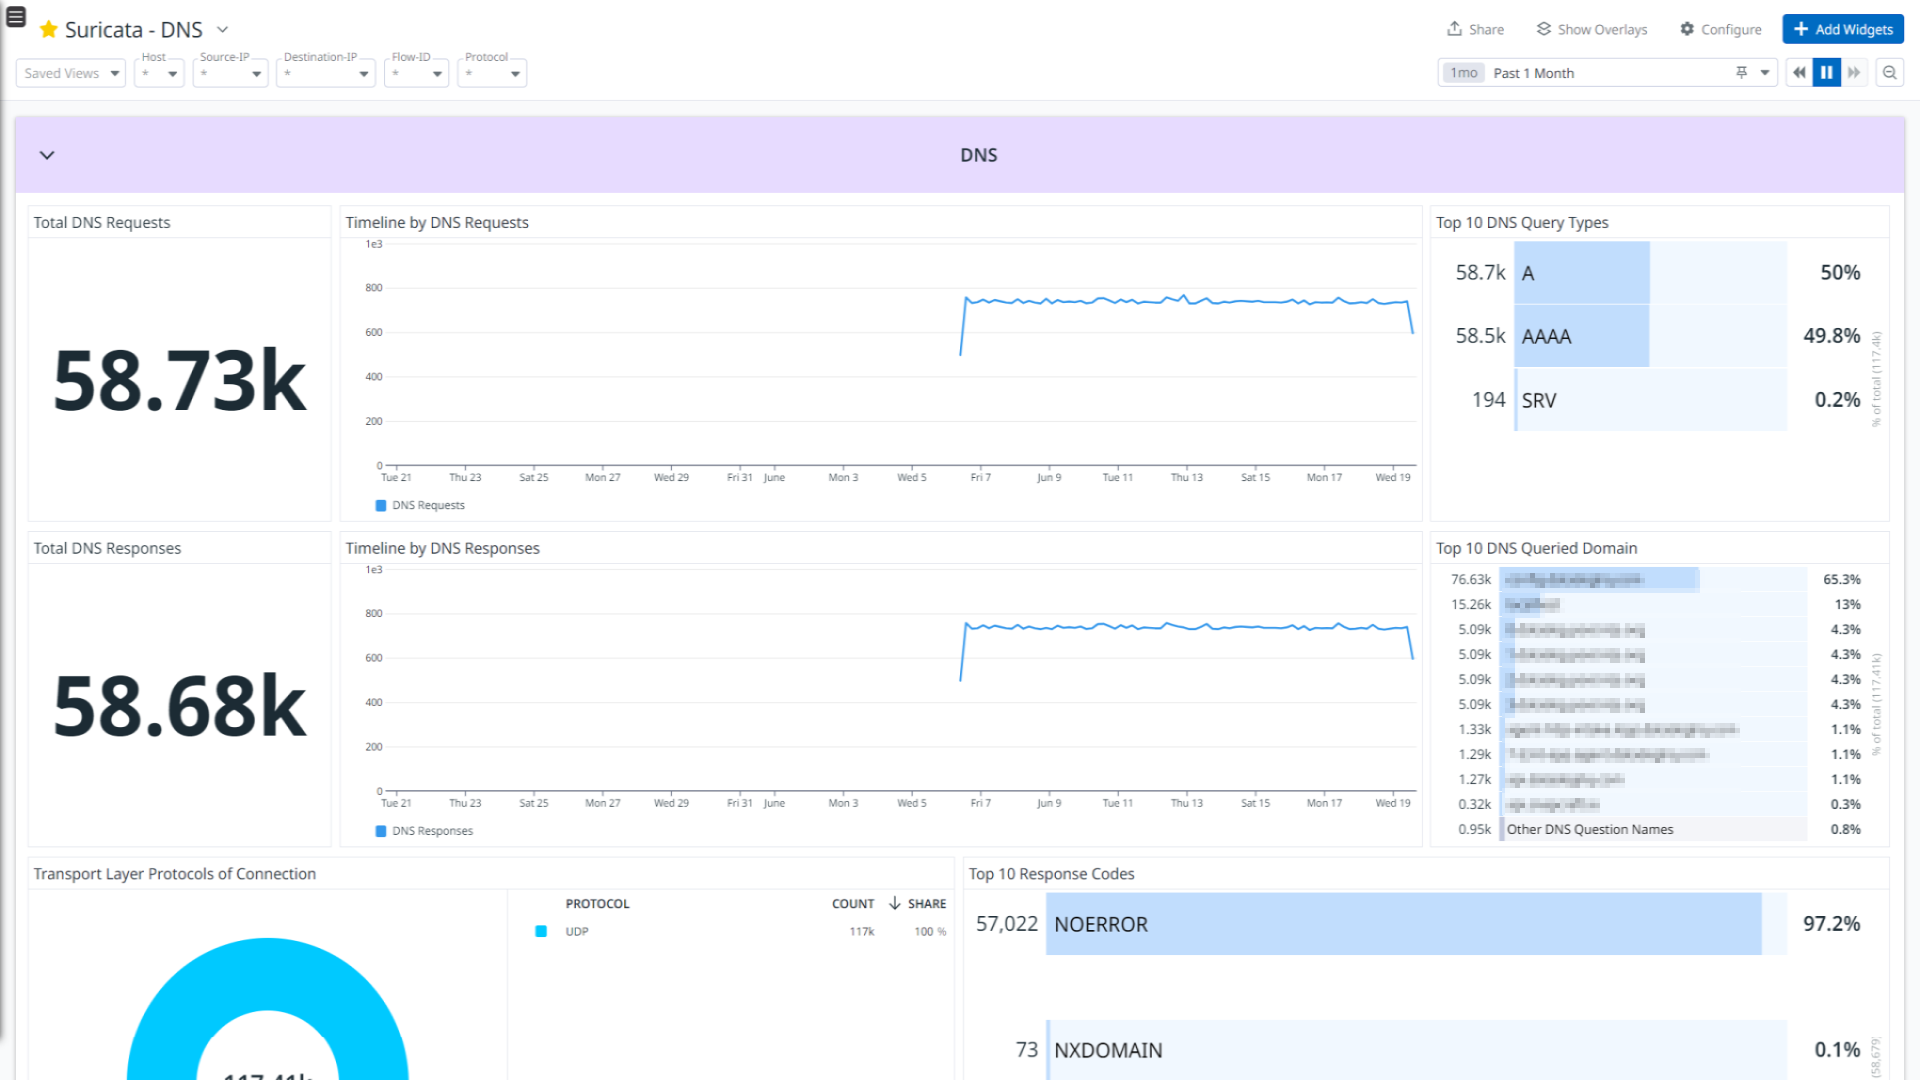
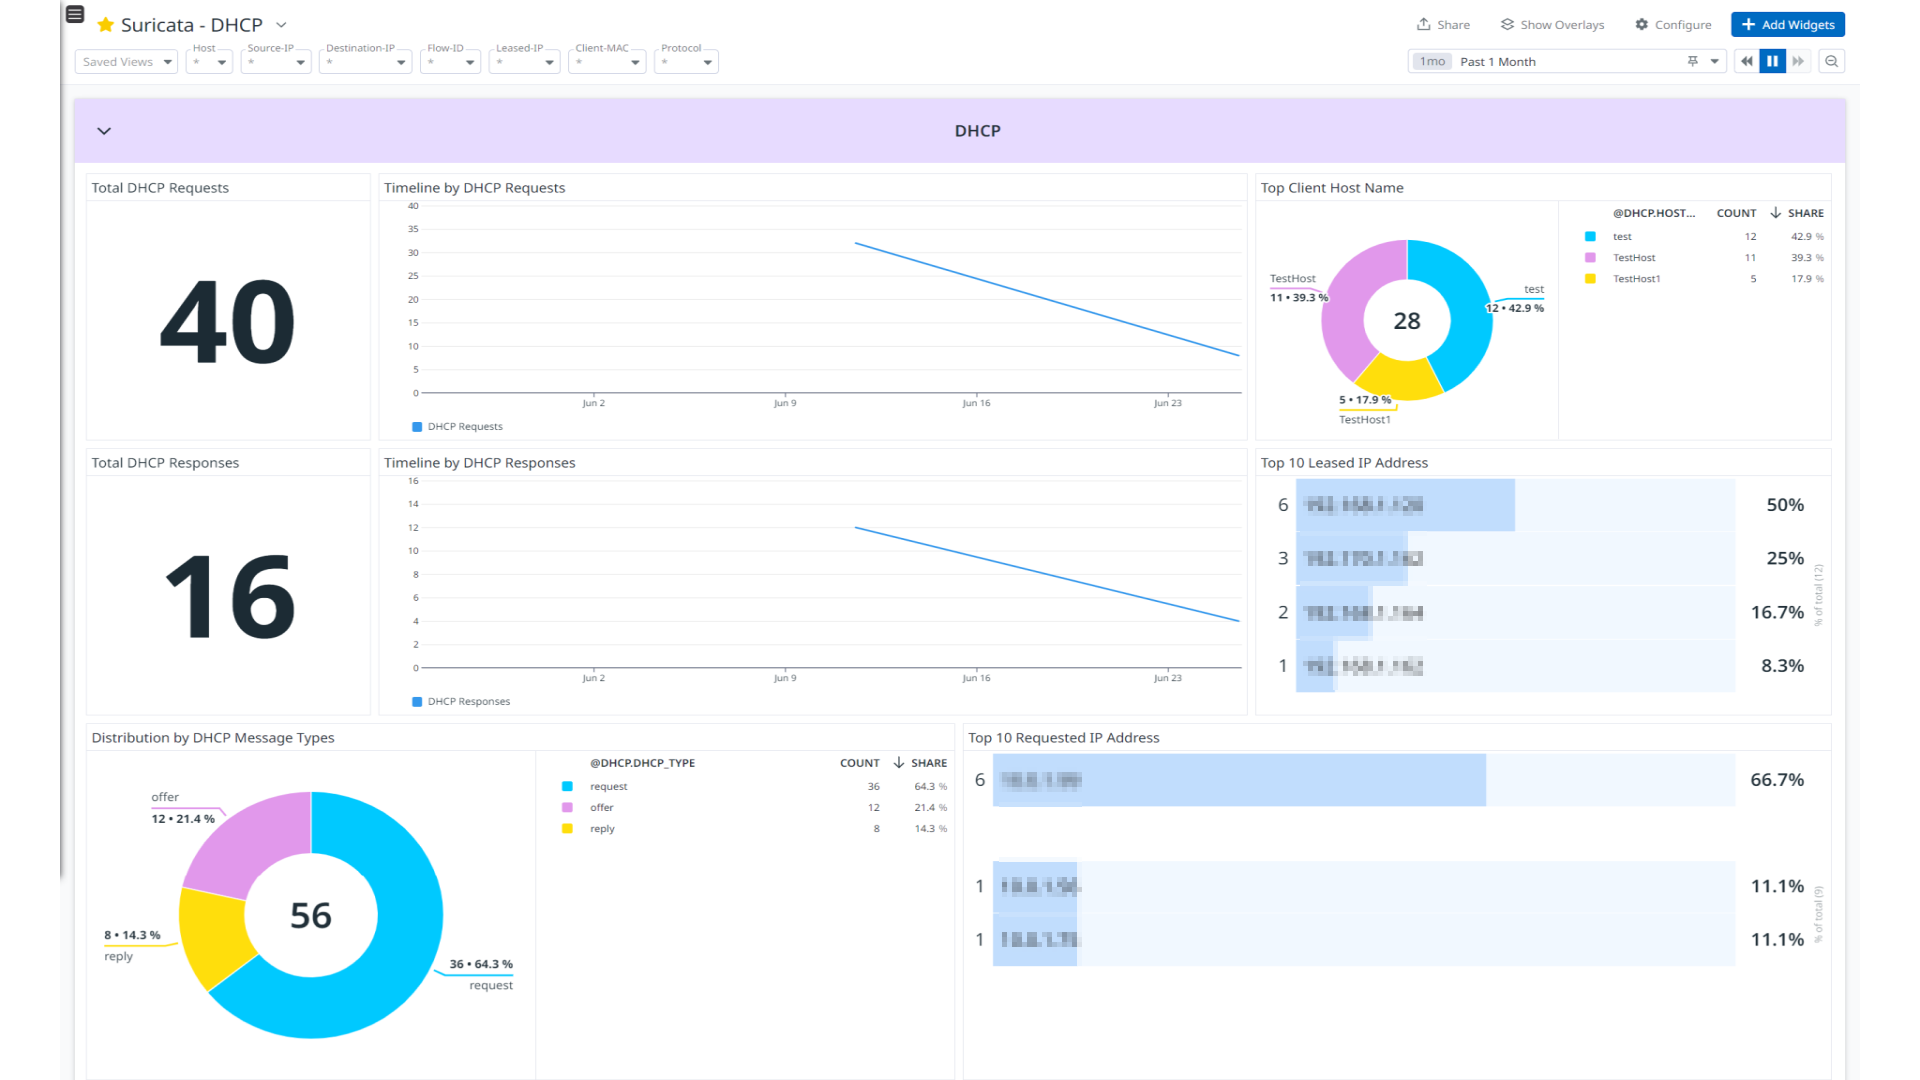
This integration provides enrichment and visualization for Alert, Anomaly, HTTP, DNS, FTP, FTP_DATA, TLS, TFTP, SMB, SSH, Flow, RDP, DHCP, and ARP log types. It helps to visualize detailed insights into Alerts, Anomaly, network connections, DNS, and DHCP activity, as well as detailed network protocol analysis in the integration’s out-of-the-box dashboards.
Minimum Agent version: 7.57.0
Setup
Installation
To install the Suricata integration, run the following Agent installation command and follow the steps below. For more information, see the Integration Management documentation.
Note: This step is not necessary for Agent versions >= 7.57.0.
For Linux, run:
sudo -u dd-agent -- datadog-agent integration install datadog-suricata==1.0.0
Configuration
Log collection
Collecting logs is disabled by default in the Datadog Agent. Enable it in the datadog.yaml file:
Add this configuration block to your suricata.d/conf.yaml file to start collecting your Suricata logs.
See the sample suricata.d/conf.yaml for available configuration options.
logs:
  - type: file
    path: /var/log/suricata/eve.json
    service: suricata
    source: suricata
Note: Make sure you have eve-log output logging enabled in the suricata.yaml file of the Suricata application, and that you’ve address the following points:
- In the
suricata.yaml file, keep filetype parameter as regular in eve-log configurations. - The default path of Suricata’s output files is
/var/log/suricata, and the default filename is eve.json. If you have changed the default path and filename, update the path parameter in your conf.yaml file accordingly.
Restart the Agent.
Validation
Run the Agent’s status subcommand and look for suricata under the Checks section.
Data Collected
Logs
The Suricata integration collects the following log types.
| Format | Event Types |
|---|
| JSON | alert, anomaly, http, dns, ftp, ftp_data, tls. tftp, smb, ssh, flow, rdp, dhcp, arp |
Metrics
The Suricata integration does not include any metrics.
Events
The Suricata integration does not include any events.
Service Checks
The Suricata integration does not include any service checks.
Troubleshooting
If you see a Permission denied error while monitoring the log files, give the dd-agent user read permission on them.
sudo chown -R dd-agent:dd-agent /var/log/suricata/eve.json
For any further assistance, contact Datadog support.