Integration version1.10.0
Overview
The new Snowflake integration replaces the Datadog Agent-based Snowflake integration, and offers additional functionality. After setting up the new Snowflake integration, it is recommended to uninstall the Agent-based Snowflake integration to reduce API call volume to Snowflake.
It can be difficult to effectively monitor and optimize Snowflake infrastructure and data retrieval. Issues arise which may lead to inefficient resource utilization, higher costs, and a degraded customer experience.
With Datadog’s Snowflake integration, you can uncover long-running queries to improve performance and reduce costs, identify real time security threats, and monitor your Snowpark workloads.
After parsing your Snowflake data, Datadog populates the out-of-the-box overview dashboard with insights across all your collected resources. It also offers recommended monitors to help you get started on alerting on failed Snowpark executions or an abnormal amount of login attempts.
Note: Metrics are collected with queries to Snowflake. Queries made by the Datadog integration are billable by Snowflake.
Setup
Installation
No installation steps are required.
Configuration
Connect your Snowflake account
- Find your Snowflake account URL.
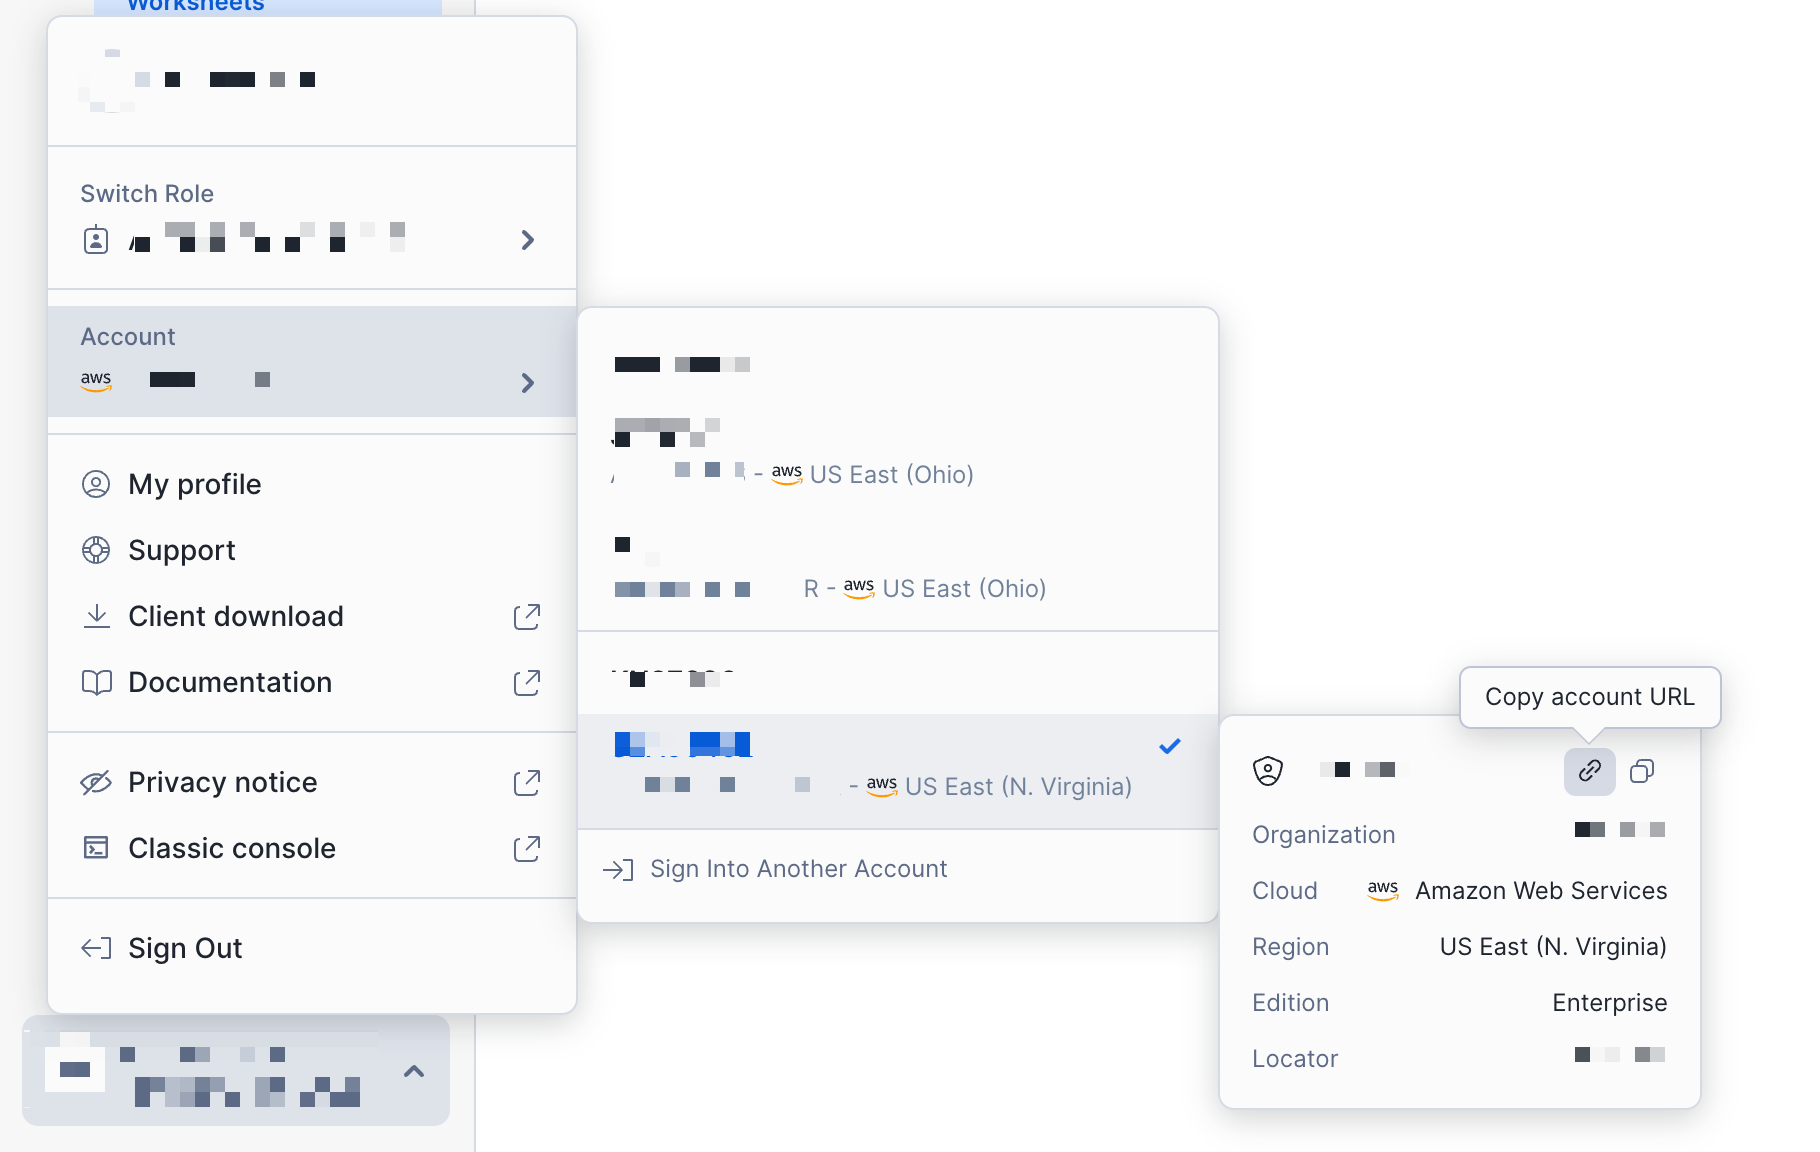
In the Snowflake integration tile, enter the Snowflake account URL in the Account URL field.
Under the Resource Collection tab, enable the resources you are interested in collecting:
Account and Organization Usage metrics
The table below describes the types of metrics collected and their associated metric prefixes.
| Type | Description | Metric prefixes collected |
|---|
| Account usage | Storage usage, credit consumption, and query metrics at an account level.
Collected hourly. | snowflake.auto_recluster
snowflake.billing
snowflake.data_transfer
snowflake.logins
snowflake.pipe
snowflake.query
snowflake.replication
snowflake.storage
snowflake.storage.database
snowflake.storage.table |
| Organization usage | Credit consumption, data transfer history, and budget metrics at an organization level.
Collected daily. | snowflake.organization |
These metrics can be collected in one of two periods:
- Past 24 Hours: Collects metrics aggregated by the past 24 hours. Example: 1-01-25 04:00:00 to 1-02-25 04:00:00.
- Current Day: Collects metrics aggregated by the current day. Example: 1-02-25 00:00:00 to 1-02-25 04:00:00.
Logs
The table below describes the types of logs collected and which Snowflake tables are included.
These logs can be collected in various periods dependent on use case. These can be configured on the Snowflake integration tile.
Cloud Cost Management
Enable Cloud Cost Management to receive Snowflake cost metrics aggregated from the SNOWFLAKE.ORGANIZATION_USAGE.USAGE_IN_CURRENCY_DAILY table. You can use these metrics with Cloud Cost Management to gain additional insight into your cost and usage.
- Create a Datadog-specific role and user to monitor Snowflake. Execute the series of commands below in your Snowflake environment to create a user accessible for Datadog.
Recommended Warehouse Settings
- Create an XS warehouse with an auto-suspend time of 30s.
- Optionally, using an existing XS warehouse that is usually active throughout the day may be the most cost-effective option. Note: Queries made from this integration may potentially impact the performance of an existing warehouse. It is not recommended to run the integration in a warehouse where query performance is critical.
-- Create a new role intended to monitor Snowflake usage. The name of the role is customizable.
create role DATADOG;

-- Grant privileges on the SNOWFLAKE database to the new role.
grant imported privileges on database SNOWFLAKE to role DATADOG;

-- Grant usage to your default warehouse to the role DATADOG.
grant usage on warehouse <WAREHOUSE> to role DATADOG;

-- Grant the following ACCOUNT_USAGE views to the new role. Do this if you wish to collect Snowflake account usage logs and metrics.
grant database role SNOWFLAKE.OBJECT_VIEWER to role DATADOG;
grant database role SNOWFLAKE.USAGE_VIEWER to role DATADOG;
grant database role SNOWFLAKE.GOVERNANCE_VIEWER to role DATADOG;
grant database role SNOWFLAKE.SECURITY_VIEWER to role DATADOG;

-- Grant ORGANIZATION_USAGE_VIEWER to the new role. Do this if you wish to collect Snowflake organization usage metrics.
grant database role SNOWFLAKE.ORGANIZATION_USAGE_VIEWER to role DATADOG;

-- Grant ORGANIZATION_BILLING_VIEWER to the new role. Do this if you wish to collect Snowflake cost data.
grant database role SNOWFLAKE.ORGANIZATION_BILLING_VIEWER to role DATADOG;

-- Grant usage on the database, schema, and table of the event table.
grant usage on database <EVENT_TABLE_DATABASE> to role DATADOG;
grant usage on schema <EVENT_TABLE_DATABASE>.<EVENT_TABLE_SCHEMA> to role DATADOG;
grant select on table <EVENT_TABLE_DATABASE>.<EVENT_TABLE_SCHEMA>.<EVENT_TABLE_NAME> to role DATADOG;
grant application role SNOWFLAKE.EVENTS_VIEWER to role DATADOG;
grant application role SNOWFLAKE.EVENTS_ADMIN to role DATADOG;

-- Create a user.
create user <USERNAME>
LOGIN_NAME = <USERNAME>
password = '<PASSWORD>'
default_warehouse =<WAREHOUSE>
default_role = DATADOG;

-- Grant the monitor role to the user.
grant role DATADOG to user <USERNAME>
- Configure key-pair authentication. The public key is assigned to the user created earlier, and the private key is uploaded to Datadog, allowing Datadog to connect to your Snowflake account.
a. Create and upload a private key following the Snowflake instructions. Datadog currently only supports unencrypted private keys.
b. Create a public key following the Snowflake instructions.
c. Assign the public key to the user created earlier following the Snowflake instructions.
Certain IP address prefixes must be allow-listed for Datadog to collect data from your Snowflake account. The list of IP prefixes belonging to Datadog can be found in the
IP ranges page, and the range to allow can be found under
webhooks.
Reference Tables
Reference Tables allow you to automatically enrich and join your telemetry with additional fields from your Snowflake tables. By mapping value fields to a primary key, you can automatically append these fields to logs or events containing that key.
Enabling Ingestion of Reference Tables
Navigate to your Snowflake Workspace.
Identify the name of the Snowflake Table to be used in Datadog.
Grant Datadog read permissions for the table by running the following command in your workspace.
GRANT USAGE ON DATABASE <REFERENCE_TABLE_DATABASE> TO ROLE DATADOG;
GRANT USAGE ON SCHEMA <REFERENCE_TABLE_DATABASE>.<REFERENCE_TABLE_SCHEMA> TO ROLE DATADOG;
GRANT SELECT ON TABLE <REFERENCE_TABLE_DATABASE>.<REFERENCE_TABLE_SCHEMA>.<REFERENCE_TABLE_NAME> TO ROLE DATADOG;
- If you encounter an Insufficient Privileges error, contact your organization’s Snowflake administrator to grant these permissions. Datadog will not be able to ingest your Snowflake table into Reference Tables without the permissions above granted on your Snowflake table.
Copy the Table Name and Primary Key for use to configure the Reference Table in Step 6.
In Datadog, navigate to the Snowflake tile and click the Reference Tables tab for the account you want to ingest tables for. If you don’t have an account configured, follow the instructions in the Configuration section.
Click the Add New Reference Table button. When the form opens, complete the following fields:
- Datadog Table Name to identify the table within Datadog’s Reference Tables product. Your Datadog table name should consist of characters and underscores to separate multiple words (for example,
my_reference_table). Please ensure your Datadog Reference Table name is unique to your org. - Snowflake Table Name of the Snowflake table you’re looking to ingest copied from step 4.
- Primary Key of your Snowflake table copied from Step 4.
- Click Save.
- You can expect to see service data populated in Datadog within several minutes after your queries’ scheduled executions.
Any ingestion errors will be reported through events viewable in your events explorer by searching for
source:snowflake. - Navigate to Reference Tables and search for your on your newly created table using the Datadog Table Name.
- Review the status of your Snowflake Table which can be found in the File section. If any errors appear, please resolve them in Snowflake.
Best Practices for ingesting Snowflake tables into Datadog reference tables
When integrating Snowflake data into Datadog, it is important to structure your tables efficiently to optimize performance and cost. This section provides recommendations on how to prepare your Snowflake tables for ingestion.
How Datadog ingests your data
Datadog runs the following query hourly against your specified Snowflake table:
SELECT * FROM your_table;
Since this operation retrieves all columns and rows, Datadog strongly recommends creating a view that includes only the necessary fields required for monitoring in Datadog. This helps reduce unnecessary data transfer and processing costs.
Using a view to limit data
Instead of exposing an entire table, create a view that selects only the required columns:
CREATE VIEW my_datadog_view AS
SELECT my_column_1, my_column_2
FROM my_raw_table;
For more information, refer to Snowflake Views Documentation.
In some cases, a standard view may not be the most efficient choice, particularly if:
- The query is complex (for example, involves joins, aggregations, or subqueries).
- The execution time for
SELECT * takes several minutes or longer. - The ingestion frequency results in high compute costs. To monitor your Snowflake Costs, we recommend using Snowflake Cloud Cost Management.
To improve efficiency, consider alternatives such as materialized views, dynamic tables, or precomputed tables.
Choosing the right table structure
| Option | When to Use It | Trade-offs |
|---|
| Materialized View | The query is computationally expensive, and performance is critical. | Improves query speed but increases storage costs and requires refresh logic. |
| Dynamic Table | Data freshness is important, and automatic updates are needed. | Snowflake manages updates, but costs depend on the frequency of refreshes. |
| Precomputed Table (via DBT, ETL, etc.) | Full control over data updates and performance is required. | Provides maximum efficiency but adds complexity in data management. |
Using a materialized view
A materialized view pre-computes and stores query results, making data retrieval significantly faster.
CREATE MATERIALIZED VIEW my_fast_view AS
SELECT important_column_1, important_column_2
FROM my_raw_table;
Materialized views consume additional storage and must be refreshed to keep data up to date. More details can be found in the Materialized Views Documentation.
Using a dynamic table
If data changes frequently and full refreshes are too slow, a dynamic table allows Snowflake to manage incremental updates:
CREATE DYNAMIC TABLE my_dynamic_table
TARGET_LAG = '10 MINUTES'
WAREHOUSE = my_warehouse
AS SELECT important_column_1, important_column_2 FROM my_raw_table;
Snowflake automatically handles incremental updates based on the TARGET_LAG setting. Learn more in the Dynamic Tables Documentation.
Key takeaways
- Use a view to restrict data sent to Datadog and optimize query performance.
- For slow queries, consider using a materialized view, dynamic table, or precomputed table to improve efficiency.
- Evaluate cost and performance trade-offs before choosing an approach.
By following these best practices, you can ensure an efficient and cost-effective integration between Snowflake and Datadog. For assistance in determining the best option for your organization, please contact Snowflake Support.
Troubleshooting Snowflake reference tables
- Reference Table names must be unique within Datadog.
- Datadog does not validate Snowflake table names. If your table does not appear in Reference Tables, ensure the Snowflake Table Name is entered correctly.
- If your table still does not appear, review the Limitations section of the Reference Table Documentation to ensure your table does not fall into one of those categories.
- For issues with Datadog ingestion, contact Datadog Support. For issues with your Snowflake table, contact Snowflake Support.
Data Collected
Metrics
| |
|---|
snowflake.storage.storage_bytes.total
(gauge) | The average number of bytes of table storage used including bytes for data currently in Time Travel.
Shown as byte |
snowflake.storage.stage_bytes.total
(gauge) | The average number of bytes of stage storage used by files in all internal stages.
Shown as byte |
snowflake.storage.failsafe_bytes.total
(gauge) | The average number of bytes of data in Fail-safe.
Shown as byte |
snowflake.storage.database.storage_bytes
(gauge) | The average number of bytes of database storage used.
Shown as byte |
snowflake.storage.database.failsafe_bytes
(gauge) | The average number of bytes of Fail-safe storage used.
Shown as byte |
snowflake.billing.virtual_warehouse.avg
(gauge) | The average overall credits billed per hour for virtual warehouses.
Shown as unit |
snowflake.billing.virtual_warehouse.sum
(gauge) | The sum of overall credits billed for virtual warehouses.
Shown as unit |
snowflake.billing.cloud_service.avg
(gauge) | The average overall credits billed per hour for cloud services.
Shown as unit |
snowflake.billing.cloud_service.sum
(gauge) | The total overall credits billed for cloud services.
Shown as unit |
snowflake.billing.total_credit.avg
(gauge) | The average overall of credits used per hour for the account. This is the sum of snowflake.billing.cloud_service and snowflake.billing.virtual_warehouses.
Shown as unit |
snowflake.billing.total_credit.sum
(gauge) | The total overall of credits used for the account. This is the sum of snowflake.billing.cloud_service and snowflake.billing.virtual_warehouses.
Shown as unit |
snowflake.billing.warehouse.cloud_service.avg
(gauge) | The average credits used per hour for cloud services by warehouse.
Shown as unit |
snowflake.billing.warehouse.cloud_service.sum
(gauge) | The total credits used for cloud services by warehouse.
Shown as unit |
snowflake.billing.warehouse.virtual_warehouse.avg
(gauge) | The average credits used per hour by warehouse.
Shown as unit |
snowflake.billing.warehouse.virtual_warehouse.sum
(gauge) | The total credits used by warehouse.
Shown as unit |
snowflake.billing.warehouse.total_credit.avg
(gauge) | The average total number of credits used per hour for the warehouse. NOTE: This value does not take into account adjustments which may be higher than your actual credit consumption.
Shown as unit |
snowflake.billing.warehouse.total_credit.sum
(gauge) | The total number of credits used for the warehouse. NOTE: This value does not take into account adjustments which may be higher than your actual credit consumption.
Shown as unit |
snowflake.logins.fail.count
(count) | Total failed login attempts.
Shown as error |
snowflake.logins.success.count
(count) | Total successful login attempts.
Shown as success |
snowflake.logins.total
(count) | Total number of login attempts.
Shown as attempt |
snowflake.query.executed
(gauge) | The average number of queries executed.
Shown as query |
snowflake.query.queued_overload
(gauge) | Average number of queries queued because the warehouse was overloaded.
Shown as query |
snowflake.query.queued_provision
(gauge) | Average number of queries queued because the warehouse was being provisioned.
Shown as query |
snowflake.query.blocked
(gauge) | Average number of queries blocked by a transaction lock.
Shown as query |
snowflake.query.execution_time
(gauge) | Average query execution time.
Shown as millisecond |
snowflake.query.compilation_time
(gauge) | Average query compilation time.
Shown as millisecond |
snowflake.query.bytes_scanned
(gauge) | Average query bytes scanned.
Shown as byte |
snowflake.query.bytes_written
(gauge) | Average query bytes written.
Shown as byte |
snowflake.query.bytes_deleted
(gauge) | Average query bytes deleted.
Shown as byte |
snowflake.data_transfer.bytes.avg
(gauge) | Average bytes transferred.
Shown as byte |
snowflake.data_transfer.bytes.sum
(gauge) | Total bytes transferred.
Shown as byte |
snowflake.auto_recluster.credits_used.avg
(gauge) | Average credits billed for automatic reclustering.
Shown as unit |
snowflake.auto_recluster.credits_used.sum
(gauge) | Total credits billed for automatic reclustering.
Shown as unit |
snowflake.auto_recluster.bytes_reclustered.avg
(gauge) | Average bytes reclustered.
Shown as byte |
snowflake.auto_recluster.bytes_reclustered.sum
(gauge) | Total bytes reclustered.
Shown as byte |
snowflake.auto_recluster.rows_reclustered.avg
(gauge) | Average rows reclustered.
Shown as row |
snowflake.auto_recluster.rows_reclustered.sum
(gauge) | Total rows reclustered.
Shown as row |
snowflake.storage.table.active_bytes.avg
(gauge) | Average bytes owned by (and billed to) this table that are in the active state.
Shown as byte |
snowflake.storage.table.time_travel_bytes.avg
(gauge) | Average bytes owned by (and billed to) this table that are in the Time Travel state.
Shown as byte |
snowflake.storage.table.failsafe_bytes.avg
(gauge) | Average bytes owned by (and billed to) this table that are in the Fail-safe state.
Shown as byte |
snowflake.storage.table.retained_bytes.avg
(gauge) | Average bytes owned by (and billed to) this table that are retained after deletion because they are referenced by one or more clones of this table.
Shown as byte |
snowflake.pipe.credits_used.avg
(gauge) | Average number of credits billed for Snowpipe data loads.
Shown as unit |
snowflake.pipe.credits_used.sum
(gauge) | Total number of credits billed for Snowpipe data loads.
Shown as unit |
snowflake.pipe.bytes_inserted.avg
(gauge) | Average number of bytes loaded from Snowpipe.
Shown as byte |
snowflake.pipe.bytes_inserted.sum
(gauge) | Total number of bytes loaded from Snowpipe.
Shown as byte |
snowflake.pipe.files_inserted.avg
(gauge) | Average number of files loaded from Snowpipe.
Shown as file |
snowflake.pipe.files_inserted.sum
(gauge) | Total number of files loaded from Snowpipe.
Shown as file |
snowflake.replication.credits_used.avg
(gauge) | Average number of credits used for database replication.
Shown as unit |
snowflake.replication.credits_used.sum
(gauge) | Total number of credits used for database replication.
Shown as unit |
snowflake.replication.bytes_transferred.avg
(gauge) | Average number of bytes transferred for database replication.
Shown as byte |
snowflake.replication.bytes_transferred.sum
(gauge) | Total number of bytes transferred for database replication.
Shown as byte |
snowflake.query.bytes_spilled.local
(gauge) | Avg volume of data spilled to local disk.
Shown as byte |
snowflake.query.bytes_spilled.remote
(gauge) | Avg volume of data spilled to remote disk.
Shown as byte |
snowflake.organization.contract.amount
(gauge) | The average amount for the given contract |
snowflake.organization.credit.virtual_warehouse.sum
(gauge) | The sum of credits used by warehouse. |
snowflake.organization.credit.virtual_warehouse.avg
(gauge) | The average credits used per day by warehouse. |
snowflake.organization.credit.cloud_service.sum
(gauge) | The sum of credits billed for cloud services |
snowflake.organization.credit.cloud_service.avg
(gauge) | The average overall credits billed for cloud services |
snowflake.organization.credit.cloud_service_adjustment.sum
(gauge) | Sum of credits adjusted for included cloud services. |
snowflake.organization.credit.cloud_service_adjustment.avg
(gauge) | Average of credits adjusted for included cloud services. |
snowflake.organization.credit.total_credit.sum
(gauge) | The sum of overall of credits used for the organization. This is the sum of snowflake.organization.credit.cloud_service.sum and snowflake.organization.credit.virtual_warehouse.sum. |
snowflake.organization.credit.total_credit.avg
(gauge) | The average number of overall of credits used for the organization. This is the sum of snowflake.organization.credit.cloud_service.avg and snowflake.organization.credit.virtual_warehouse.avg. |
snowflake.organization.credit.total_credits_billed.sum
(gauge) | The total number of credits billed for the account in the day. It is the sum of snowflake.organization.credit.cloud_service.sum, snowflake.organization.credit.virtual_warehouse.sum, and snowflake_web.organization.credit.cloud_service_adjustment.sum. |
snowflake.organization.credit.total_credits_billed.avg
(gauge) | The average number of credits billed for the account in the day. It is the sum of snowflake.organization.credit.cloud_service.avg, snowflake.organization.credit.virtual_warehouse.avg, and snowflake_web.organization.credit.cloud_service_adjustment.avg. |
snowflake.organization.currency.usage
(gauge) | Sum of the total number of credits charged per day. |
snowflake.organization.currency.usage_in_currency
(gauge) | Sum of the total amount charged for the day. |
snowflake.organization.warehouse.virtual_warehouse.sum
(gauge) | Sum of number of credits used for the warehouse. |
snowflake.organization.warehouse.virtual_warehouse.avg
(gauge) | Average number of credits used for the warehouse. |
snowflake.organization.warehouse.cloud_service.avg
(gauge) | Average number of credits used for cloud services. |
snowflake.organization.warehouse.cloud_service.sum
(gauge) | Sum of credits used for cloud services. |
snowflake.organization.warehouse.total_credit.sum
(gauge) | The total number of credits used by the warehouse. Sum of snowflake.organization.warehouse.cloud_service.sum and snowflake.organization.warehouse.total_credit.sum. |
snowflake.organization.warehouse.total_credit.avg
(gauge) | The average total number of credits used by the warehouse. Sum of snowflake.organization.warehouse.cloud_service.avg and snowflake.organization.warehouse.total_credit.avg |
snowflake.organization.storage.average_bytes
(gauge) | Number of bytes of database storage used, including data in Time Travel and Fail-safe.
Shown as byte |
snowflake.organization.storage.credits
(gauge) | Sum of total number of credits used for all accounts in the organization. Sum of credits used for database storage and stages. |
snowflake.organization.rate.effective_rate
(gauge) | The rate after applying any applicable discounts per the contract for the organization. |
snowflake.organization.data_transfer.bytes_transferred
(gauge) | Number of bytes transferred during the usage date.
Shown as byte |
snowflake.organization.balance.capacity
(gauge) | The amount of capacity in currency that is available for use. This is the end of day balance. |
snowflake.organization.balance.on_demand_consumption
(gauge) | The amount of consumption at on demand prices that will be invoiced given that all the free usage and capacity balances have been exhausted. This is a negative value (e.g. -250) until the invoice is paid. This is the end of day balance. |
snowflake.organization.balance.rollover
(gauge) | The amount of rollover balance in currency that is available for use. At the end of a contract term |
snowflake.organization.balance.free_usage
(gauge) | The amount of free usage in currency that is available for use. This is the end of day balance |
Logs
The Snowflake integration collects the following log types:
- Query history - Execution history from
SNOWFLAKE.ACCOUNT_USAGE.QUERY_HISTORY - Security logs - Including login history, sessions, grants to users, data transfer history, and stages
- Event table data - Custom event tables containing messages and events from Snowflake functions and procedures
See the Logs configuration section above for details on each log type and the Snowflake tables they’re collected from.
Events
The Snowflake Web integration does not include any events.
Service Checks
The Snowflake Web integration does not include any service checks.
Troubleshooting
Need help? Contact Datadog support.
Agent check: Snowflake
The Snowflake Agent check is no longer supported, it is recommended to switch to the new Snowflake integration for additional functionality and reduced API call volume to Snowflake.
Agent: Overview
This check monitors Snowflake through the Datadog Agent. Snowflake is a SaaS-analytic data warehouse and runs completely on cloud infrastructure.
This integration monitors credit usage, billing, storage, query metrics, and more.
Note: Metrics are collected with queries to Snowflake. Queries made by the Datadog integration are billable by Snowflake.
Agent: Setup
Follow the instructions below to install and configure this check for an Agent running on a host.
Agent: Installation
The Snowflake check is included in the Datadog Agent package.
Note: The Snowflake check is not available in Datadog Agent v6 using Python 2. To use Snowflake on Agent v6 see Use Python 3 with Datadog Agent v6 or upgrade to Agent v7.
Agent: Configuration
Snowflake recommends granting permissions to an alternate role like `SYSADMIN`. Read more about controlling
ACCOUNTADMIN role for more information.
Create a Datadog specific role and user to monitor Snowflake. In Snowflake, run the following to create a custom role with access to the ACCOUNT_USAGE schema.
Note: By default, this integration monitors the SNOWFLAKE database and ACCOUNT_USAGE schema. See “Collecting Organization Data” for information on how to monitor the ORGANIZATION_USAGE schema.
This database is available by default and only viewable by users in the ACCOUNTADMIN role or any role granted by the ACCOUNTADMIN.
use role ACCOUNTADMIN;
grant imported privileges on database snowflake to role SYSADMIN;

use role SYSADMIN;
Alternatively, you can create a DATADOG custom role with access to ACCOUNT_USAGE.
-- Create a new role intended to monitor Snowflake usage.
create role DATADOG;

-- Grant privileges on the SNOWFLAKE database to the new role.
grant imported privileges on database SNOWFLAKE to role DATADOG;

-- Grant usage to your default warehouse to the role DATADOG.
grant usage on warehouse <WAREHOUSE> to role DATADOG;

-- Create a user, skip this step if you are using an existing user.
create user DATADOG_USER
LOGIN_NAME = DATADOG_USER
password = '<PASSWORD>'
default_warehouse = <WAREHOUSE>
default_role = DATADOG
default_namespace = SNOWFLAKE.ACCOUNT_USAGE;

-- Grant the monitor role to the user.
grant role DATADOG to user <USER>;
Edit the snowflake.d/conf.yaml file, in the conf.d/ folder at the root of your Agent’s configuration directory to start collecting your Snowflake performance data. See the sample snowflake.d/conf.yaml for all available configuration options.
## @param account - string - required
## Name of your account (provided by Snowflake), including the platform and region if applicable.
## For more information on Snowflake account names,
## see https://docs.snowflake.com/en/user-guide/connecting.html#your-snowflake-account-name
#
- account: <ORG_NAME>-<ACCOUNT_NAME>

  ## @param username - string - required
  ## Login name for the user.
  #
  username: <USER>

  ## @param password - string - required
  ## Password for the user
  #
  password: <PASSWORD>

  ## @param role - string - required
  ## Name of the role to use.
  ##
  ## By default, the SNOWFLAKE database is only accessible by the ACCOUNTADMIN role. Snowflake recommends
  ## configuring a role specific for monitoring:
  ## https://docs.snowflake.com/en/sql-reference/account-usage.html#enabling-account-usage-for-other-roles
  #
  role: <ROLE>

  ## @param min_collection_interval - number - optional - default: 15
  ## This changes the collection interval of the check. For more information, see:
  ## https://docs.datadoghq.com/developers/write_agent_check/#collection-interval
  ##
  ## NOTE: Most Snowflake ACCOUNT_USAGE views are populated on an hourly basis,
  ## so to minimize unnecessary queries, set the `min_collection_interval` to 1 hour.
  #
  min_collection_interval: 3600

  # @param disable_generic_tags - boolean - optional - default: false
  # Generic tags such as `cluster` will be replaced by <INTEGRATION_NAME>_cluster to avoid
  # getting mixed with other integration tags.
  # disable_generic_tags: true
In the default `conf.yaml`, the
min_collection_interval is 1 hour.
Snowflake metrics are aggregated by day, you can increase the interval to reduce the number of queries.
Note: Snowflake ACCOUNT_USAGE views have a
known latency of 45 minutes to 3 hours.
Restart the Agent.
Collecting Organization Data
By default, this integration monitors the ACCOUNT_USAGE schema, but it can be set to monitor organization-level metrics instead.
To collect organization metrics, change the schema field to ORGANIZATION_USAGE and increase the min_collection_interval to 43200 in the integration’s configuration. This reduces the number of queries to Snowflake, as most organization queries have a latency of up to 24 hours.
Note: To monitor organization metrics, your user must have the ORGADMIN role.
- schema: ORGANIZATION_USAGE
  min_collection_interval: 43200
Only some organization metrics are enabled by default. To collect all available organization metrics, utilize the metric_groups configuration option:
metric_groups:
  - snowflake.organization.warehouse
  - snowflake.organization.currency
  - snowflake.organization.credit
  - snowflake.organization.storage
  - snowflake.organization.contracts
  - snowflake.organization.balance
  - snowflake.organization.rate
  - snowflake.organization.data_transfer
Additionally, you can monitor both account and organization metrics at the same time:
instances:
  - account: example-inc
    username: DATADOG_ORG_ADMIN
    password: "<PASSWORD>"
    role: SYSADMIN
    schema: ORGANIZATION_USAGE
    database: SNOWFLAKE
    min_collection_interval: 43200

  - account: example-inc
    username: DATADOG_ACCOUNT_ADMIN
    password: "<PASSWORD>"
    role: DATADOG_ADMIN
    schema: ACCOUNT_USAGE
    database: SNOWFLAKE
    min_collection_interval: 3600
Collecting data for multiple environments
If you want to collect data for multiple Snowflake environments, add each environment as an instance in your snowflake.d/conf.yaml file. For example, if you needed to collect data for two users named DATADOG_SYSADMIN and DATADOG_USER:
instances:
  - account: example-inc
    username: DATADOG_SYSADMIN
    password: "<PASSWORD>"
    role: SYSADMIN
    database: EXAMPLE-INC

  - account: example-inc
    username: DATADOG_USER
    password: "<PASSWORD>"
    role: DATADOG_USER
    database: EXAMPLE-INC
Proxy configuration
Snowflake recommends setting environment variables for proxy configuration.
You can also set the proxy_host, proxy_port, proxy_user, and proxy_password under init_config in the snowflake.d/conf.yaml.
Note: Snowflake automatically formats the proxy configurations and sets standard proxy environment variables.
These variables also impact every requests from integrations, including orchestrators like Docker, ECS, and Kubernetes.
Private connectivity to Snowflake configuration
If private connectivity (such as AWS PrivateLink) is enabled in Snowflake, you can configure the Snowflake integration by updating the account configuration option to the following format:
- account: <ACCOUNT>.<REGION_ID>.privatelink
Agent: Validation
Run the Agent’s status subcommand and look for snowflake under the Checks section.
Agent: Data Collected
Note: Only metrics from the following metric groups are enabled by default:
snowflake.query.*,
snowflake.billing.*,
snowflake.storage.*, and
snowflake.logins.*.
If you would like to collect metrics from other metric groups, please refer to the example config file for this integration.
Agent: Metrics
See Metrics for a list of metrics provided by this check.
Agent: Events
Snowflake does not include any events.
Agent: Service Checks
snowflake.can_connect
Returns CRITICAL if the check cannot authenticate Snowflake credentials. Returns OK otherwise.
Statuses: ok, critical
Agent: Troubleshooting
Need help? Contact Datadog support.
Further Reading
Additional helpful documentation, links, and articles: