Oracle Cloud Infrastructure
The Oracle Cloud Infrastructure integration is not supported for your selected
Datadog site (
).
Overview
Oracle Cloud Infrastructure (OCI) is an infrastructure-as-a-service (IaaS) and platform-as-a-service (PaaS) used by enterprise-scale companies. It includes a full suite of over 30 managed services for hosting, storage, networking, databases, and more.
Use Datadog’s OCI integration to get full visibility into your OCI environment through metrics, logs, and resource data. This data enables you to power dashboards, helps with troubleshooting, and can be monitored for security and compliance posture.
Setup
Datadog recommends using the QuickStart setup method. If needed, you can also manually set up the integration.
Data collection
Considerations
- Logs, metrics, and resource data collection are enabled by default. You can opt out of log collection during setup. After completing the setup, you can modify resource data collection and individual log or metric services from the Datadog OCI integration tile.
- All OCI Commercial regions (in the OC1 realm) that existed as of January 1, 2026 are supported. OCI regions added after this date are not supported.
- The Datadog OCI integration is restricted to one integration per tenancy. If you set up the integration prior to June 2025, you followed the manual setup; any resulting Datadog OCI integration deployment stacks must be deleted before using the OCI QuickStart setup method. If you manually configured log forwarding, and choose to enable log collection in the OCI QuickStart tile, you must also delete your existing log forwarding resources to avoid sending logs twice. See the manual to QuickStart migration section of this page for more information.
Datadog’s OCI QuickStart is a fully managed, single-flow setup experience that helps you monitor your OCI infrastructure and applications in just a few clicks. OCI QuickStart creates the necessary infrastructure for forwarding metrics, logs, and resource data to Datadog, and automatically discovers new resources or OCI compartments for data collection.
Choose QuickStart setup if…
- You are setting up the OCI integration for the first time.
- You prefer a UI-based workflow, and want to minimize the time it takes to create and configure the necessary resources.
- You want to automate setup steps in scripts or CI/CD pipelines.
QuickStart setup prerequisites
- Your OCI user account needs the Identity Domain Administrator role to complete these steps.
- You must be logged into OCI in the tenancy you want to integrate with.
- You must be logged into OCI with the Home Region selected in the top right of the screen.
- Your OCI user account must be able to create a user, user group, and dynamic group in the Identity Domain that you are logged into, or in the target domain if specified. If providing a target domain OCID, your OCI user account must have administrator privileges in that domain.
- Your OCI user account must be able to create policies in the root compartment.
QuickStart setup instructions
To set up the infrastructure for metric and log forwarding to Datadog:
The integration requires using Oracle Service Connector Hubs to forward data to Datadog. It is recommended that you request a service limit increase before completing the setup. The approximate number of Service Connector Hubs you need is:
$$\text"Service Connector Hubs" = \text"Number of compartments in tenancy" / \text"5"$$
Go to the Datadog OCI integration tile and click Add New Tenancy.
Select or create a Datadog API key to use for the integration.
Create a Datadog application key.
Enable or disable logs using the toggle.
Click Create OCI Stack. This takes you to an Oracle Resource Manager (ORM) stack to finish deployment.
Note: Deploy this stack only once per tenancy.
Deploy the QuickStart ORM stack
Accept the Oracle Terms of Use.
Leave the option to use custom Terraform providers unchecked.
Use the default working directory to deploy the stack in, or optionally choose a different one.
Click Next.
Datadog recommends leaving the (Optional) Choose specific subnet(s) section blank to create a new Virtual Cloud Network (VCN) and subnet in each region in this tenancy.
Optionally, you can choose existing subnets (maximum of one per OCI region) for the Datadog QuickStart stack, in which case you need to provide the stack with the subnet OCIDs. Enter one OCID per line, without commas. The Datadog QuickStart stack is then deployed in the region corresponding to each subnet. Each subnet OCID should be in the format: ocid1.subnet.oc[0-9].*. For example, ocid1.subnet.oc1.iad.abcedfgh.
Note: If using existing VCN and subnets, ensure that the VCN in each region:
- Is allowed to make HTTP egress calls through NAT Gateway.
- Has a Service Gateway that supports “All Services In Oracle Services Network”.
- Has the route table rules to allow NAT Gateway and Service Gateway.
- Has the security rules to send HTTP requests.
Datadog recommends leaving the (Optional) Choose a User section blank to create a new User and Group. The Group and User are created in the OCI Identity Domain that you are currently logged into (which doesn’t need to be the Default domain).
Optionally, you can choose an existing User and Group for the Datadog QuickStart stack. In this case, Datadog automatically infers the user and group’s domain, and uses that for creating dynamic groups.
a. Group ID: Provide the OCID of an existing OCI Group for Datadog authentication. If provided, User ID cannot be left blank.
b. User ID: Provide the OCID of an existing OCI User for Datadog authentication. The user must be a member of the specified Group. If provided, Group ID cannot be left blank.
Datadog recommends leaving the (Optional) Advanced configuration section blank as these use cases are uncommon.
Optionally, you can choose an existing Compartment and Domain for the Datadog QuickStart stack.
a. Compartment: Choose an existing Compartment to place all the resources created by Datadog.
b. Domain: Provide the OCID of an existing Identity Domain to override where the User and Group are created. This field is only shown if an existing User and Group are not specified in step 6. If provided, User Email cannot be left blank. Note: Your OCI user account must have Identity Domain Administrator role in the target domain.
c. Resource tags: Provide a list of defined tags to be added to all OCI resources deployed by the Datadog QuickStart stack. Enter one tag per line. Do not add commas. Each defined tag should be in the format: namespace.key:value. For example, CostCenter.Environment:prod. If left blank, no defined tags are added to the OCI resources deployed by the Datadog QuickStart stack.
Click Next.
Click Create, and wait up to 30 minutes for the deployment to complete.
Complete the setup in Datadog
Return to the Datadog OCI integration tile and click Ready!
- You manage infrastructure as code and want to keep the Datadog OCI integration under version control.
- You need to configure multiple folders or projects consistently with reusable provider blocks.
- You want a repeatable, auditable deployment process that fits into your Terraform-managed environment.
You can use Terraform to provision the Datadog OCI integration. This guide lists prerequisites, required variables, and the exact steps to initialize, plan, and apply.
Have the following before you begin:
- Terraform 1.x installed.
- A valid Datadog API key.
- OCI access with the Identity Domain Administrator role on the target domain.
To set up the infrastructure for metric and log forwarding to Datadog:
Create an OCI configuration file
The ~/.oci/config file grants Terraform permissions to create resources in OCI. Create an API key and add it to your config, or follow the Oracle docs. Your file should resemble:
[DEFAULT]
user=<USER_OCID>
fingerprint=<USER_FINGERPRINT>
tenancy=<TENANCY_OCID>
region=<HOME_REGION>
key_file=<PATH_TO_PRIVATE_KEY_FILE>
The following inputs configure the Datadog OCI integration module. Required fields are noted. For the full list of available configuration options, see the add tenancy page.
1. Add a Datadog API key.
Click Select API Key and select an API key to use.
2. Create a Datadog application key.
Click Create, and an application key is generated and added to the field. Ensure to copy this value and save it in a secure location, as it cannot be accessed again after leaving this screen.
3. Add your OCI Tenancy OCID.
- Enter the OCID of the tenancy to be monitored by Datadog. Find it at cloud.oracle.com/tenancy.
- Optionally, choose a specific OCI compartment and subnets. Datadog recommends leaving this section blank to create a new OCI compartment and OCI Virtual Cloud Network (VCN) in each region of the tenancy.
4. Add your OCI User OCID.
Enter your User OCID. This user must have the Identity Domain Administrator role. Find it at cloud.oracle.com/identity/domains/my-profile.
To disable all log collection from the tenancy, click the toggle. If you want to disable log collection for specific OCI services, edit the configuration after setup.
The generated Terraform module should follow the format shown below:
module "datadog_oci" {
  source = "github.com/DataDog/oracle-cloud-integration//datadog-terraform-onboarding"

  datadog_api_key = <API_KEY>
  datadog_app_key = <APP_KEY>
  datadog_site    = <DATADOG_SITE>

  tenancy_ocid      = "<TENANCY_OCID>"
  current_user_ocid = "<CURRENT_USER_OCID>"

  logs_enabled = true
}
- Copy the generated Terraform module and paste it into a
.tf file. - Run
terraform init && terraform apply to initialize Terraform and create the integration. If you want to preview the changes, substitute plan for apply.
Troubleshooting
Timeouts
Re-run the Terraform command without changing the configuration.
Provider conflicts
If you encounter provider conflicts from the terraform init command, update your local provider configuration to match the module’s required versions.
Allow up to 15 minutes for warnings to clear.
Validation
View oci.* metrics in the OCI integration overview dashboard or Metrics Explorer page in Datadog.
OCI function metrics (oci.faas namespace) and container instance metrics (oci_computecontainerinstance namespace) are in Preview.
Configuration
After completing the setup, a configuration tab for the tenancy becomes available on the left side of the Datadog OCI integration tile. Apply tenancy-wide data collection configurations as outlined in the sections below.
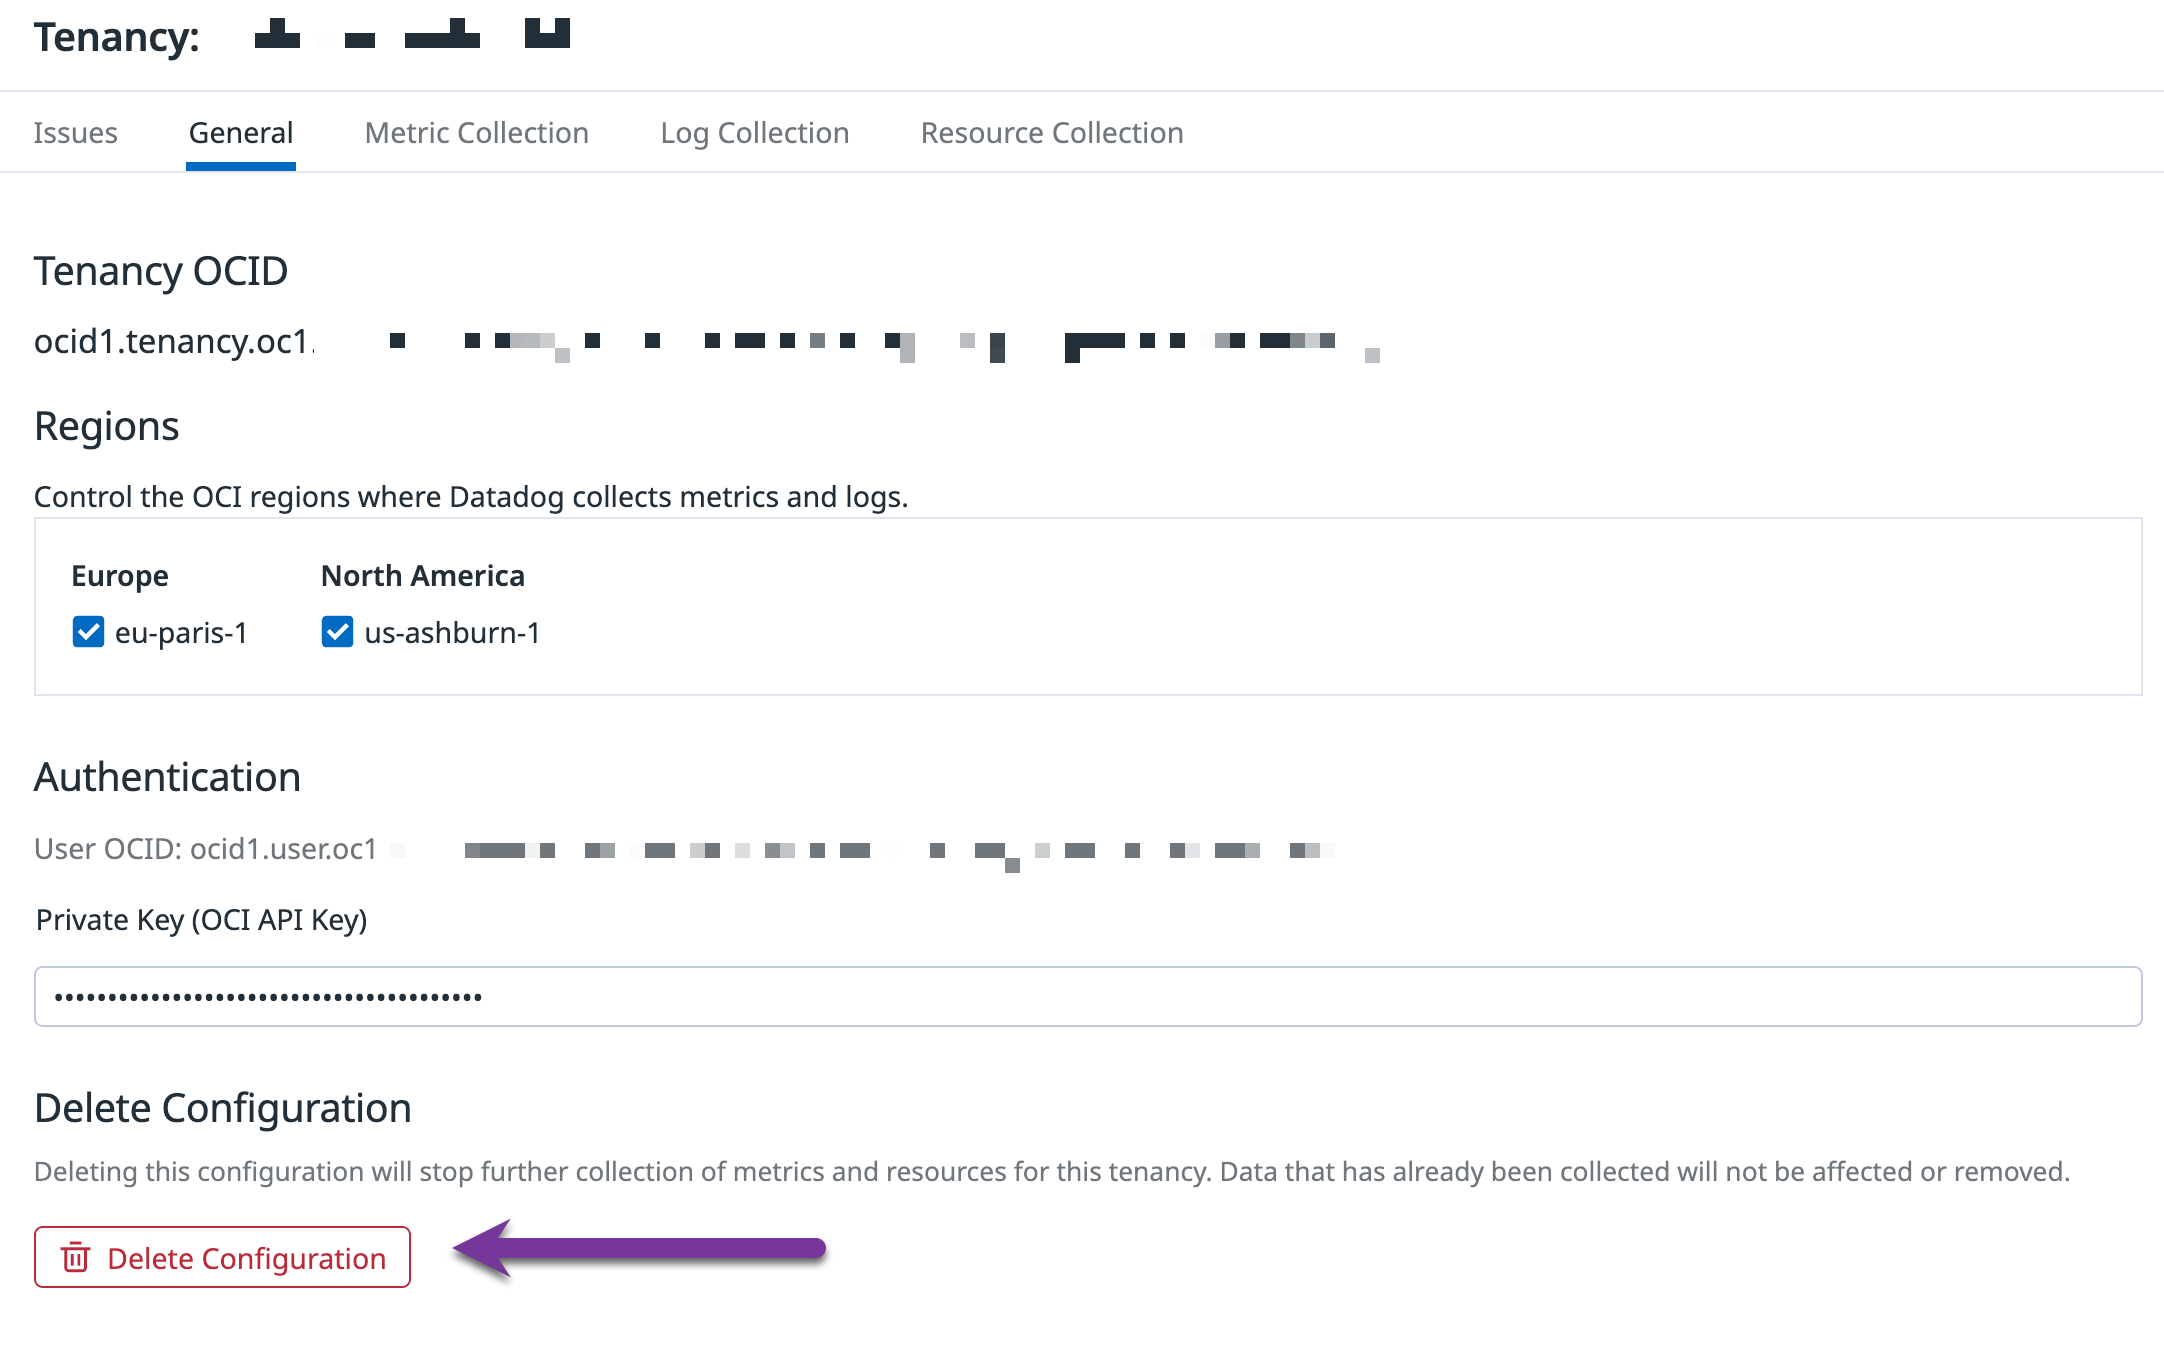
Add regions
On the General tab, select the regions for data collection from the Regions checkbox list. Region selections apply to the entire tenancy, for both metrics and logs.
Note: If you used the QuickStart setup method, and afterward subscribed to a new OCI region, reapply the initial setup stack in ORM. The new region then becomes available in the Datadog OCI tile.
Metric and log collection
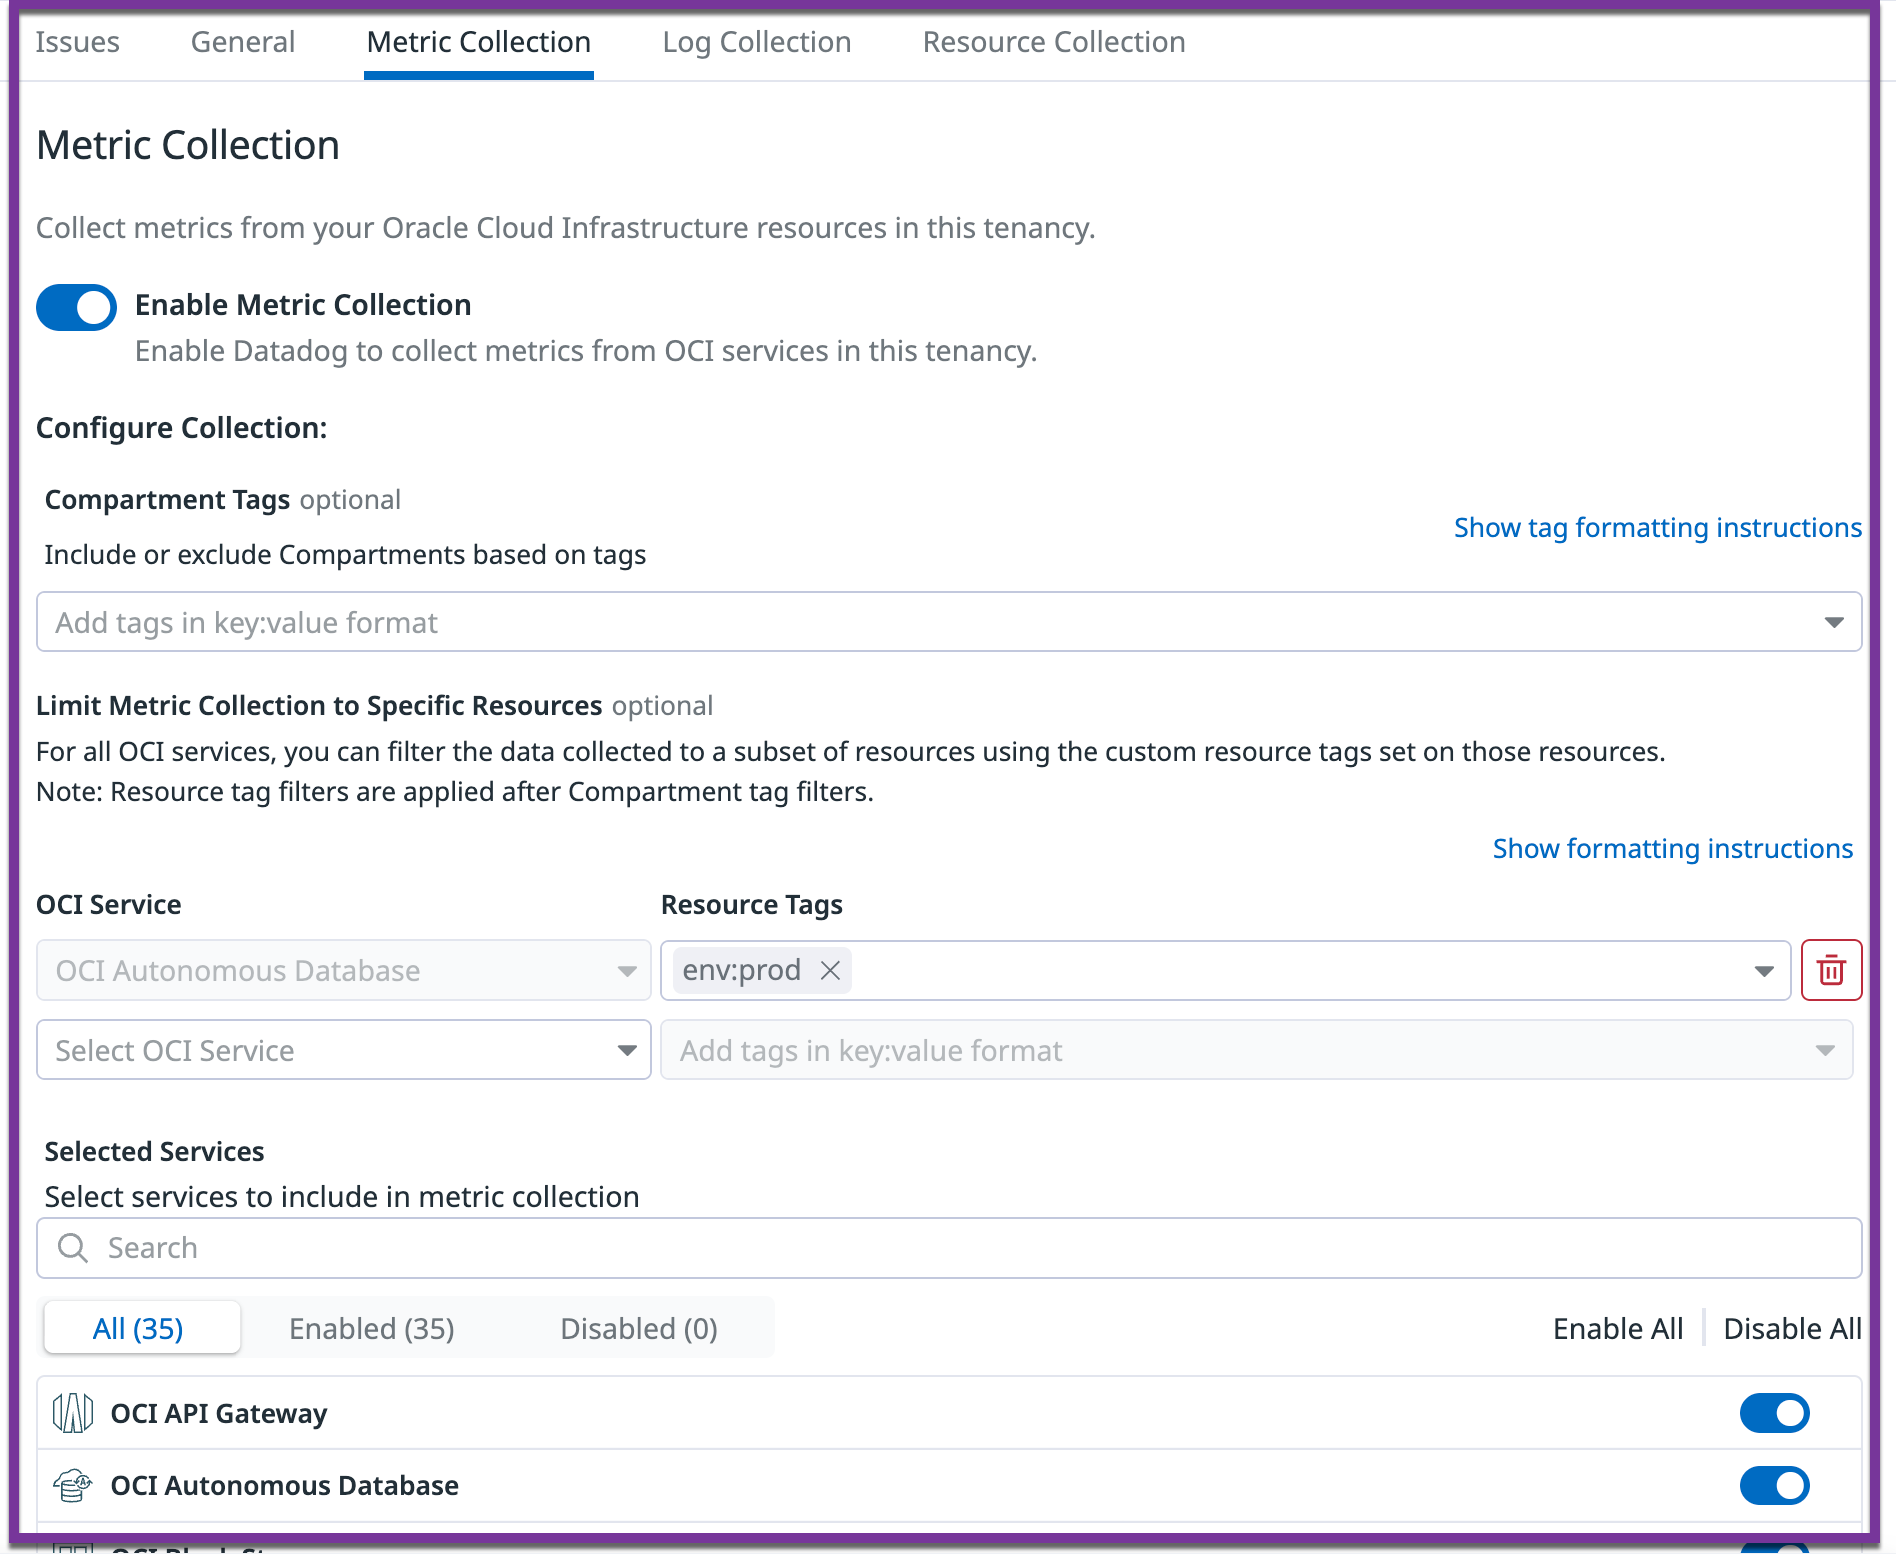
Use the Metric collection and Log collection tabs to configure which metrics and logs are sent to Datadog:
Enable or disable all metric or log collection from a tenancy
Both the metric and log collection tabs have a main toggle you can use to disable collection of that data type for the entire tenancy. If you do collect a given data type for the tenancy, you can use the sections below to implement granular filtering by service, compartment, and specific resources.
Note: Filters are evaluated in order: Selected Services acts as the primary toggle for data collection from a service, then compartment tag filters are applied, and finally resource tag filters.
Limit metric or log collection to specific OCI services
Use the Selected Services section to enable or disable collection from individual OCI services. Disabling a service stops all collection from it, regardless of any resource tag filters configured for it. When a service is enabled, resource tag filters can further narrow collection to specific resources within that service — resources without a matching inclusion tag are excluded.
Note: After modifying tags in OCI, it may take up to 15 minutes for the changes to appear in Datadog. Service toggle changes may take up to 5 minutes to take effect.
Both the Compartment Tags and Limit Collection to Specific Resources sections accept comma-separated key:value OCI tags. Prefix a tag with ! to negate it. The comma separator behaves differently depending on the tag types used:
- Positive tags only: OR logic—included if the OCI object (compartment or specific resource) has any of the listed tags.
- Negative tags only (prefixed with
!): OR logic—excluded if any of the negated tags is present. - Mixed positive and negative tags: AND logic—must satisfy all listed conditions to be included.
For example:
datadog:monitored,env:prod*: include if either tag is present.
!env:staging,!testing:true: exclude if either tag is present.
datadog:monitored,!region:us-phoenix-1: include only if the datadog:monitored tag is present and the region:us-phoenix-1 tag is absent.
Limit metric or log collection by compartment
Use the Compartment Tags section to include or exclude specific compartments based on OCI compartment tags. See Tag filter syntax for syntax reference.
Note: In OCI, tags are not inherited by child compartments; each compartment must be tagged individually.
Limit metric or log collection to specific resources
Use the Limit Collection to Specific Resources section to define which resources should send their metrics or logs to Datadog. Select the OCI service from the dropdown, and then specify which resource tags should be targeted for data collection. See Tag filter syntax for syntax reference.
Resource Collection
On the Resource Collection tab of the Datadog OCI integration tile, click the Enable Resource Collection toggle. Resources are visible in the Datadog Resource Catalog.
Uninstalling the integration
To uninstall the Datadog OCI integration, delete the integration resources in both Datadog and OCI:
In Datadog
In the Datadog OCI integration tile, click Delete Configuration. At this point, metrics and logs are no longer collected.
In OCI
If you used the QuickStart setup method:
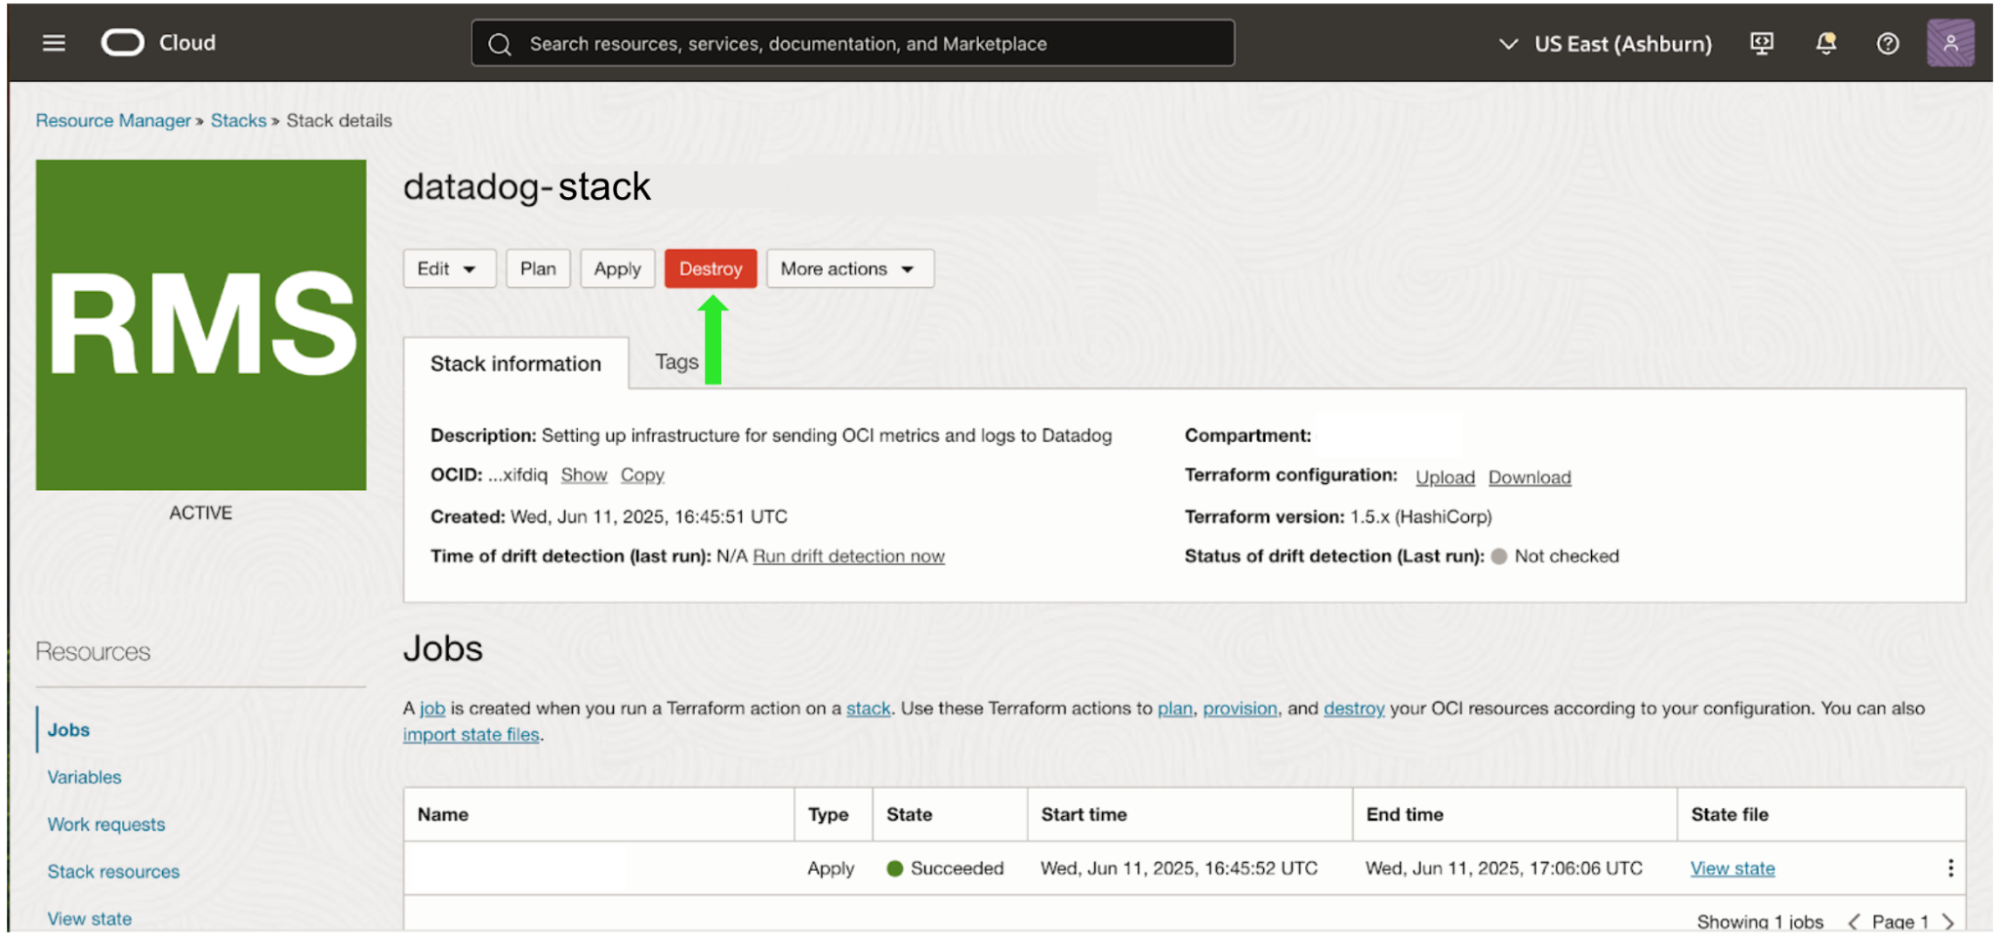
Navigate to the Oracle Resource Manager (ORM) in the OCI console.
Locate the Datadog QuickStart stack that was created during installation. By default, the stack is labeled as datadog-integration.zip-<NUMBER>, but could have been configured with a custom name during deployment.
Run a Destroy job on the stack to remove all resources created by the integration across all regions.
Optionally, delete the Datadog OCI stack after destruction is complete.
Note: Running the destroy job once on the QuickStart stack automatically cleans up all resources in all regions where the integration was deployed.
OCI integration manual to QuickStart migration
Why do I need to migrate?
The Datadog OCI integration is restricted to one integration per tenancy. If you had set up the integration prior to June 2025, you followed the manual setup, and any previous Datadog OCI integration deployment stacks must be deleted before using the OCI QuickStart setup method. If you manually configured log forwarding, and choose to enable log collection in the OCI QuickStart tile, you must also delete your log forwarding resources to avoid sending logs twice.
Note: There will be a gap in metrics and log collection from the time the manual integration is deleted to when the QuickStart deployment is complete.
How to migrate
Delete previous integration resources in both Datadog and OCI:
In Datadog
In the Datadog OCI integration tile, click Delete Configuration. At this point, metrics and logs are no longer collected.
In OCI
Complete the following steps for each region in which the manual integration was previously deployed:
Run a Destroy job on the Datadog OCI metric forwarding stack, to remove all the resources created by the stack. By default, the stack is labeled as datadog-oci-orm-metrics-setup.zip-<NUMBER>, but could have been configured with a custom value during deployment.
Run a Destroy job on the Datadog OCI policy stack. By default, the stack is labeled as datadog-oci-orm-policy-setup.zip-<NUMBER>, but could have been configured with a custom value during deployment.
Optionally, delete the Datadog OCI stacks after destruction is complete.
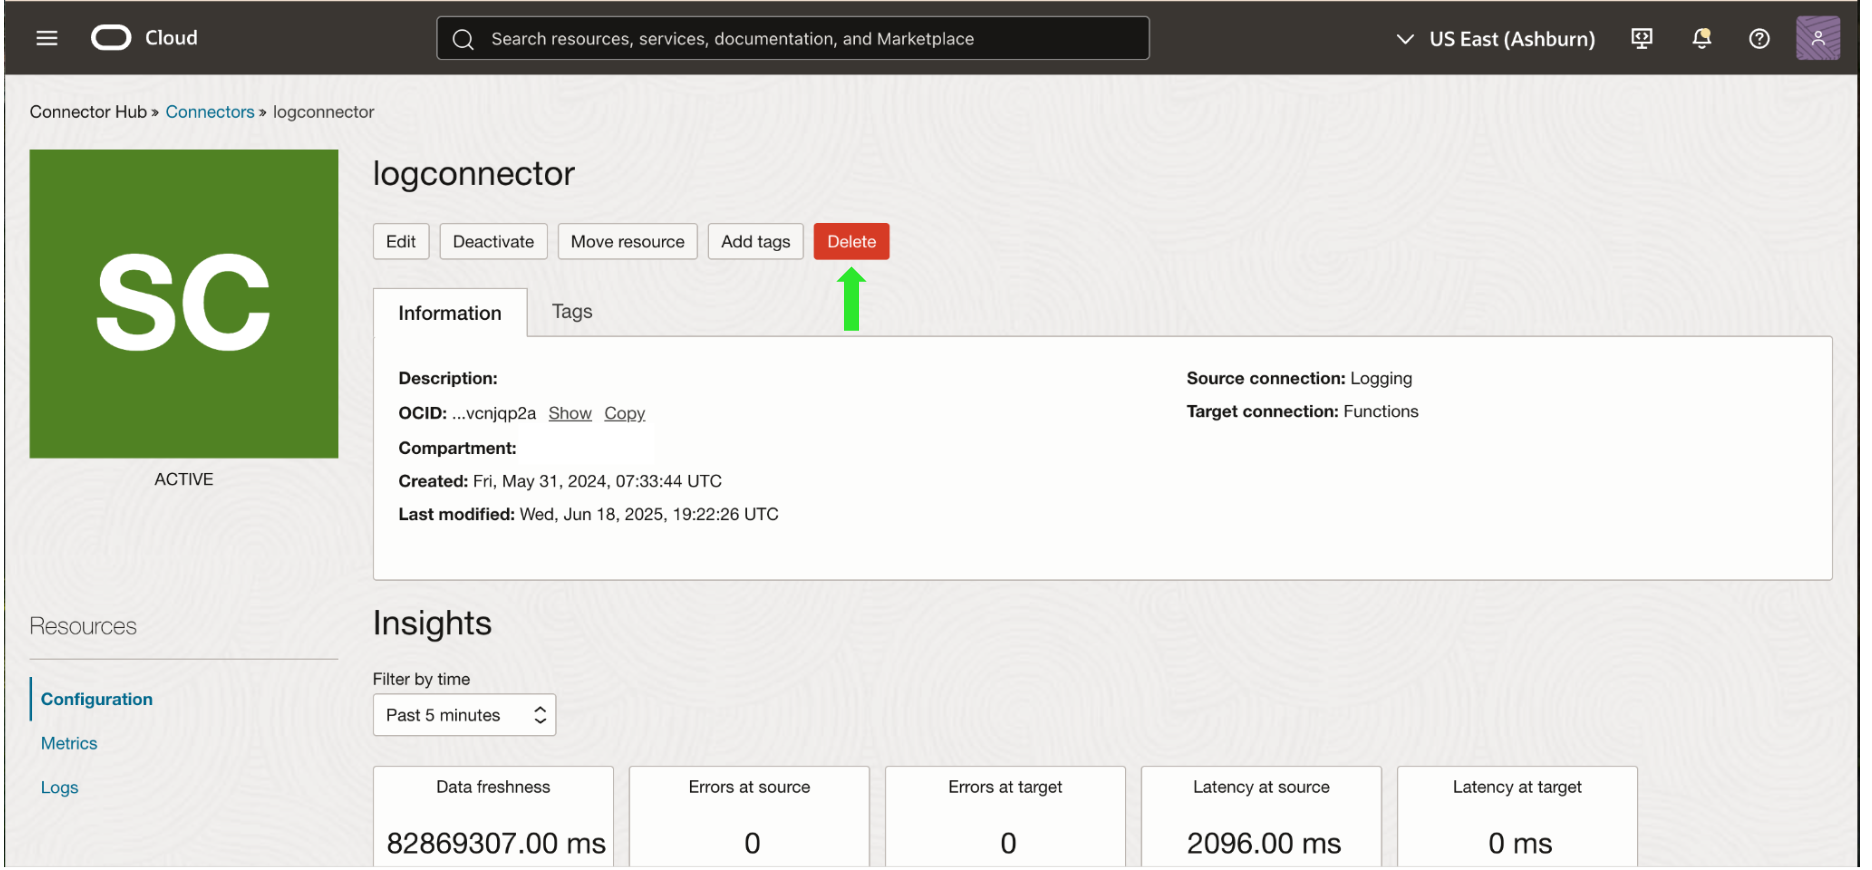
If you configured log collection, delete the Datadog OCI application, function, and service connector hub.
You are now ready to deploy OCI QuickStart with the QuickStart setup instructions and resume data collection. OCI QuickStart deployment can take up to 30 minutes to complete.
Architecture
Metric and log forwarding resources
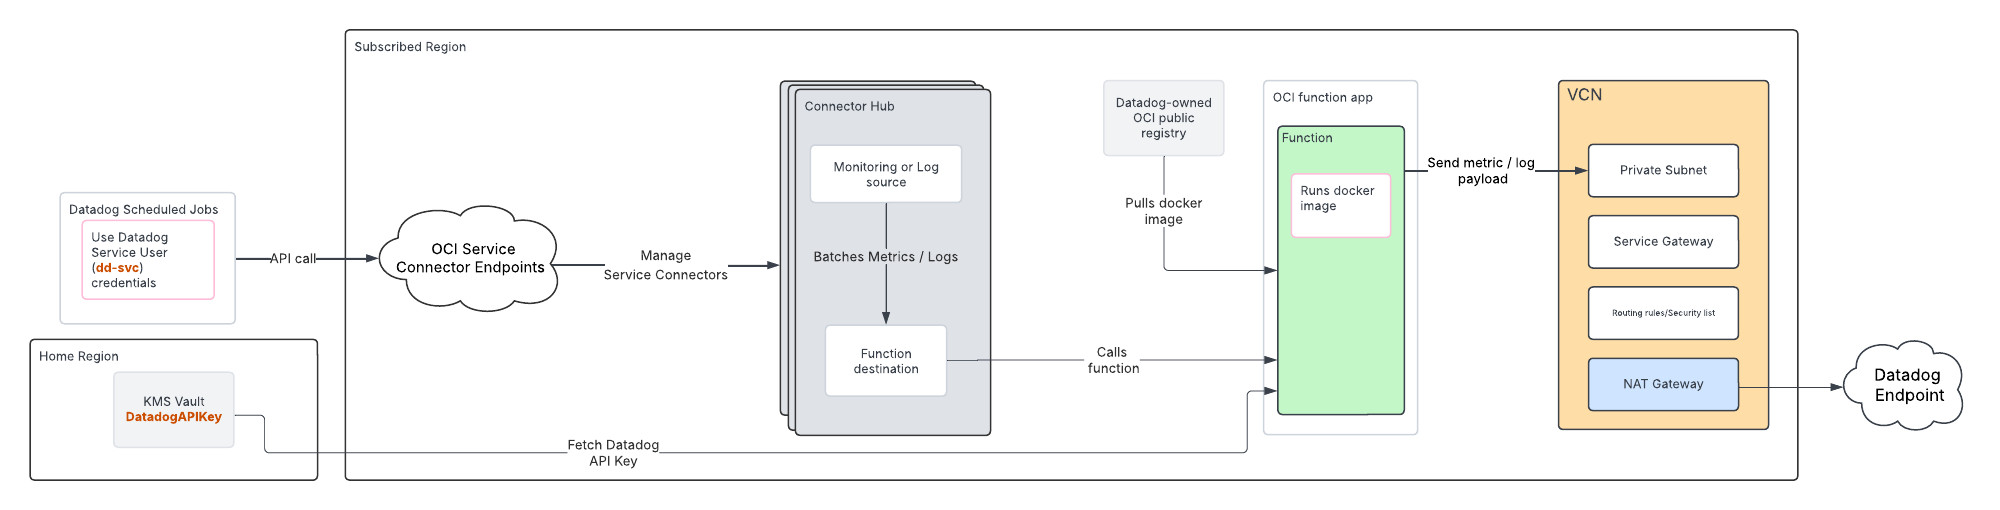
For each region monitored, this setup option creates the following infrastructure within that region to forward metrics and logs to Datadog:
- Function Application (
dd-function-app) - Two functions:
- Metrics Forwarder (
dd-metrics-forwarder) - Logs Forwarder (
dd-logs-forwarder)
- VCN (
dd-vcn) with secure networking infrastructure:- Private subnet (
dd-vcn-private-subnet) - NAT Gateway (
dd-vcn-natgateway) for external access to the internet - Service Gateway (
dd-vcn-servicegateway) for internal access to OCI services
- Key Management Service (KMS) vault (
datadog-vault) to store the Datadog API key - Dedicated Datadog compartment (
Datadog)
All resources are tagged with ownedby = "datadog".
IAM resources
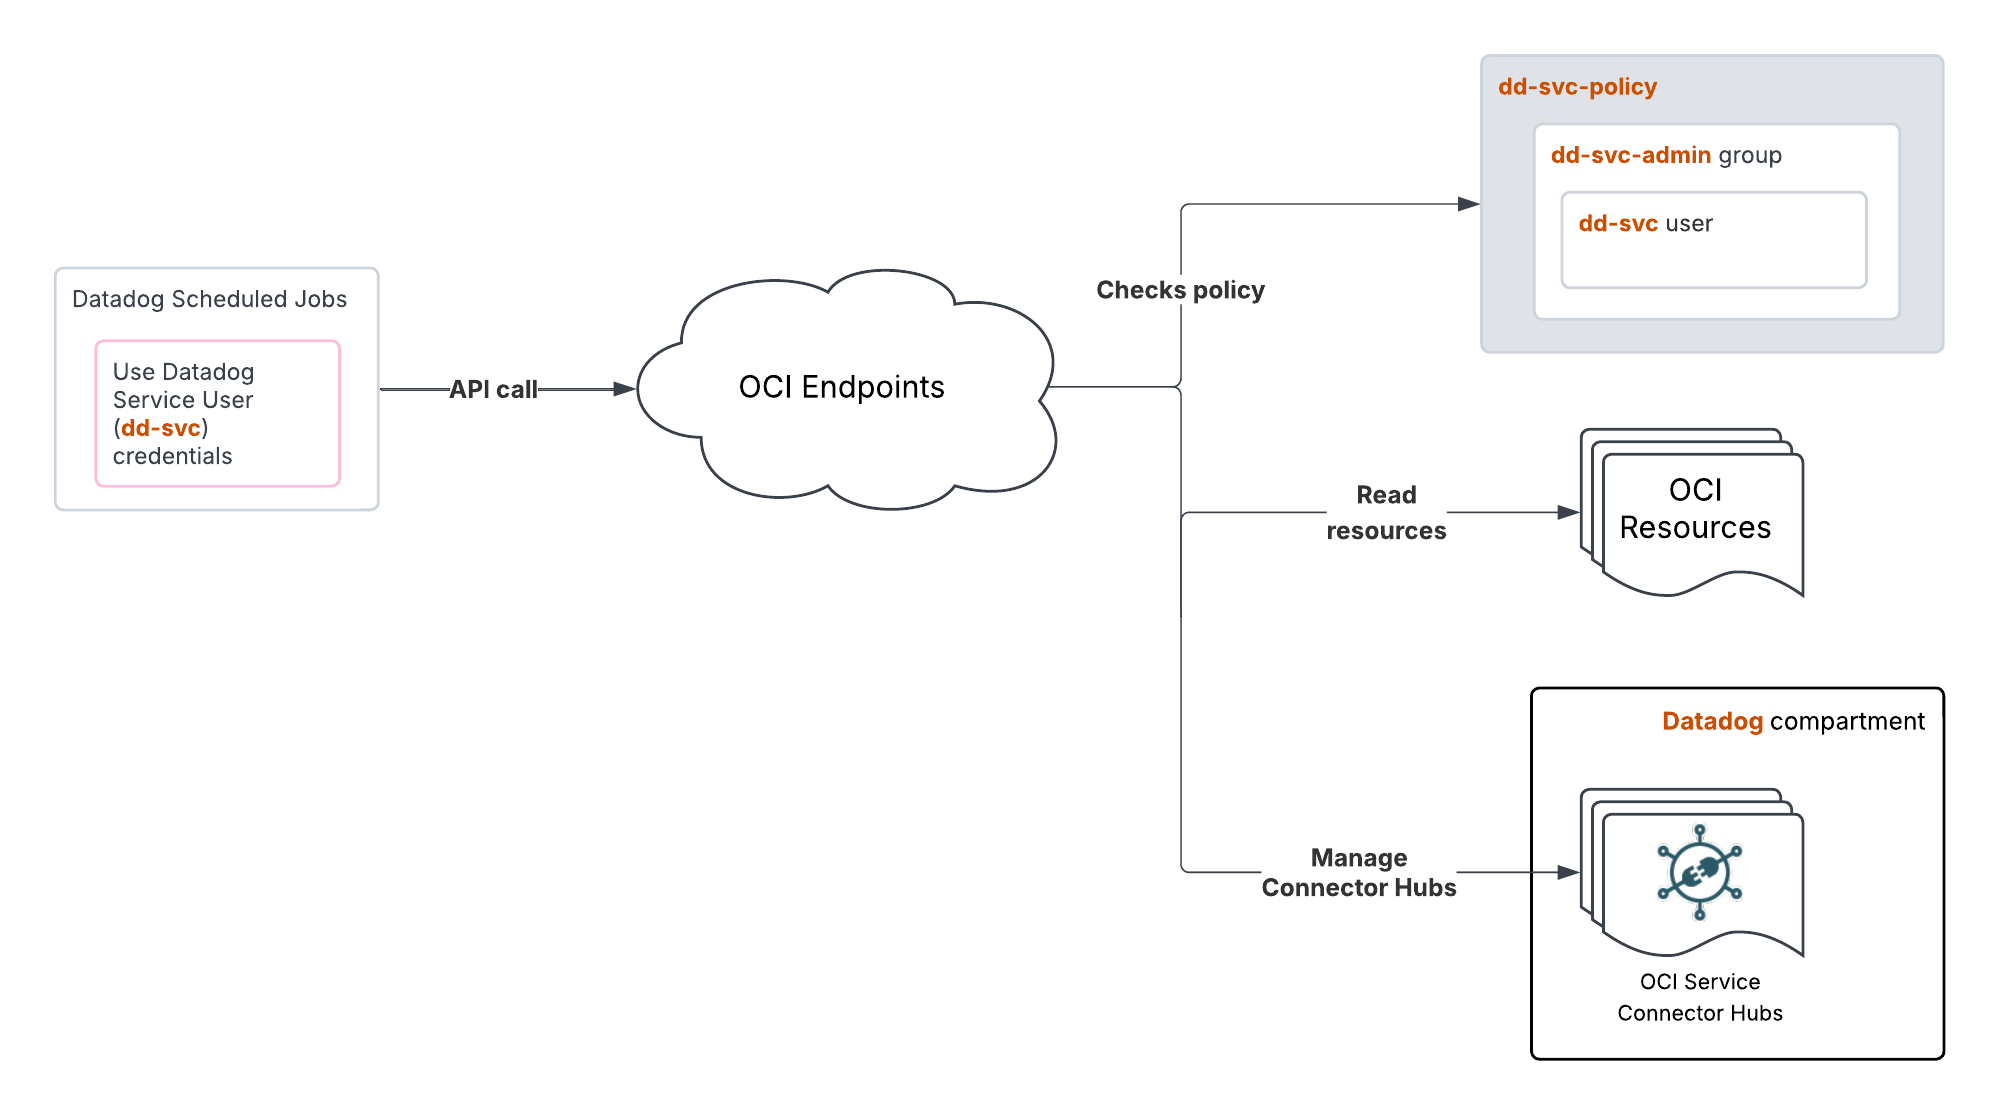
This setup option creates the following IAM resources to enable data forwarding to Datadog:
- Service user (
dd-svc). - Group (
dd-svc-admin) that the service user belongs to. - RSA key pair for API authentication.
- OCI API key for the service user.
- Dynamic Group (
dd-dynamic-group-connectorhubs) that includes all service connectors in the Datadog compartment. - Dynamic Group (
dd-dynamic-group-function) that includes all functions in the Datadog compartment. - Policy (
dd-svc-policy) to give the service user read access to the tenancy resources, as well as access to manage OCI Service Connector Hubs and OCI Functions in the compartment created and managed by Datadog.
- Allow dd-svc-admin to read all-resources in tenancy
- Allow dd-svc-admin to manage serviceconnectors in Datadog compartment
- Allow dd-svc-admin to manage functions-family in Datadog compartment with specific permissions:
     * FN_FUNCTION_UPDATE
     * FN_FUNCTION_LIST
     * FN_APP_LIST
- Endorse dd-svc-admin to read objects in tenancy usage-report
- Policy
dd-dynamic-group-policy to enable the service connectors to read data (logs and metrics) and interact with functions. This policy also allows the functions to read secrets in the Datadog compartment (the Datadog API and application keys stored in the KMS vault).
   - Allow dd-dynamic-group-connectorhubs to read log-content in tenancy
   - Allow dd-dynamic-group-connectorhubs to read metrics in tenancy
   - Allow dd-dynamic-group-connectorhubs to use fn-function in Datadog compartment
   - Allow dd-dynamic-group-connectorhubs to use fn-invocation in Datadog compartment
   - Allow dd-dynamic-group-functions to read secret-bundles in Datadog compartment
Choose manual setup if…
- You need to set up access manually for a small number of tenancies.
- You want more step-by-step control over assigning permissions and credentials within the OCI UI.
Manual setup prerequisites
Your OCI user account needs the Identity Domain Administrator role to complete these steps.
Your tenancy OCID.
A valid Datadog API key.
Username and auth token for a user with the REPOSITORY_READ and REPOSITORY_UPDATE permissions to pull and push images to a Docker repo.
Note: To verify the Docker registry login is correct, see Logging in to Oracle Cloud Infrastructure Registry.
Manual setup instructions
To manually forward your OCI metrics to Datadog:
For a visual representation of this architecture, see the Architecture section.
Enter tenancy info
Enter the OCID and home region of the tenancy you want to monitor in the Datadog OCI integration tile.
Create OCI policy stack
Ensure that the home region of the tenancy is selected in the top right of the screen.
This Oracle Resource Manager (ORM) policy stack should only be deployed once per tenancy.
- Click the Create Policy Stack button on the Datadog OCI integration tile.
- Accept the Oracle Terms of Use.
- Leave the option to use custom Terraform providers unchecked.
- Use the default name and compartment for the stack, or optionally provide your own descriptive name or compartment.
- Click Next.
- Leave the tenancy field and current user field as-is.
- Click Next.
- Click Create.
Enter DatadogROAuthUser info
- In the OCI console search bar, search for
DatadogROAuthUser and click on the User resource that appears. - Copy the user’s OCID value.
- Paste the value into the User OCID field in the Datadog OCI integration tile.
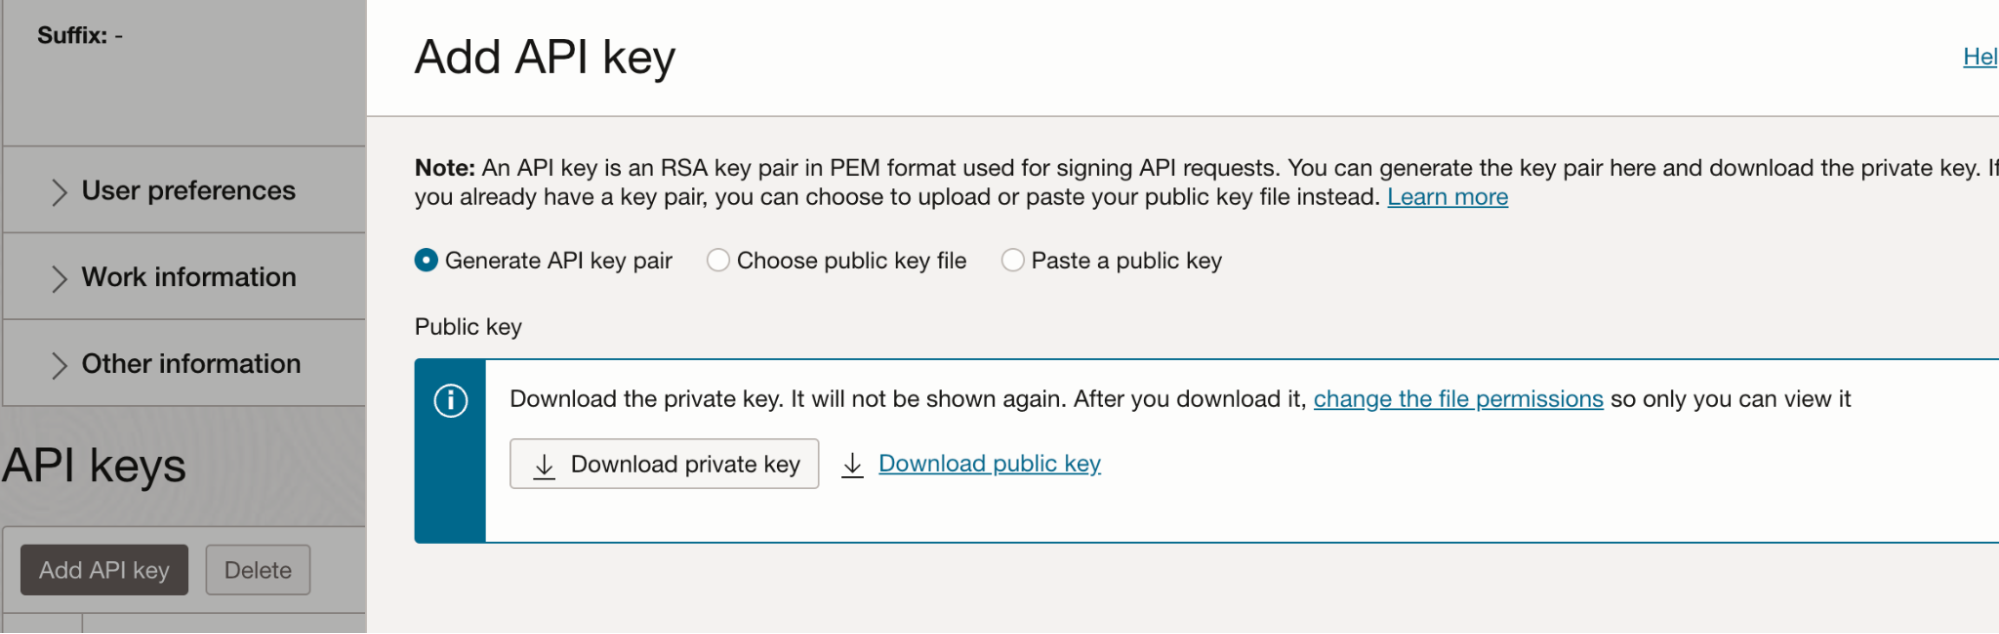
- Returning to the OCI console, generate an API key with these steps:
a. In the bottom left corner of the screen, under Resources, click API keys.
b. Click Add API key.
c. Click Download private key.
d. Click Add.
e. A Configuration file preview popup appears, but no action is needed; close the popup.
- Copy the fingerprint value, and paste it into the Fingerprint field on the Datadog OCI integration tile.
- Copy the private key value with these steps:
a. Open the downloaded private key
.pem file in a text editor, or use a terminal command such as cat to display the file’s contents.
b. Copy the entire contents, including -----BEGIN PRIVATE KEY----- and -----END PRIVATE KEY-----. - Paste the private key value into the Private Key field on the Datadog OCI integration tile.
Create OCI metric forwarding stack
The metric forwarding stack must be manually deployed for each combination of tenancy and region to be monitored. For the simplest setup, Datadog recommends creating all the necessary OCI resources with the Oracle Resource Manager (ORM) stack provided below. Alternatively, you can use your existing OCI networking infrastructure.
All resources created by Datadog’s ORM stack are deployed to the compartment specified, and for the region currently selected in the top right of the screen.
- Click the Create Metric Stack button on the Datadog OCI integration tile.
- Accept the Oracle Terms of Use.
- Leave the Custom providers option unchecked.
- Name the stack and select the compartment to deploy it to.
- Click Next.
- In the Datadog API Key field, enter your Datadog API key value.
- In the Network options section, Datadog recommends leaving
Create VCN checked.
Optionally, you can use an existing VCN instead. If you follow this approach, the subnet’s OCID must be provided to the stack. Make sure that the VCN:
- Is allowed to make HTTP egress calls through NAT gateway.
- Is able to pull images from OCI container registry using service gateway.
- Has the route table rules to allow NAT gateway and service gateway.
- Has the security rules to send HTTP requests.
- In the Network options section, uncheck the
Create VCN option and enter your VCN information:
a. In the vcnCompartment field, select your compartment.
b. In the existingVcn section, select your existing VCN.
c. In the Function Subnet OCID section, enter the OCID of the subnet to be used.
- In the Metrics settings section, optionally remove any metric namespaces from collection.
- In the Metrics compartments section, enter a comma-separated list of compartment OCIDs to monitor. Any metric namespace filters selected in the previous step are applied to each compartment.
- In the Function settings section, select
GENERIC_ARM. Select GENERIC_X86 if deploying in a Japan region. - Click Next.
- Click Create.
- Return to the Datadog OCI integration tile and click Create Configuration.
Notes:
By default, only the root compartment is selected, and all of the metric namespaces from Step 8 which are present in the compartment are enabled (up to 50 namespaces are supported per connector hub). If you choose to monitor additional compartments, the namespaces added to them are an intersection of namespaces selected and the namespaces present in the compartment.
You should manage who has access to the Terraform state files of the resource manager stacks. See the Terraform State Files section of the Securing Resource Manager page for more information.
Data Collected
Metrics
For a detailed list of metrics, select the appropriate OCI service in the metric namespace section.
Service Checks
The OCI integration does not include any service checks.
Events
The OCI integration does not include any events.
Troubleshooting
See the OCI Integration Troubleshooting guide to resolve issues related to the OCI integration.
Further Reading
Additional helpful documentation, links, and articles: