nutanix.api.rate_limited
(count) | Count of HTTP 429 rate limit responses from the Prism Central API. |
nutanix.cluster.aggregate_hypervisor.memory_usage
(gauge) | Total memory usage across all hypervisors in the cluster. |
nutanix.cluster.controller.avg_io_latency
(gauge) | Average I/O latency of the cluster storage controller. |
nutanix.cluster.controller.avg_read_io_latency
(gauge) | Average read I/O latency of the cluster storage controller. |
nutanix.cluster.controller.avg_write_io_latency
(gauge) | Average write I/O latency of the cluster storage controller. |
nutanix.cluster.controller.num_iops
(gauge) | Total IOPS on the cluster storage controller. |
nutanix.cluster.controller.num_read_iops
(gauge) | Total read IOPS on the cluster storage controller. |
nutanix.cluster.controller.num_write_iops
(gauge) | Total write IOPS on the cluster storage controller. |
nutanix.cluster.controller.read_io_bandwidth
(gauge) | Read I/O bandwidth of the cluster storage controller. |
nutanix.cluster.controller.write_io_bandwidth
(gauge) | Write I/O bandwidth of the cluster storage controller. |
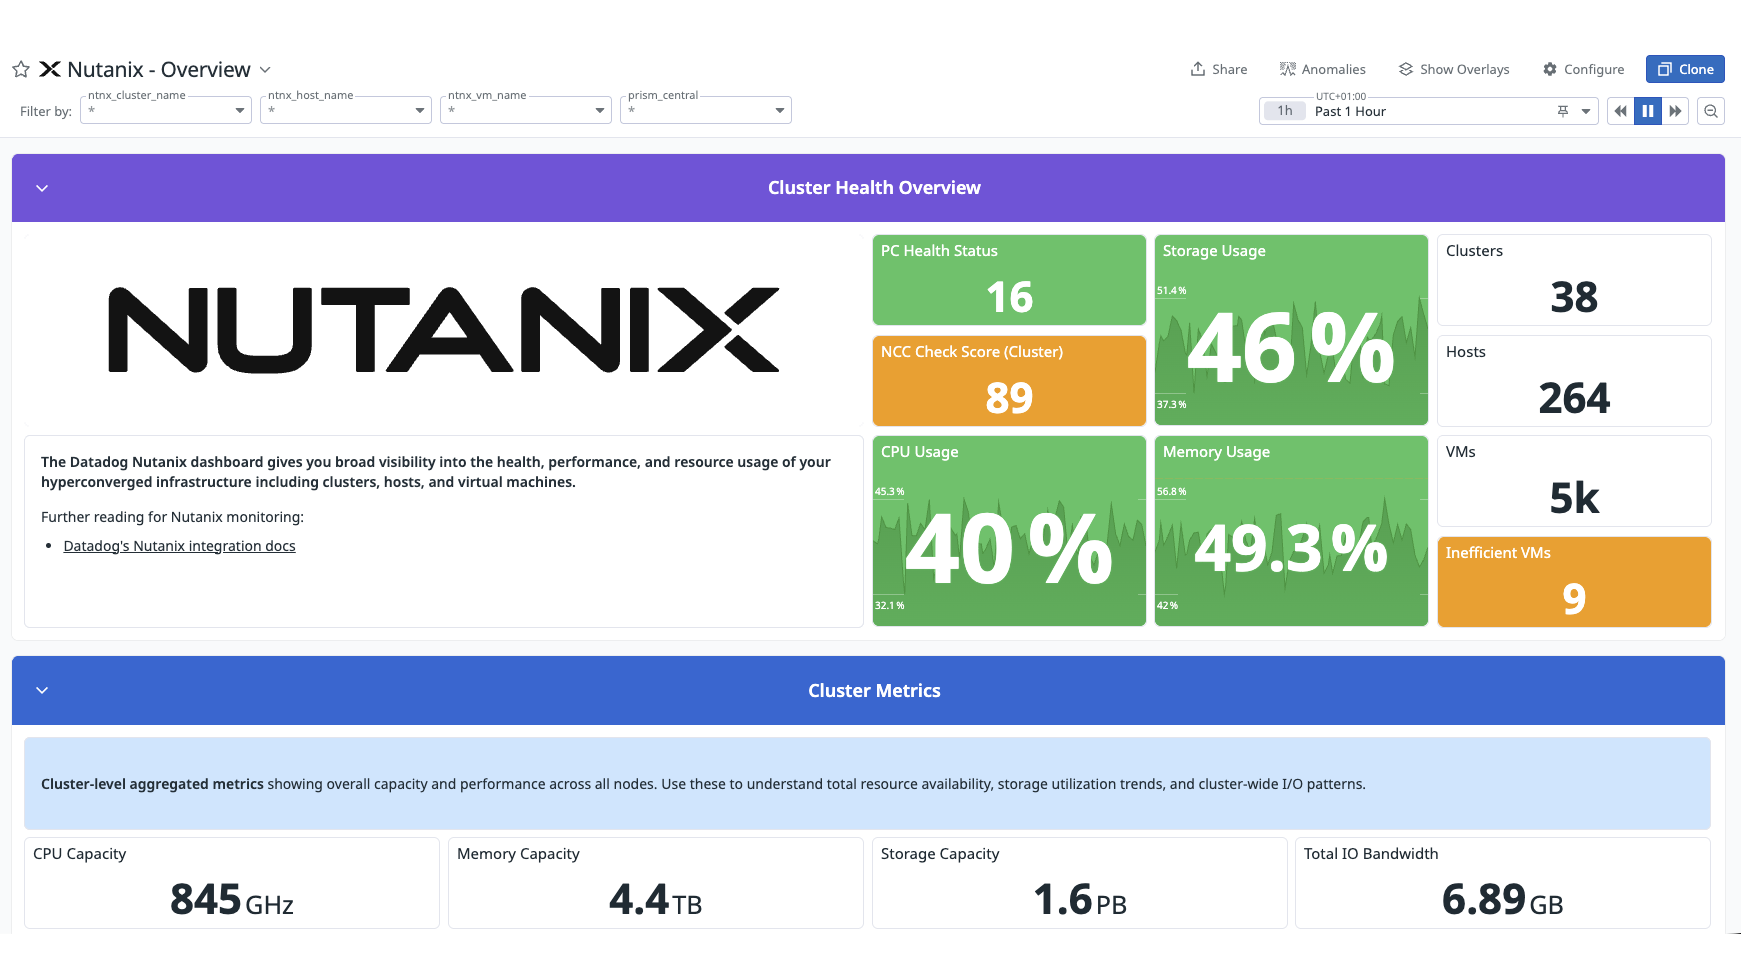
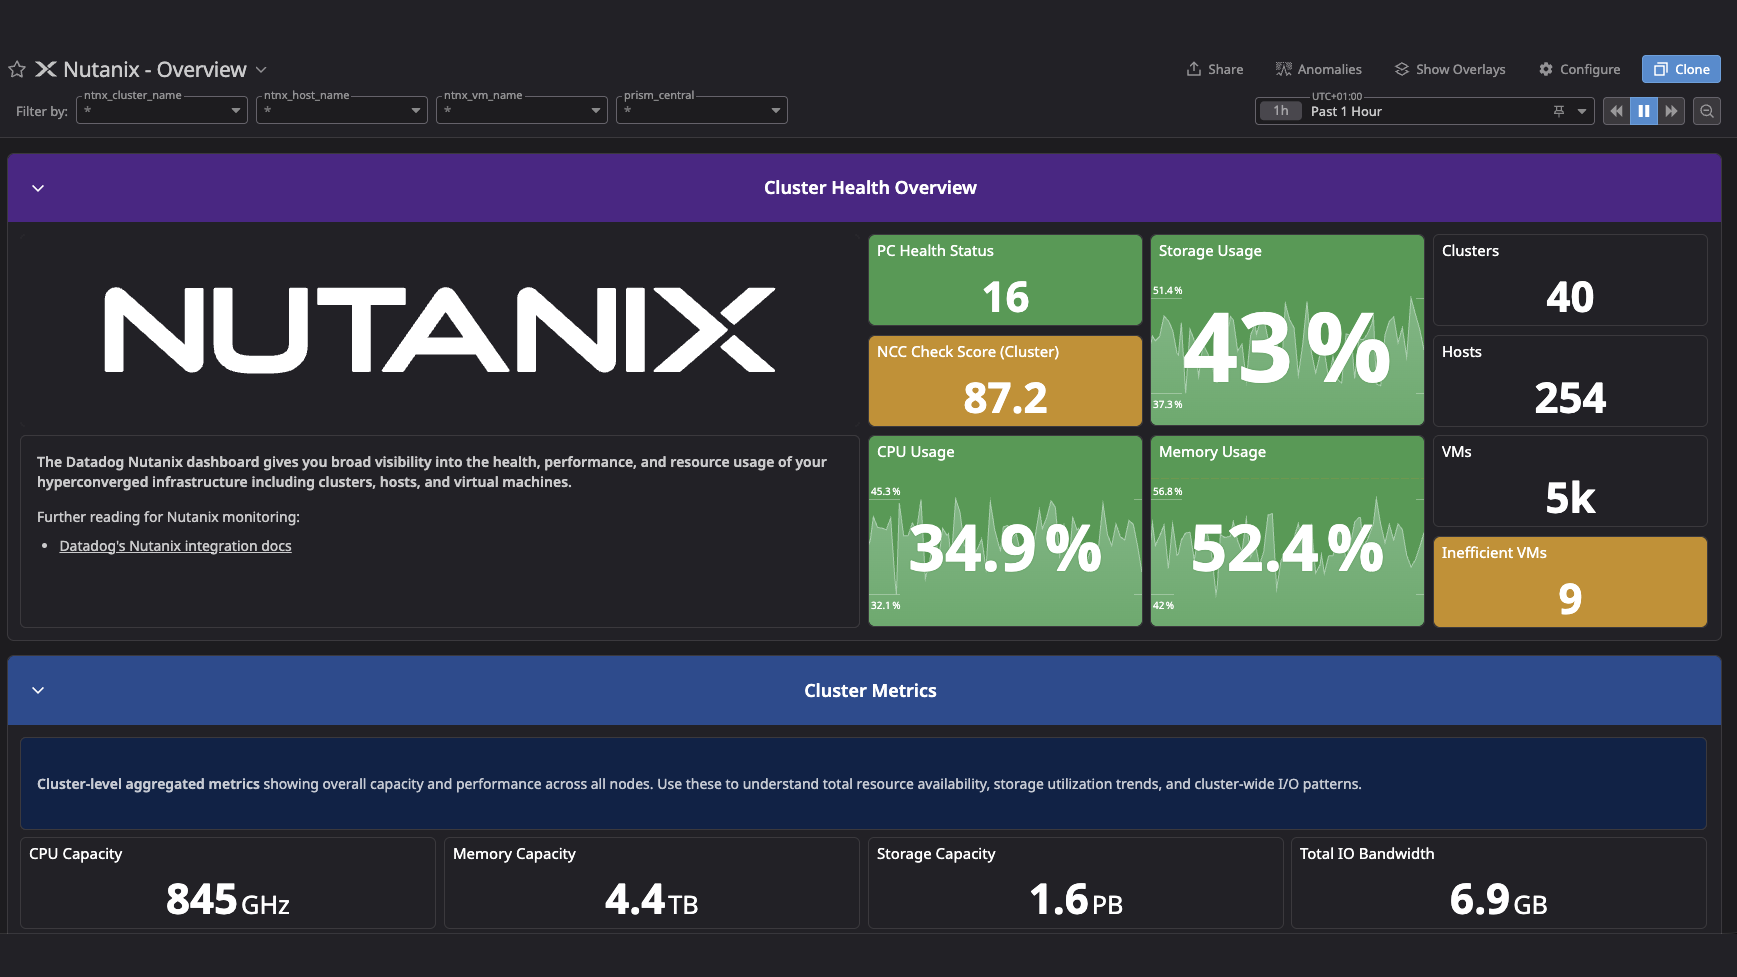
nutanix.cluster.count
(gauge) | Number of clusters. |
nutanix.cluster.cpu.total_cores
(gauge) | Total CPU cores in the cluster (sum of all hosts).
Shown as core |
nutanix.cluster.cpu.total_threads
(gauge) | Total CPU threads in the cluster (sum of all hosts). |
nutanix.cluster.cpu.vcpus_allocated
(gauge) | Total vCPUs allocated to VMs in the cluster. |
nutanix.cluster.free_physical_storage
(gauge) | Free physical storage in the cluster. |
nutanix.cluster.health_check_score
(gauge) | Cluster NCC check score indicating the health of the cluster. The value to health mapping is as follows: Good: 100, Info: 98, Warning: 74, Critical: 24, Error: 13, Unknown: -1. |
nutanix.cluster.hypervisor.cpu_usage
(gauge) | CPU usage across all hypervisors in the cluster. |
nutanix.cluster.io_bandwidth
(gauge) | Total I/O bandwidth of the cluster. |
nutanix.cluster.logical_storage_usage
(gauge) | Logical storage usage in the cluster. |
nutanix.cluster.memory.allocated_bytes
(gauge) | Total memory allocated to VMs in the cluster.
Shown as byte |
nutanix.cluster.memory.total_bytes
(gauge) | Total memory in the cluster (sum of all hosts).
Shown as byte |
nutanix.cluster.nbr_nodes
(gauge) | Number of nodes in the cluster. |
nutanix.cluster.overall_memory_usage
(gauge) | Overall memory usage in the cluster. |
nutanix.cluster.storage_capacity
(gauge) | Total storage capacity of the cluster. |
nutanix.cluster.storage_usage
(gauge) | Storage usage in the cluster. |
nutanix.cluster.vm.count
(gauge) | Number of VMs in the cluster. |
nutanix.cluster.vm.inefficient_count
(gauge) | Number of inefficient VMs in the cluster. |
nutanix.health.up
(gauge) | Reports whether the Agent can reach Prism Central. 1 = reachable; 0 = unreachable. |
nutanix.host.aggregate_hypervisor.memory_usage
(gauge) | Total memory usage across all hypervisors on the host. |
nutanix.host.controller.avg_io_latency
(gauge) | Average I/O latency of the host storage controller. |
nutanix.host.controller.avg_read_io_latency
(gauge) | Average read I/O latency of the host storage controller. |
nutanix.host.controller.avg_write_io_latency
(gauge) | Average write I/O latency of the host storage controller. |
nutanix.host.controller.num_iops
(gauge) | Total IOPS on the host storage controller. |
nutanix.host.controller.num_read_iops
(gauge) | Total read IOPS on the host storage controller. |
nutanix.host.controller.num_write_iops
(gauge) | Total write IOPS on the host storage controller. |
nutanix.host.controller.read_io_bandwidth
(gauge) | Read I/O bandwidth of the host storage controller. |
nutanix.host.controller.write_io_bandwidth
(gauge) | Write I/O bandwidth of the host storage controller. |
nutanix.host.count
(gauge) | Number of hosts. |
nutanix.host.cpu.cores
(gauge) | Total number of CPU cores in the host.
Shown as core |
nutanix.host.cpu.sockets
(gauge) | Number of CPU sockets in the host. |
nutanix.host.cpu.threads
(gauge) | Total number of CPU threads in the host. |
nutanix.host.cpu_capacity
(gauge) | CPU capacity of the host. |
nutanix.host.free_physical_storage
(gauge) | Free physical storage on the host. |
nutanix.host.health_check_score
(gauge) | Host NCC check score indicating the health of the host. The value to health mapping is as follows: Good: 100, Info: 98, Warning: 74, Critical: 24, Error: 13, Unknown: -1. |
nutanix.host.hypervisor.cpu_usage
(gauge) | CPU usage of the hypervisor on the host. |
nutanix.host.io_bandwidth
(gauge) | Total I/O bandwidth of the host. |
nutanix.host.logical_storage_usage
(gauge) | Logical storage usage on the host. |
nutanix.host.memory.bytes
(gauge) | Total memory in the host.
Shown as byte |
nutanix.host.memory_capacity
(gauge) | Total memory capacity of the host. |
nutanix.host.overall_memory_usage
(gauge) | Overall memory usage on the host. |
nutanix.host.status
(gauge) | Host node status. 0: Normal, 1: Warning, 2: Critical. |
nutanix.host.storage_capacity
(gauge) | Total storage capacity of the host. |
nutanix.host.storage_usage
(gauge) | Storage usage on the host. |
nutanix.vm.controller.avg_io_latency_micros
(gauge) | Average I/O latency of the VM storage controller.
Shown as microsecond |
nutanix.vm.controller.avg_read_io_latency_micros
(gauge) | Average read I/O latency of the VM storage controller.
Shown as microsecond |
nutanix.vm.controller.avg_read_io_size_kb
(gauge) | Average read I/O size for the VM storage controller.
Shown as kilobyte |
nutanix.vm.controller.avg_write_io_latency_micros
(gauge) | Average write I/O latency of the VM storage controller.
Shown as microsecond |
nutanix.vm.controller.avg_write_io_size_kb
(gauge) | Average write I/O size for the VM storage controller.
Shown as kilobyte |
nutanix.vm.controller.io_bandwidth_kbps
(gauge) | I/O bandwidth of the VM storage controller.
Shown as kilobyte |
nutanix.vm.controller.num_io
(gauge) | Total I/O operations on the VM storage controller. |
nutanix.vm.controller.num_iops
(gauge) | IOPS on the VM storage controller.
Shown as operation |
nutanix.vm.controller.num_read_io
(gauge) | Total read I/O operations on the VM storage controller. |
nutanix.vm.controller.num_read_iops
(gauge) | Read IOPS on the VM storage controller.
Shown as operation |
nutanix.vm.controller.num_write_io
(gauge) | Total write I/O operations on the VM storage controller. |
nutanix.vm.controller.num_write_iops
(gauge) | Write IOPS on the VM storage controller.
Shown as operation |
nutanix.vm.controller.oplog_drain_dest_hdd_bytes
(gauge) | Bytes drained from the VM storage controller oplog to HDD.
Shown as byte |
nutanix.vm.controller.oplog_drain_dest_ssd_bytes
(gauge) | Bytes drained from the VM storage controller oplog to SSD.
Shown as byte |
nutanix.vm.controller.read_io_bandwidth_kbps
(gauge) | Read I/O bandwidth of the VM storage controller.
Shown as kilobyte |
nutanix.vm.controller.read_io_ppm
(gauge) | Read I/O operations on the VM storage controller as a proportion (in parts per million). |
nutanix.vm.controller.read_source_estore_hdd_local_bytes
(gauge) | Bytes read by the VM storage controller from the local HDD extent store.
Shown as byte |
nutanix.vm.controller.read_source_estore_hdd_remote_bytes
(gauge) | Bytes read by the VM storage controller from the remote HDD extent store.
Shown as byte |
nutanix.vm.controller.read_source_estore_ssd_local_bytes
(gauge) | Bytes read by the VM storage controller from the local SSD extent store.
Shown as byte |
nutanix.vm.controller.read_source_estore_ssd_remote_bytes
(gauge) | Bytes read by the VM storage controller from the remote SSD extent store.
Shown as byte |
nutanix.vm.controller.read_source_oplog_bytes
(gauge) | Bytes read by the VM storage controller from the oplog.
Shown as byte |
nutanix.vm.controller.storage_tier_ssd_usage_bytes
(gauge) | SSD storage tier usage for the VM storage controller.
Shown as byte |
nutanix.vm.controller.timespan_micros
(gauge) | Timespan of the VM storage controller collection interval.
Shown as microsecond |
nutanix.vm.controller.total_io_size_kb
(gauge) | Total I/O size for the VM storage controller.
Shown as kilobyte |
nutanix.vm.controller.total_io_time_micros
(gauge) | Total I/O time for the VM storage controller.
Shown as microsecond |
nutanix.vm.controller.total_read_io_size_kb
(gauge) | Total read I/O size for the VM storage controller.
Shown as kilobyte |
nutanix.vm.controller.total_read_io_time_micros
(gauge) | Total read I/O time for the VM storage controller.
Shown as microsecond |
nutanix.vm.controller.total_transformed_usage_bytes
(gauge) | Total post-deduplication and compression usage for the VM storage controller.
Shown as byte |
nutanix.vm.controller.user_bytes
(gauge) | Total user data bytes managed by the VM storage controller.
Shown as byte |
nutanix.vm.controller.write_dest_estore_hdd_bytes
(gauge) | Bytes written by the VM storage controller to the HDD extent store.
Shown as byte |
nutanix.vm.controller.write_dest_estore_ssd_bytes
(gauge) | Bytes written by the VM storage controller to the SSD extent store.
Shown as byte |
nutanix.vm.controller.write_io_bandwidth_kbps
(gauge) | Write I/O bandwidth of the VM storage controller.
Shown as kilobyte |
nutanix.vm.controller.write_io_ppm
(gauge) | Write I/O operations on the VM storage controller as a proportion (in parts per million). |
nutanix.vm.controller.wss120second_read_mb
(gauge) | Read working set size over 120 seconds for the VM storage controller.
Shown as megabyte |
nutanix.vm.controller.wss120second_union_mb
(gauge) | Combined read and write working set size over 120 seconds for the VM storage controller.
Shown as megabyte |
nutanix.vm.controller.wss120second_write_mb
(gauge) | Write working set size over 120 seconds for the VM storage controller.
Shown as megabyte |
nutanix.vm.controller.wss3600second_read_mb
(gauge) | Read working set size over 3600 seconds for the VM storage controller.
Shown as megabyte |
nutanix.vm.controller.wss3600second_union_mb
(gauge) | Combined read and write working set size over 3600 seconds for the VM storage controller.
Shown as megabyte |
nutanix.vm.controller.wss3600second_write_mb
(gauge) | Write working set size over 3600 seconds for the VM storage controller.
Shown as megabyte |
nutanix.vm.count
(gauge) | Number of VMs. |
nutanix.vm.cpu.cores_per_socket
(gauge) | Number of CPU cores per socket allocated to the VM.
Shown as core |
nutanix.vm.cpu.sockets
(gauge) | Number of CPU sockets allocated to the VM. |
nutanix.vm.cpu.threads_per_core
(gauge) | Number of threads per core allocated to the VM. |
nutanix.vm.cpu.vcpus_allocated
(gauge) | Total vCPUs allocated to the VM (sockets * cores_per_socket). |
nutanix.vm.disk_capacity_bytes
(gauge) | Total disk capacity allocated to the VM.
Shown as byte |
nutanix.vm.disk_usage_ppm
(gauge) | Disk usage of the VM as a proportion (in parts per million). |
nutanix.vm.guest_memory_usage_ppm
(gauge) | Guest OS memory usage of the VM as a proportion (in parts per million). |
nutanix.vm.hypervisor.avg_io_latency_micros
(gauge) | Average I/O latency of the VM as reported by the hypervisor.
Shown as microsecond |
nutanix.vm.hypervisor.cpu_ready_time_ppm
(gauge) | CPU ready time of the VM as a proportion (in parts per million). |
nutanix.vm.hypervisor.cpu_usage_ppm
(gauge) | CPU usage of the VM as reported by the hypervisor (in parts per million). |
nutanix.vm.hypervisor.io_bandwidth_kbps
(gauge) | I/O bandwidth of the VM as reported by the hypervisor.
Shown as kilobyte |
nutanix.vm.hypervisor.memory_usage_ppm
(gauge) | Memory usage of the VM as reported by the hypervisor (in parts per million). |
nutanix.vm.hypervisor.num_io
(gauge) | Total I/O operations for the VM as reported by the hypervisor. |
nutanix.vm.hypervisor.num_iops
(gauge) | IOPS for the VM as reported by the hypervisor.
Shown as operation |
nutanix.vm.hypervisor.num_read_io
(gauge) | Total read I/O operations for the VM as reported by the hypervisor. |
nutanix.vm.hypervisor.num_read_iops
(gauge) | Read IOPS for the VM as reported by the hypervisor.
Shown as operation |
nutanix.vm.hypervisor.num_receive_packets_dropped
(gauge) | Number of received network packets dropped for the VM. |
nutanix.vm.hypervisor.num_received_bytes
(gauge) | Total bytes received over the network by the VM.
Shown as byte |
nutanix.vm.hypervisor.num_transmit_packets_dropped
(gauge) | Number of transmitted network packets dropped for the VM. |
nutanix.vm.hypervisor.num_transmitted_bytes
(gauge) | Total bytes transmitted over the network by the VM.
Shown as byte |
nutanix.vm.hypervisor.num_write_io
(gauge) | Total write I/O operations for the VM as reported by the hypervisor. |
nutanix.vm.hypervisor.num_write_iops
(gauge) | Write IOPS for the VM as reported by the hypervisor.
Shown as operation |
nutanix.vm.hypervisor.read_io_bandwidth_kbps
(gauge) | Read I/O bandwidth of the VM as reported by the hypervisor.
Shown as kilobyte |
nutanix.vm.hypervisor.timespan_micros
(gauge) | Timespan of the VM hypervisor collection interval.
Shown as microsecond |
nutanix.vm.hypervisor.total_io_size_kb
(gauge) | Total I/O size for the VM as reported by the hypervisor.
Shown as kilobyte |
nutanix.vm.hypervisor.total_io_time_micros
(gauge) | Total I/O time for the VM as reported by the hypervisor.
Shown as microsecond |
nutanix.vm.hypervisor.total_read_io_size_kb
(gauge) | Total read I/O size for the VM as reported by the hypervisor.
Shown as kilobyte |
nutanix.vm.hypervisor.vm_running_time_usecs
(gauge) | Total running time of the VM as reported by the hypervisor.
Shown as microsecond |
nutanix.vm.hypervisor.write_io_bandwidth_kbps
(gauge) | Write I/O bandwidth of the VM as reported by the hypervisor.
Shown as kilobyte |
nutanix.vm.memory.allocated_bytes
(gauge) | Memory allocated to the VM.
Shown as byte |
nutanix.vm.memory_usage_ppm
(gauge) | Memory usage of the VM as a proportion (in parts per million). |
nutanix.vm.num_vcpus_used_ppm
(gauge) | vCPU usage of the VM as a proportion (in parts per million). |
nutanix.vm.status
(gauge) | VM power state. 0: ON; 1: PAUSED; 2: OFF, UNDETERMINED, or UNKNOWN. |