Juniper SRX Firewall - Overview
Juniper SRX Firewall - Session Logs
Juniper SRX Firewall - Security Logs
Juniper SRX Firewall - Security Logs
Juniper SRX Firewall - Security Logs
Juniper SRX Firewall - Security Logs
Juniper SRX Firewall - Authentication Logs
Overview
Juniper SRX Firewall secures your network edge, data center, and cloud applications by detecting and mitigating intrusions, malware, and other threats.
This integration parses the following log types:
- Session Logs: Track network traffic and session activities, including initiated and denied sessions, application-related traffic, and dropped packets.
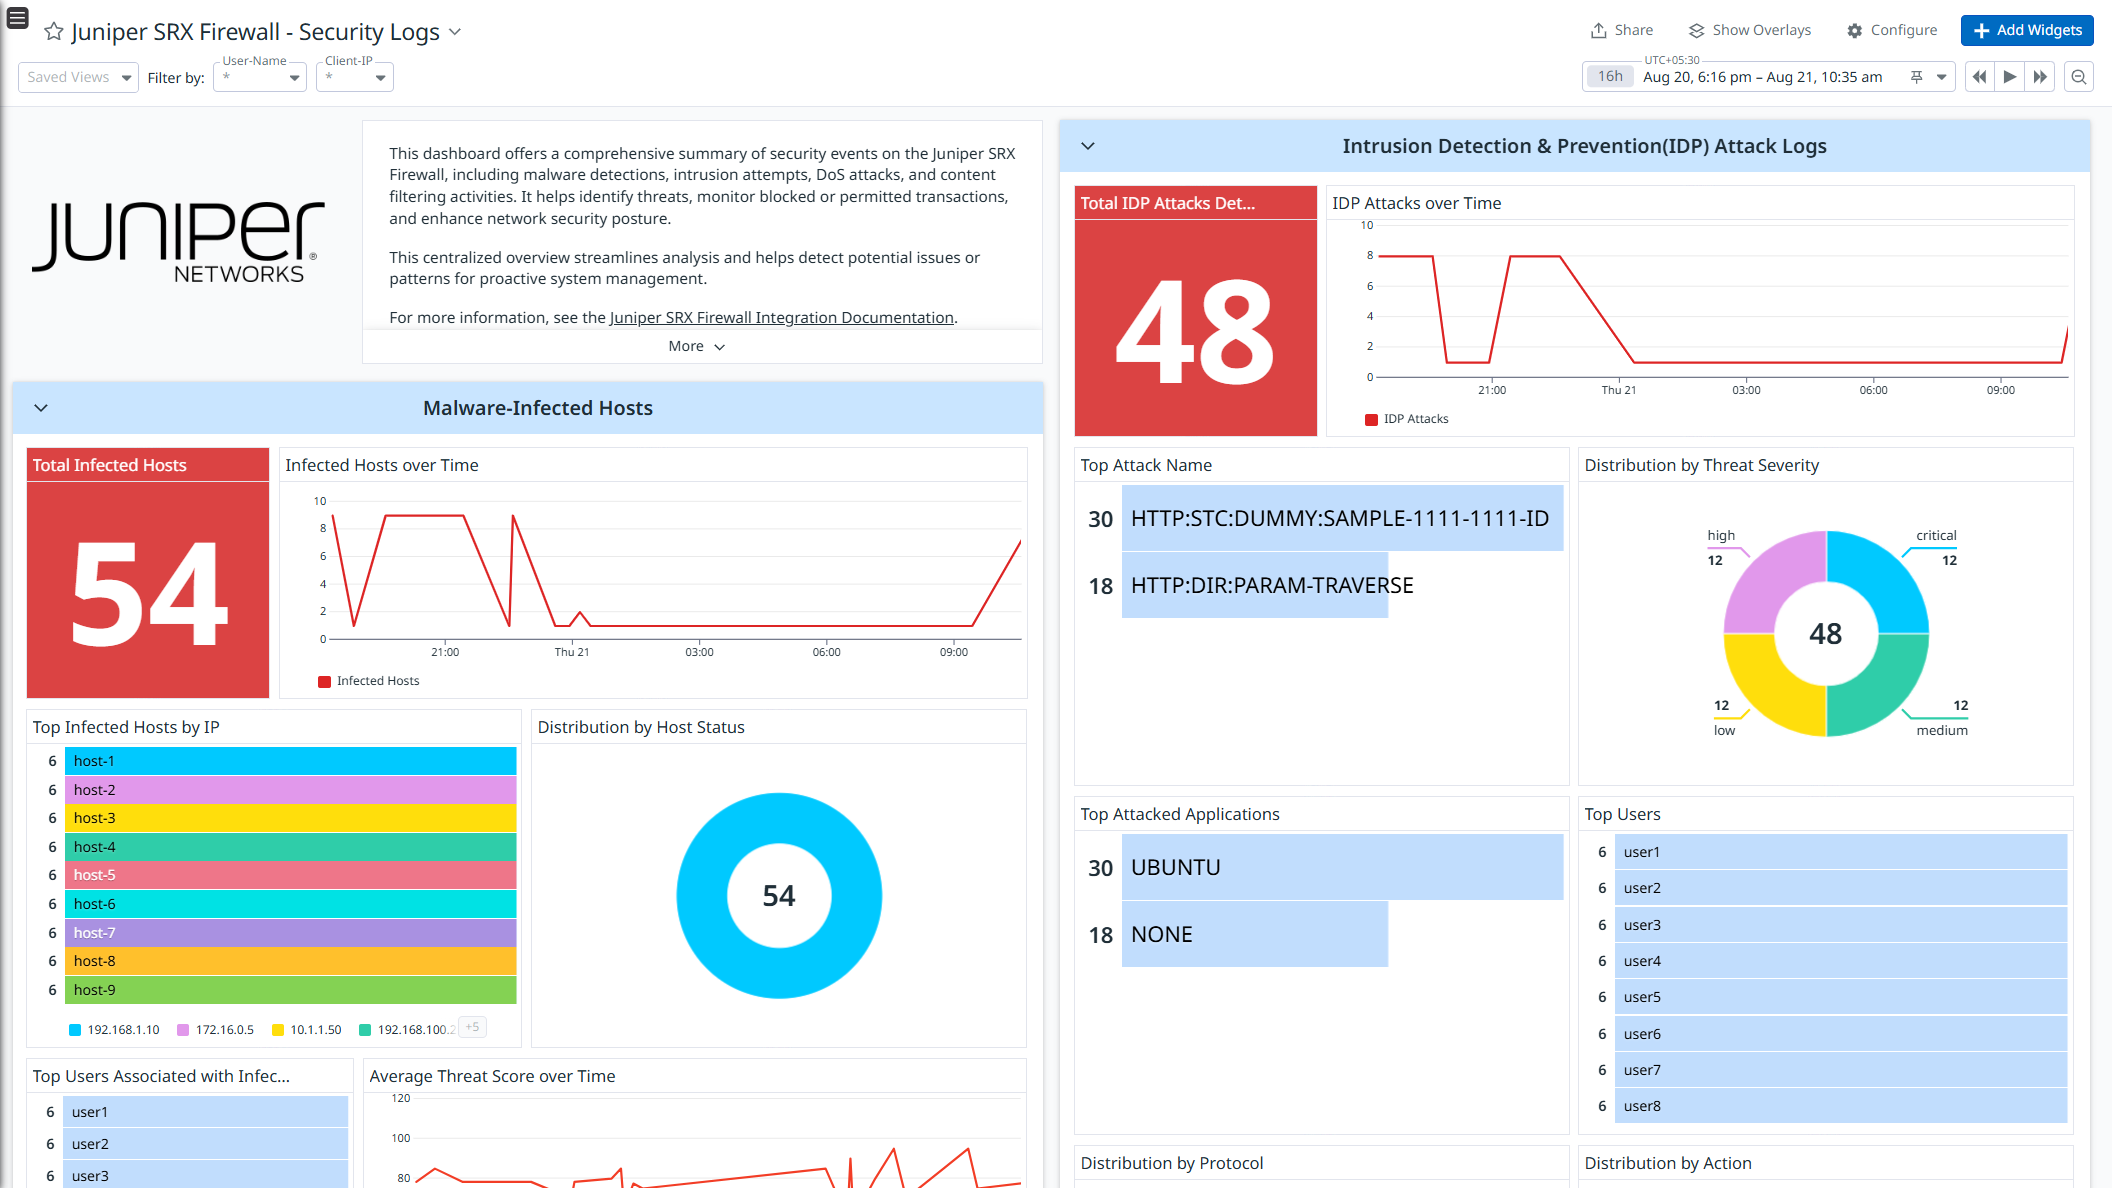
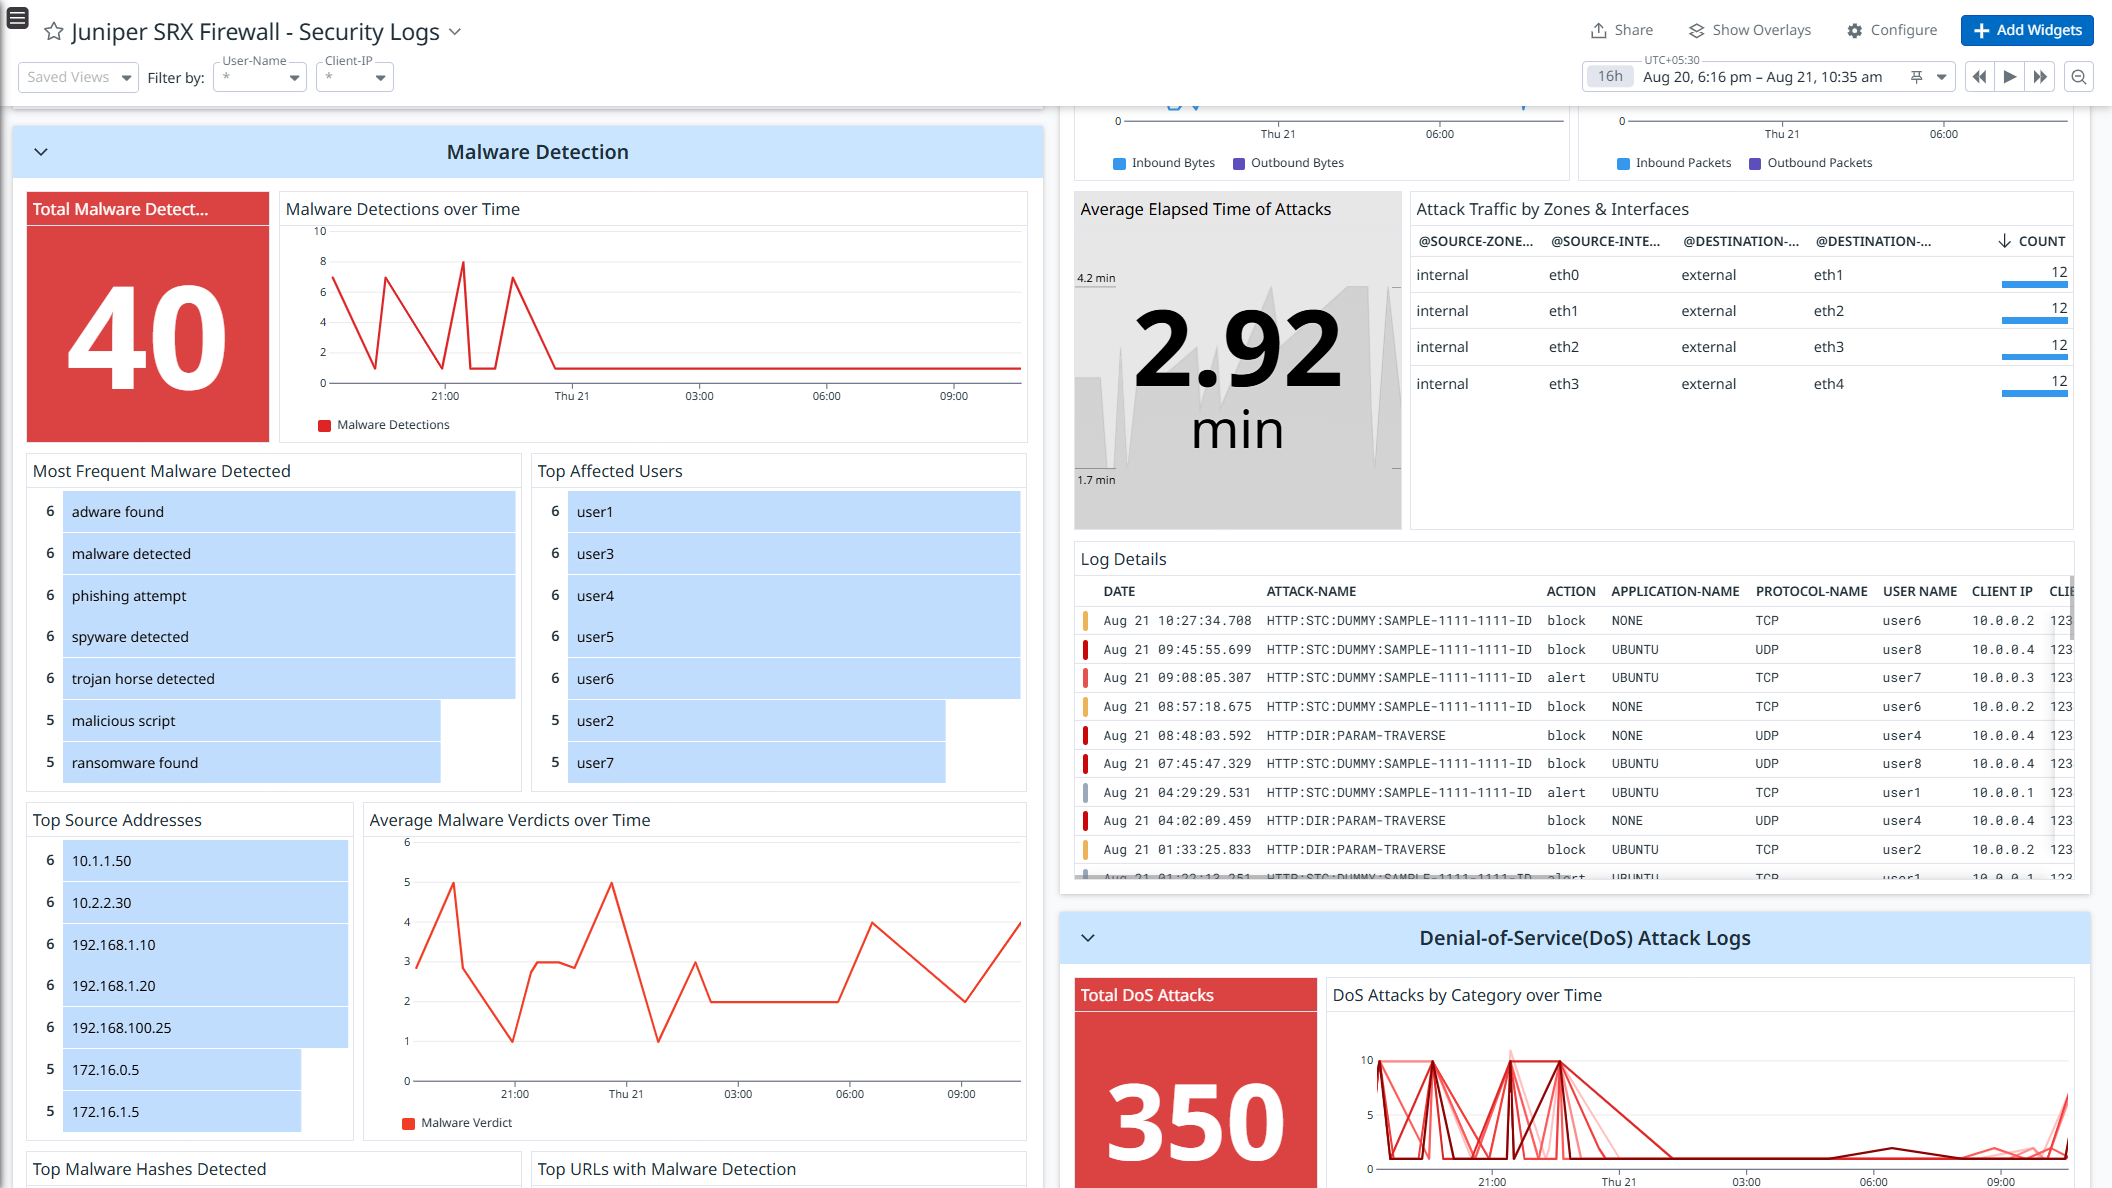
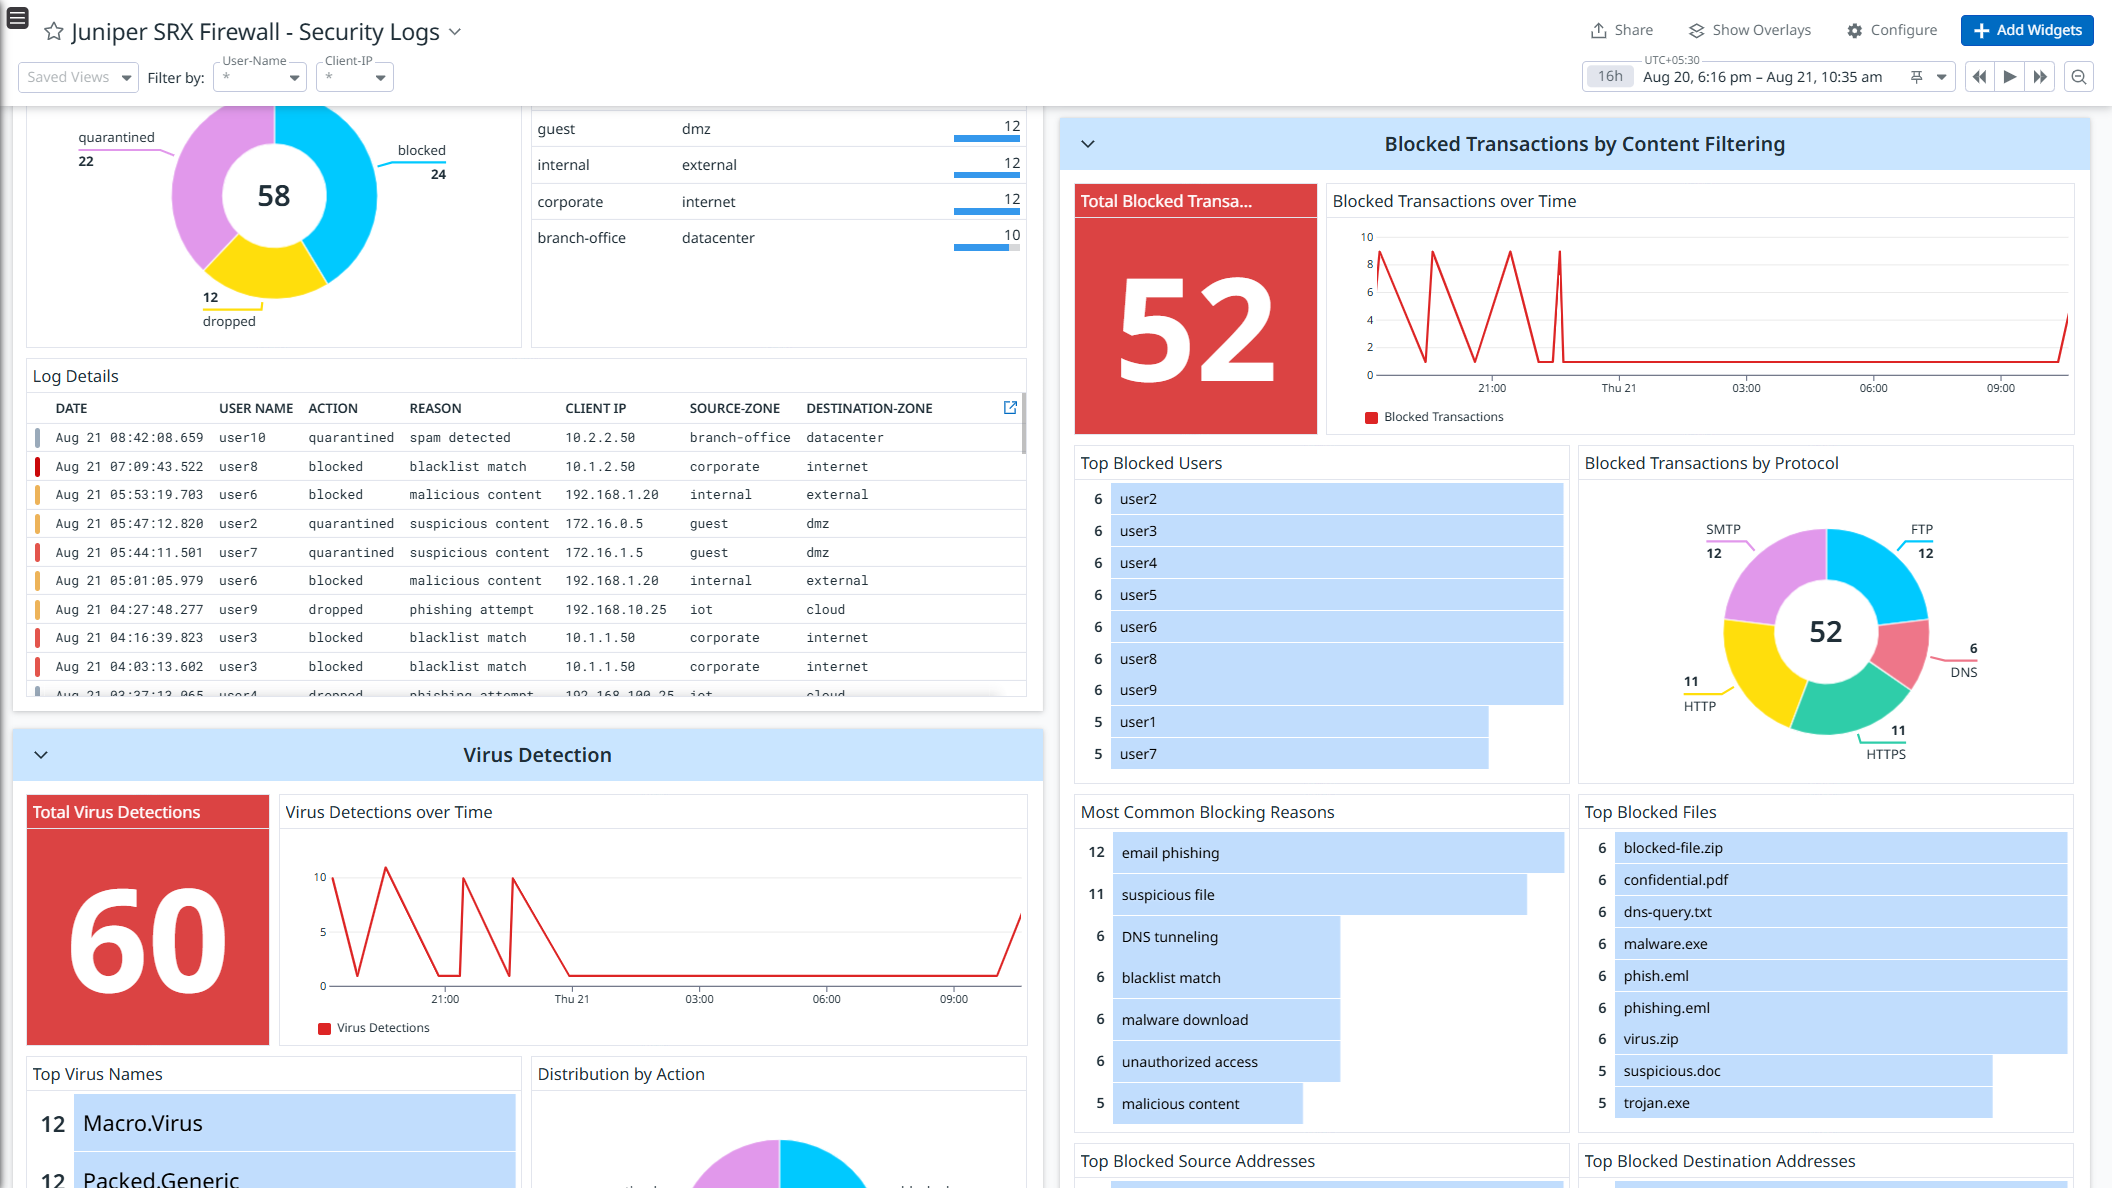
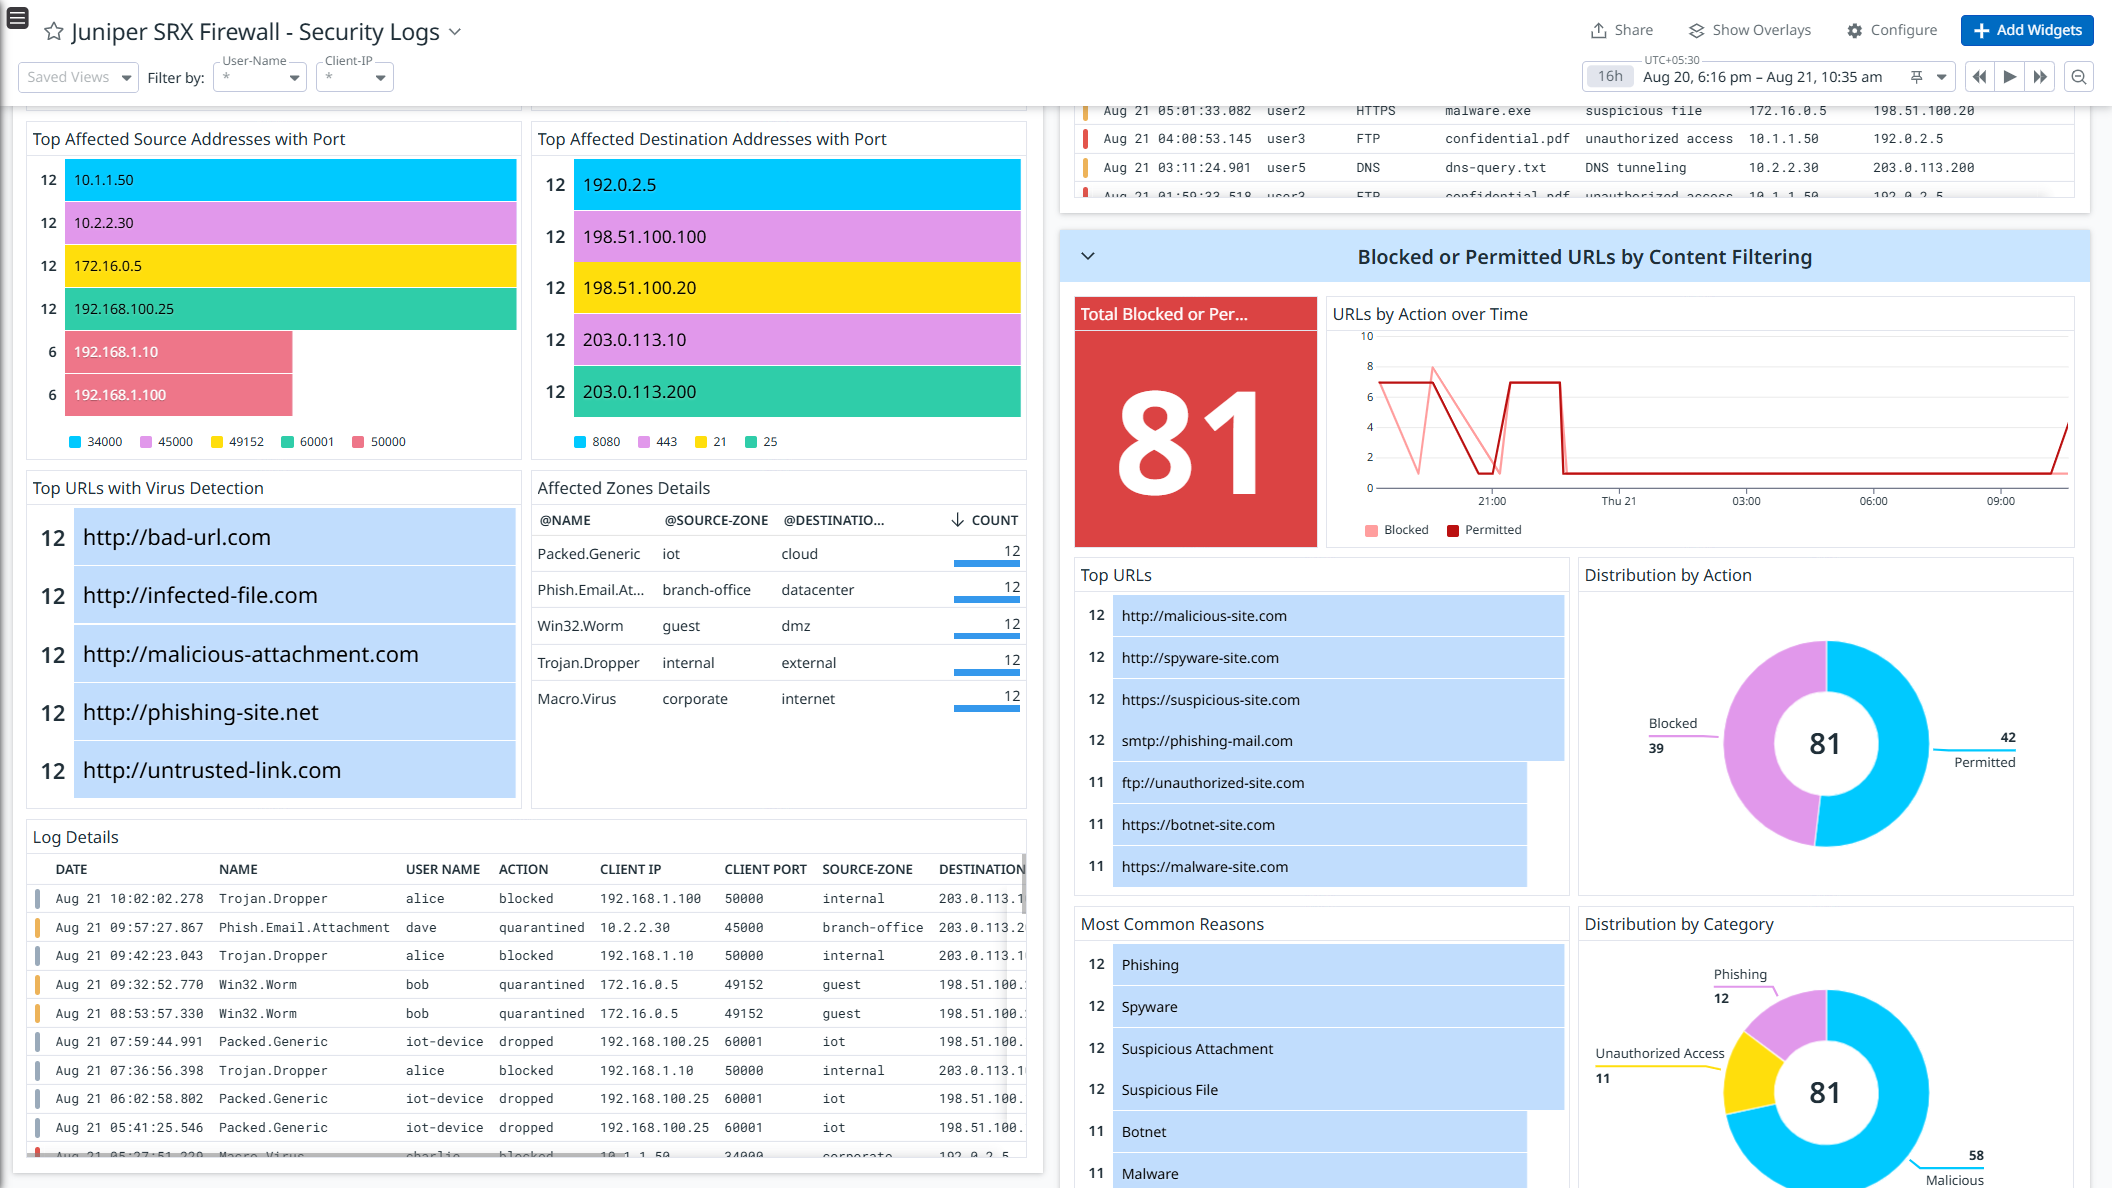
- Security Logs: Monitor security events such as malware detections, intrusion attempts, DoS attacks, and content filtering activities.
- Authentication Logs: Capture authentication activities, including successful and failed login attempts.
Get detailed visibility into these logs with out-of-the-box dashboards, and strengthen security with prebuilt Cloud SIEM detection rules for proactive threat monitoring and response.
Minimum Agent version: 7.67.0
Setup
Installation
To install the Juniper SRX Firewall integration, run the following Agent installation command in your terminal. For more information, see the Integration Management documentation.
Note: This step is not necessary for Agent version >= 7.64.0.
sudo -u dd-agent -- datadog-agent integration install datadog-juniper_srx_firewall==1.0.0
Configuration
Log collection is disabled by default in the Datadog Agent. Enable it in datadog.yaml:
Add the following configuration block to your juniper_srx_firewall.d/conf.yaml file to start collecting logs. See the sample conf.yaml for available configuration options.
logs:
  - type: udp
    port: <PORT>
    source: juniper-srx-firewall
    service: juniper-srx-firewall
Note:
PORT: Specify the UDP port that Datadog will listen on (default: 514).- Do not change the
service and source values, as they are integral to proper log pipeline processing.
Restart the Agent.
Log in to the Juniper SRX Firewall CLI.
Enter configuration mode:
To send logs to the Datadog Agent, execute the following commands:
set system syslog host <IP-ADDRESS> any any
set system syslog host <IP-ADDRESS> port <PORT>
set system syslog host <IP-ADDRESS> structured-data brief
Note:
- Replace
<IP-ADDRESS> with the Datadog Agent’s IP address. - Replace
<PORT> with the same port configured in Log Collection.
Verify if Security Logging is enabled:
If enabled, the output will display either mode stream; or mode event-stream;
If Security Logging is enabled, configure log streaming:
set security log stream <NAME> format sd-syslog
set security log stream <NAME> category all
set security log stream <NAME> host <IP-ADDRESS>
set security log stream <NAME> host port <PORT>
set security log transport protocol udp
Apply and exit the configuration:
Validation
Run the Agent’s status subcommand and look for juniper_srx_firewall under the Checks section.
Data Collected
Log
| Format | Event Types |
|---|
| Structured-Data(RFC 5424) | Session Logs, Security Logs, Authentication Logs |
Metrics
The Juniper SRX Firewall integration does not include any metrics.
Events
The Juniper SRX Firewall integration does not include any events.
Service Checks
The Juniper SRX Firewall integration does not include any service checks.
Troubleshooting
Permission denied while port binding
If you see a Permission denied error while port binding in the Agent logs:
Binding to a port number under 1024 requires elevated permissions. Grant access to the port using the setcap command:
sudo setcap CAP_NET_BIND_SERVICE=+ep /opt/datadog-agent/bin/agent/agent
Verify the setup is correct by running the getcap command:
sudo getcap /opt/datadog-agent/bin/agent/agent
With the expected output:
/opt/datadog-agent/bin/agent/agent = cap_net_bind_service+ep
Note: Re-run this setcap command every time you upgrade the Agent.
Restart the Agent.
Data is not being collected
Ensure firewall settings allow traffic through the configured port.
Port already in use
On systems running Syslog, the Agent may fail to bind to port 514 and display the following error:
Can't start UDP forwarder on port 514: listen udp :514: bind: address already in use
This error occurs because Syslog uses port 514 by default.
To resolve:
- Disable Syslog, OR
- Configure the Agent to listen on a different, available port.
For further assistance, contact Datadog support.