This guide provides advanced configuration options and reference architectures for users configuring Datadog’s Azure integration, as well as alternative configuration options for specific use cases.
Reference architectures
The diagrams in this guide provide a visual representation of the configuration process and outcome when following the steps in Getting Started with Azure. This guide provides a detailed overview of Datadog’s interaction with your Azure environment and answers common security, compliance, and governance questions.
Alternate configurations
The setup processes documented in Getting Started with Azure are the recommended steps and result in the ideal configuration for the majority of users. Alternate configuration options in this document may be preferable for certain use cases. Any trade-offs in performance, features, or ease-of-management are outlined as needed.
Metric and data collection
Enabling Datadog’s Azure integration allows Datadog to:
Discover and monitor all resources in all subscriptions within the given scope
Automatically update discovered metric definitions, to ensure that all of the metrics available from Azure Monitor are collected
Ingest a range of both general and resource-specific metadata (including custom Azure tags), and apply it to the associated resource metrics in Datadog as tags
The Azure APIs used and data collected are identical regardless of whether you use the standard or Azure Native version of the integration.
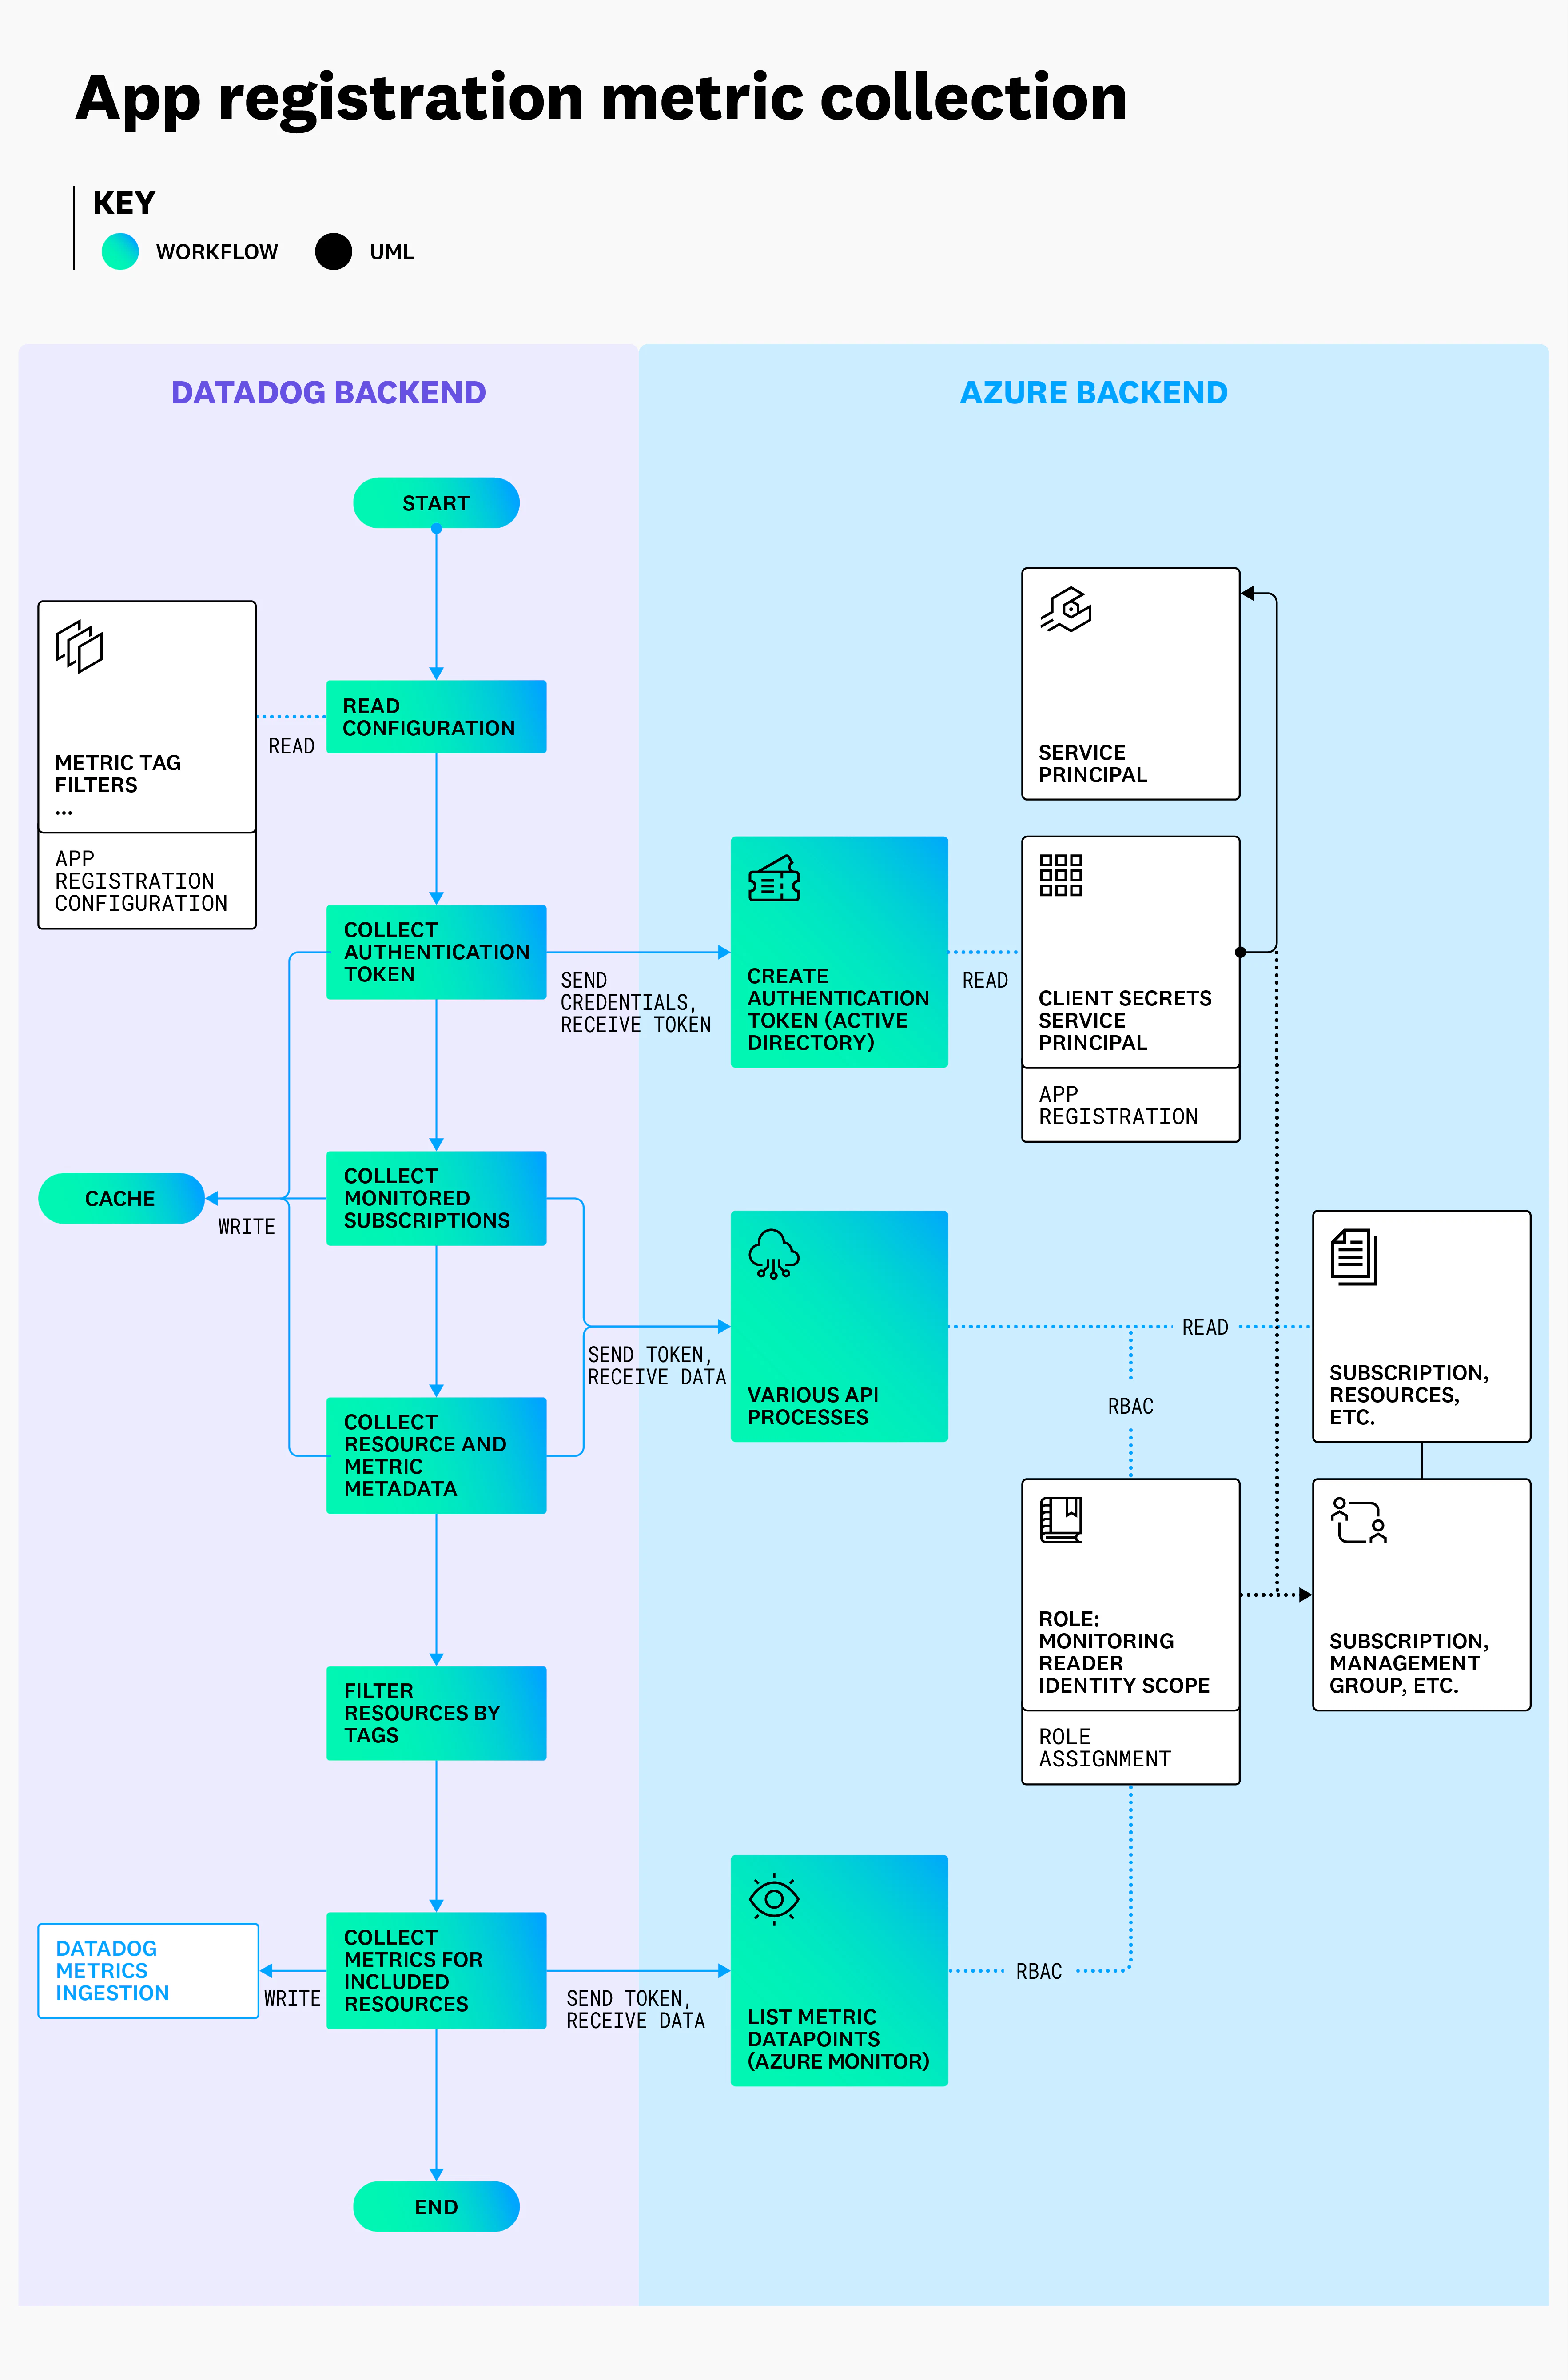
The diagram below outlines the process and resulting architecture of the Azure integration configuration described in Getting Started with Azure.
After this is completed, data collection begins automatically. The app registration allows Datadog to request a token from Azure Active Directory (AD). Datadog uses this token as the authorization for API calls to various Azure APIs, to discover resources within the scope provided, and collect data. This continuous process runs with two-minute intervals by default, and is used to discover and collect data from your Azure environment. The data collection process is pictured below.
Log collection
The diagram below provides a reference architecture for forwarding logs from Azure to Datadog, as described in the Event Hub log forwarding guide.
Alternate configuration options for log forwarding
The default architecture above is suitable for most users. Depending on the scale and composition of your Azure environment, as well as the methods your organization uses to implement this architecture, the sections below detail additional considerations that may be relevant.
Using the provided templates
The Deploy to Azure button in the main Azure Event Hub Logging guide provides a template for creating an Event Hub and forwarder function pair. In addition to using this template to deploy directly, you can use the underlying ARM templates as a starting point for your own infrastructure as code deployments.
These templates do not add diagnostic settings, apart from one optional diagnostic setting for activity logs. For resource logs, Datadog recommends utilizing ARM templates or Terraform to add diagnostic settings to your resources programmatically. These diagnostic settings must be added to every resource that needs to send resource logs to Datadog.
Region considerations
Diagnostic settings can only send resource logs to Event Hubs in the same region as the resource. Add an Event Hub and forwarder function pair in each region that contains resources for which you want to send resource logs to Datadog.
However, diagnostic settings are not limited to sending logs to Event Hubs in the same subscription as the resource. If you have multiple subscriptions within your Azure tenant, they can share a single Event Hub and forwarder function within the same region.
High-volume log considerations
As the volume of logs scales, you may see bottlenecks, typically arising in the Event Hubs. If you plan to submit high log volumes, you may want to consider adding additional partitions or using a Premium or Dedicated tier.
For especially high log volumes, you may consider adding additional Event Hub and forwarder function pairs within the same region, and splitting traffic between them.
Commands to install the Azure Datadog Extension
Install on Azure
Datadog provides an Azure extension to assist with Agent deployment on Azure instances:
An alternative to the GUI installation is the command line.
To run the Datadog Agent in your Azure instances as an extension, use the command that matches your environment. Replace <SITE_PARAMETER> with your Datadog account site parameter value in the Datadog sites page, and <DATADOG_API_KEY> with your Datadog API key.
Note: Python 3.9+ is required for installing Agent version 7+.
The Azure Extension can accept both normal settings and protected settings.
The normal settings include:
Variable
Type
Description
site
String
Set the Datadog intake site, for example: SITE=
agentVersion
String
The Agent version to install, following the format x.y.z or latest
agentConfiguration
URI
(optional) URI to the Azure blob containing the Agent configuration as a ZIP file.
agentConfigurationChecksum
String
The SHA256 checksum of the Agent configuration ZIP file, mandatory if agentConfiguration is specified.
The protected settings include:
Variable
Type
Description
api_key
String
Adds the Datadog API KEY to the configuration file.
Note: If agentConfiguration and api_key are specified at the same time, the API key found in the agentConfiguration takes precedence. Also note that if an API key is set on the target machine, it’s not possible to change it with Set-AzVMExtension.
Specify a configuration URI
This example shows how to specify a configuration for the Datadog Agent to use.
The Datadog Agent configuration URI must be an Azure blob storage URI.
The Datadog Windows Agent Azure Extension checks that the agentConfiguration URI comes from the .blob.core.windows.net domain.
The Datataog Agent configuration should be created from the %PROGRAMDATA%\Datadog folder (see the sample config_template.yaml file for all available configuration options).
To reuse the configuration of an existing Agent:
Remove any extra installation artifacts or files from the existing Agent’s %ProgramData%\Datadog folder so that it only contains the datadog.yaml file and conf.d folder with your integration configurations.
Save the sanitized %ProgramData%\Datadog folder as a ZIP file.
Generate a SHA256 checksum from the Agent configuration file
Reference the blob storage URL with the agentConfiguration parameter and the checksum with the agentConfigurationChecksum parameter to create the VM extension.
Note: After the Datadog Agent is installed, the configuration can only be changed when upgrading to a newer version.
Set a specific version of the Agent
This example shows how to specify a version of the Agent to install. By default the Datadog Windows Agent Azure Extension installs the latest version of the Datadog Agent.
Note: Downgrades are not supported, so it’s not possible to install a lower version of the Datadog Agent than the one currently installed on the target machine. To install a lower version of the Datadog Agent, uninstall the previous version first by removing the Datadog Windows Agent Azure Extension on the target machine. Removing the Datadog Windows Agent Azure Extension does not remove the Datadog Agent configuration.
The Azure Extension can accept both normal settings and protected settings.
The normal settings include:
Variable
Type
Description
site
String
Set the Datadog intake site, for example: SITE=
agentVersion
String
The Agent version to install, following the format x.y.z or latest
agentConfiguration
URI
(optional) URI to the Azure blob containing the Agent configuration as a zip file.
agentConfigurationChecksum
String
The SHA256 checksum of the Agent configuration ZIP file, mandatory if agentConfiguration is specified.
The protected settings include:
Variable
Type
Description
api_key
String
Adds the Datadog API KEY to the configuration file.
Note: If agentConfiguration and api_key are specified at the same time, the API key found in the agentConfiguration takes precedence. If an API key is set on the target machine, it’s not possible to change it with the api_key setting.
Specify a configuration URI
This example shows how to specify a configuration for the Datadog Agent to use.
The Datadog Agent configuration URI must be an Azure blob storage URI.
The Datadog Linux Agent Azure Extension checks that the agentConfiguration URI comes from the .blob.core.windows.net domain.
The Datataog Agent configuration should be created from the /etc/datadog-agent/ folder (see the sample config_template.yaml file for all available configuration options).
To reuse the configuration of an existing Agent by saving its /etc/datadog-agent folder as a ZIP file:
zip -r datadog_config.zip /etc/datadog-agent.
Generate a SHA256 checksum from the Agent configuration file
sha256sum <YOUR_FILENAME>.zip
Install the Agent with your custom configuration
Reference the blob storage URL with the agentConfiguration parameter and the checksum with the agentConfigurationChecksum parameter to create the VM extension.
az vm extension set --publisher "Datadog.Agent" --name "DatadogLinuxAgent" --version 7.0 --settings '{"site":"datadoghq.com", "agentVersion":"latest", "agentConfiguration":"https://<CONFIGURATION_BLOB>.blob.core.windows.net/<FILE_PATH>.zip", "agentConfigurationChecksum":"<SHA256_CHECKSUM>"}' --protected-settings '{"api_key":"<DATADOG_API_KEY>"}' --no-auto-upgrade-minor-version
Install on Azure Arc
To run the Datadog Agent in your Azure Arc instances as an extension, use the command that matches your environment.
More information on the syntax to set Azure connectedmachine extensions can be found in the az connectedmachine extension page.
Azure count metrics
Datadog generates an additional metric for each resource monitored with the Azure integration: azure.*.count. For example, Azure Virtual Machines monitored by Datadog reports azure.vm.count.
The azure.*.count metric is an improvement over azure.*.status, which is deprecated.
Count metric
The azure.*.count metric provides two fundamental pieces of information:
The number of resources of that type.
The status of each resource as reported by Azure.
The azure.*.count metric is created in the same namespace as the other metrics for that resource type, for example: azure.network_loadbalancers.count. It includes all of the same metadata tags as the other metrics in that namespace, plus as additional tag for status.
Use cases
Use the azure.*.count metric to:
Create a view of the number of Virtual Machines broken out by their status over time by graphing azure.vm.count over everything and summing by status.
Create query widgets in dashboards to display the number of a given resource type. Use any available tags to scope the count to a relevant aggregation such as region, resource group, kind, or status.
Create monitors to alert you about the status of different Azure resources.
Note: In some cases, the default visualization settings can make it appear as though resources are being double counted intermittently in charts or query widgets. This does not affect monitors or widgets scoped to a specific status.
You can reduce this effect by turning off interpolation in charts or query widgets by setting Interpolation > none or using .fill(null).
For most resource types, the possible statuses are:
Running
Unavailable
Unknown
Degraded
Failed
Virtual machines have more detailed statuses, including:
Running
Stopped_deallocated
Stopped
Unknown
Unavailable
Degraded
Failed
If you see a status of query_failed you need to enable the Resource Health provider in Azure.
In the left sidebar, select Azure Active Directory.
Under Basic information, find the Name value.
Unable to log in
If you experience an error logging in while trying to install the Azure integration, contact Datadog support. When possible, attach a screenshot.
Missing metrics
Ensure you completed the installation process, which includes giving read permissions to the Azure application for the subscriptions you want to monitor.
For ARM deployed virtual machines, you must also turn on Diagnostics and select the VM metrics you would like to collect. See Enable Diagnostics below for instructions.
For other missing metrics, contact Datadog support with the following information about the metric:
dimensions
resource group
resource name
subscription ID or subscription name
Attach a screenshot of a graph from Azure Monitor that shows a graph of the metric. Important: Graph 1-minute datapoints in the screenshot.
Enable diagnostics
Turning on Diagnostics allows ARM deployed VMs to collect logging information which includes metrics for CPU, Network, etc. Follow these instructions:
Click on Diagnostics settings under the Monitoring section.
Pick a storage account and click Enable guest-level monitoring.
By default, basic metrics and logs are enabled. Adjust based on your preferences.
Click Save to save any changes.
Discrepancy between your data in Azure and Datadog
Datadog’s Azure integration collects all metrics from Azure Monitor. Metrics are collected with all available dimensions (which are mapped to tags in Datadog), the highest time granularity, and the primary aggregation type.
The sections below describe two important distinctions to be aware of, as well as steps to reconcile the discrepancy.
1. Time aggregation
Datadog displays raw data from Azure in per-second values, regardless of the time frame selected in Azure. That can make Datadog’s value appear lower than the value Azure displays. See Time aggregation in the metric documentation for more information.
Confirm that the query in Azure is scoped identically to the query in Datadog:
Any dimensions used in the Azure metric query should match tags used in the Datadog metric query
The primary aggregation type used in the query should match the Datadog space aggregator
The time frame should match the time frame in the Datadog Metric Explorer
Hover over a datapoint on the graph to display the timestamp and value.
Find the same point in time in the Datadog graph and compare the values. If the values are equal, the original discrepancy was due to differences in either time or space aggregation between the two graphs.
Log collection troubleshooting
To troubleshoot log forwarding issues, begin with the general troubleshooting section. If those steps do not resolve your issue, look at the following setup-specific guidance.
Ensure that you used the correct search syntax and that your search contains the correct attributes or tags.
Diagnostic setting not present:
Ensure that a diagnostic setting has been added to the resources, Activity Logs, and Entra ID logs you want to send to Datadog.
Note: You can search for Entra ID logs with the query source:azure.activedirectory.
Automated log forwarding troubleshooting
Check for naming conflicts
If you have Azure resources with the same resource name as one of the default parameters, it can lead to naming conflicts. Azure does not allow resources to share resource names within an individual subscription. Datadog recommends renaming the default parameter with a unique name that does not already exist within your environment.
Note: If you are rerunning the template due to this failure, Datadog recommends also removing the entire resource group to create a fresh deployment.
Ensure the resource provider is registered
If your template deployment is failing due to the error The subscription is not registered to use namespace 'Microsoft.EventHub':
Azure has resource providers for each of its services, such as Microsoft.EventHub for Azure Event Hubs. If your Azure subscription is not registered to a required resource provider, the script fails.
Remediate this by registering with the appropriate resource provider. Run the example command below in CloudShell, substituting <RESOURCE_PROVIDER_NAME> with the name of the resource provider (for example, Microsoft.EventHub).
az provider register --namespace <RESOURCE_PROVIDER_NAME>
Check DD_SITE and DD_API_KEY values
If all logs are missing, verify your Datadog site and API key:
In the resource group where the automated log forwarding resources were deployed, go to Settings > Deployments.
Select the most recent deployment.
Click Redeploy to check and modify the values.
Verify logs are present in the storage account container
For missing Azure resource logs, find the ARM-deployed storage account in the resource’s region and check the container with the expected logs.
Inspect the containerAppConsole logs of the forwarder jobs
Container App Console logs help you diagnose application errors and exceptions. To inspect the logs, enable logging within the Container Apps environment in the same region as your resources that are missing logs.
For the azure.storage_storageaccounts_blobservices.transactions metric, you can use the following metric queries to view the number of successful or failed PUT operations, respectively:
azure.storage_storageaccounts_blobservices.transactions{responsetype:success , apiname:put*} by {apiname}
azure.storage_storageaccounts_blobservices.transactions{!responsetype:success , apiname:put*} by {responsetype}
Inspect function metrics
Check if the function app is encountering execution issues, data receipt or transmission issues, or error status codes by inspecting the following metrics:
Ensure that the function is receiving data:
azure.functions.bytes_received
Ensure that the function is sending data:
azure.functions.bytes_sent
Ensure that the function’s requests are receiving successful status codes:
azure.functions.http2xx
Ensure that the function’s requests are not receiving error status codes:
azure.functions.http4xx
azure.functions.http5xx
Diagnostic settings not automatically added to resources or Activity Logs
If a diagnostic setting has not been added automatically to your resources or Activity Logs, check if:
Check that any tag rules in the Datadog resource configuration match the tags set on your resource logs.
If there are no issues with the tag rules, contact Datadog Support and share the following information:
Tenant ID: Find the Tenant ID value nn Entra ID, under Basic information
Subscription ID: The subscription ID of any subscriptions that logs are missing from
Datadog Resource ID: Find the Datadog Resource ID by going to Settings > Properties on the Datadog resource blade. The Resource ID uses this format: /subscriptions/<SUBSCRIPTION_ID>/resourceGroups/myresourcegroup/providers/Microsoft.Datadog/monitors/<DATADOG_RESOURCE_NAME
Resource ID: The resource ID of any resources that logs are missing from, such as web apps or databases
Note: When using the Datadog resource in Azure to send logs, Entra ID diagnostic settings must be set manually.
Event Hub log forwarding troubleshooting
Check if the resource provider is unregistered
If your template deployment is failing due to the error The subscription is not registered to use namespace 'Microsoft.EventHub':
Azure has resource providers for each of its services, such as Microsoft.EventHub for Azure Event Hubs. If your Azure subscription is not registered to a required resource provider, the script fails.
Remediate this by registering with the appropriate resource provider. Run the example command below in CloudShell, substituting <RESOURCE_PROVIDER_NAME> with the name of the resource provider (for example, Microsoft.EventHub).
az provider register --namespace <RESOURCE_PROVIDER_NAME>
Scale up your Event Hub partitions to handle higher throughput (maximum 32). Because in-place scaling is only available for Premium or Dedicated tiers, you must create a new Event Hub with the desired partition count and then reconfigure its diagnostic settings and forwarder trigger. Consult Azure support for scaling advice.
Split the log forwarder into multiple pipelines in Datadog, with each one processing a specific subset of resources based on rules such as priority. This increases the number of logs that can be handled simultaneously.
Inspect function metrics
Ensure the function app is executing by looking at the following function metrics:
Check the function execution count:
azure.functions.function_execution_count
Check that the function is receiving data:
azure.functions.bytes_received
Check that the function is receiving data:
azure.functions.bytes_sent
Check that the function’s requests are returning successful status codes:
azure.functions.http2xx
Check that the function’s requests are not returning error status codes:
azure.functions.http4xx
azure.functions.http5xx
Notes:
The log forwarder uses the Azure Functions V4 Programming model, which is package-based and disables direct code editing in the Azure portal. To update or customize a function that was previously set up manually, contact Datadog support for instructions.
For more reliable, efficient, and cost-effective log collection, transition to the Automated Log Forwarder. It fully automates the process of forwarding logs from all your Azure resources to Datadog.
Monitoring multiple app registrations
Subscriptions monitored by multiple app registrations can introduce overlapping access configurations. This setup is not recommended and may result in integration issues or system conflicts, and may also increase your Azure Monitor costs.
Powered-down Azure VMs on the infrastructure list
When you power down your VMs in Azure, the Datadog Azure integration still collects the metric azure.vm.status for that VM. This metric is tagged with status:running, status:not_running, or status:unknown.
This is intended, but causes the VM to remain on your infrastructure list. If your VM reports only this metric, it does not count towards your billable host-count. For more billing information, see the Datadog billing page.
If you destroy your Azure VM, it phases out of your infrastructure list within 3 hours.
Azure VMs appear in the app without metrics
After properly installing the Azure Integration within Datadog, metrics from you Azure VMs and other services should begin to flow in about 15 minutes.
If after this time you see Azure VMs in your infrastructure list but no metrics are being reported, a few things can be happening.
Make sure you are looking for the right metrics.
Classic virtual machine metrics begin with the azure.vm namespace and ARM deployed virtual machine metrics begin with the azure.compute_virtualmachines namespace.
If neither of these namespaces are returning metrics, make sure Diagnostics is turned on for the Virtual Machines within the Azure Portal. Only Boot diagnostics and Basic metrics are required.
For Classic VMs:
For ARM deployed VMs:
Make sure the Virtual machine is running.
The integration does not collect performance metrics for stopped or deallocated machines. Use the azure.vm.count metric and the status tag values of running, stopped, and stopped_deallocated to determine the status of your hosts. Make sure the host in question has status:running, and is running in the Azure portal.
Issues with azure.*.count metrics
If your Azure integration is reporting metrics but not azure.*.count, or azure.*.count is returning status:query_failed, your Azure subscription needs to register the Azure Resource Health provider.
Using the Azure Command Line Interface:
azure login # Login to the Azure user associated with your Datadog accountazure config mode arm
azure provider register Microsoft.ResourceHealth
The azure.*.count metric should show in Datadog within 5 - 10 minutes.
Further reading
Additional helpful documentation, links, and articles: