- Agents
- Essentials
- Getting Started
- Agent
- API
- APM Tracing
- Containers
- Dashboards
- Database Monitoring
- Datadog
- Datadog Site
- DevSecOps
- Incident Management
- Integrations
- Internal Developer Portal
- Logs
- Monitors
- Notebooks
- OpenTelemetry
- Profiler
- Search
- Session Replay
- Security
- Serverless for AWS Lambda
- Software Delivery
- Synthetic Monitoring and Testing
- Tags
- Workflow Automation
- Learning Center
- Support
- Glossary
- Standard Attributes
- Guides
- Agent
- Integrations
- Extend Datadog
- Authorization
- DogStatsD
- Custom Checks
- Integrations
- Build an Integration with Datadog
- Create an Agent-based Integration
- Create an API-based Integration
- Create a Log Pipeline
- Integration Assets Reference
- Build a Marketplace Offering
- Create an Integration Dashboard
- Create a Monitor Template
- Create a Cloud SIEM Detection Rule
- Install Agent Integration Developer Tool
- Service Checks
- Community
- Guides
- OpenTelemetry
- Administrator's Guide
- API
- Partners
- Datadog Mobile App
- DDSQL Reference
- CoScreen
- CoTerm
- Remote Configuration
- Cloudcraft (Standalone)
- In The App
- Dashboards
- Notebooks
- DDSQL Editor
- Reference Tables
- Sheets
- Monitors and Alerting
- Service Level Objectives
- Metrics
- Watchdog
- Bits AI
- Internal Developer Portal
- Error Tracking
- Change Tracking
- Event Management
- Incident Response
- Actions & Remediations
- Infrastructure
- Cloudcraft
- Resource Catalog
- Universal Service Monitoring
- End User Device Monitoring
- Hosts
- Containers
- Processes
- Serverless
- Network Monitoring
- Storage Management
- Cloud Cost
- Application Performance
- APM
- Continuous Profiler
- Database Monitoring
- Agent Integration Overhead
- Setup Architectures
- Setting Up Postgres
- Setting Up MySQL
- Setting Up SQL Server
- Setting Up Oracle
- Setting Up Amazon DocumentDB
- Setting Up MongoDB
- Setting Up ClickHouse
- Connecting DBM and Traces
- Data Collected
- Exploring Database Hosts
- Exploring Query Metrics
- Exploring Query Samples
- Exploring Database Schemas
- Exploring Recommendations
- Troubleshooting
- Guides
- Data Streams Monitoring
- Data Observability
- Digital Experience
- Real User Monitoring
- Synthetic Testing and Monitoring
- Continuous Testing
- Experiments
- Product Analytics
- Session Replay
- Software Delivery
- CI Visibility
- CD Visibility
- Deployment Gates
- Test Optimization
- Code Coverage
- PR Gates
- DORA Metrics
- Feature Flags
- Developer Integrations
- Security
- Security Overview
- Cloud SIEM
- Code Security
- Cloud Security
- App and API Protection
- AI Guard
- Workload Protection
- Sensitive Data Scanner
- AI Observability
- Log Management
- Observability Pipelines
- Configuration
- Sources
- Processors
- Destinations
- Amazon OpenSearch
- Amazon S3
- Amazon Security Lake
- Azure Storage
- CrowdStrike NG-SIEM
- Datadog Archives
- Datadog CloudPrem
- Datadog Logs
- Datadog Metrics
- Elasticsearch
- Google Cloud Storage
- Google Pub/Sub
- Google SecOps
- HTTP Client
- Kafka
- Microsoft Sentinel
- New Relic
- OpenSearch
- SentinelOne
- Socket
- Splunk HEC
- Sumo Logic Hosted Collector
- Syslog
- Packs
- Akamai CDN
- Amazon CloudFront
- Amazon VPC Flow Logs
- AWS Application Load Balancer Logs
- AWS CloudTrail
- AWS Elastic Load Balancer Logs
- AWS Network Load Balancer Logs
- Cisco ASA
- Cloudflare
- F5
- Fastly
- Fortinet Firewall
- HAProxy Ingress
- Istio Proxy
- Juniper SRX Firewall Traffic Logs
- Netskope
- NGINX
- Okta
- Palo Alto Firewall
- Windows XML
- ZScaler ZIA DNS
- Zscaler ZIA Firewall
- Zscaler ZIA Tunnel
- Zscaler ZIA Web Logs
- Search Syntax
- Scaling and Performance
- Monitoring and Troubleshooting
- Guides and Resources
- Log Management
- CloudPrem
- Administration
AWS CloudWatch Metric Streams with Amazon Data Firehose
Using Amazon CloudWatch Metric Streams and Amazon Data Firehose, you can get CloudWatch metrics into Datadog with only a two to three minute latency. This is significantly faster than Datadog’s default API polling approach, which provides updated metrics every 10 minutes. You can learn more about the API polling approach in the Cloud Metric Delay documentation.
Overview
- Create a CloudWatch Metric Stream in each AWS account and region for which you want to stream metrics.
- Optionally specify a limited set of namespaces or metrics to stream.
- Once you create the Metric Stream, Datadog immediately starts receiving the streamed metrics and displays them on the Datadog site with no additional configuration needed.
Tag filtering configured in the AWS Integration tile also applies to CloudWatch Metric Streams.
Metric Streaming versus API polling
The following are key differences between using CloudWatch Metric Streams and API polling.
Metrics that report with more than a two hour delay: API polling continues to collect metrics like
aws.s3.bucket_size_bytesandaws.billing.estimated_chargesafter metric streaming is enabled, since these cannot be sent through CloudWatch Metric Stream.Metrics Metadata: Datadog continues to use API polling to collect custom tags and other metadata for your streamed metrics. To ensure that you continue to receive these metrics, do not change the configuration on the AWS integration.
Switching from API polling to metric streams
If you already receive metrics for a given CloudWatch namespace through the API polling method, Datadog automatically detects this and stops polling metrics for that namespace once you start streaming them. Leave your configuration settings in the AWS integration page unchanged; as Datadog continues to use API polling to collect custom tags and other metadata for your streamed metrics.
Switching back from metric streams to API polling
If you later decide you don’t want to stream metrics for a given AWS account and region, or even just for a specific namespace, Datadog automatically starts collecting those metrics using API polling again based on the configuration settings in the AWS integration page. If you want to stop streaming all metrics for an AWS account and region, follow the instructions in the Disable Metric Streaming section of this document.
Billing
There is no additional charge from Datadog to stream metrics.
AWS charges based on the number of metric updates on the CloudWatch Metric Stream and the data volume sent to the Amazon Data Firehose. As such, there is a potential to see an increased CloudWatch cost for the subset of metrics you are streaming. For this reason, Datadog recommends using metric streams for the AWS metrics, services, regions, and accounts where you most need the lower latency, and polling for others. For more information, see Amazon CloudWatch pricing.
EC2 or Lambda metrics in the stream could increase the number of billable hosts and Lambda invocations (if those hosts and functions aren’t already monitored with the AWS integration or Datadog Agent in the case of EC2).
Note: You can create filters in CloudWatch to stream only specified metrics. See the Amazon CloudWatch user guide for more information.
Setup
Before you begin
Read the Metric Streaming versus API polling section carefully to understand the differences before enabling Metric Streaming.
If you haven’t already, connect your AWS account to Datadog. For more information, see the CloudFormation setup instructions.
Installation
Datadog recommends using CloudFormation because it’s automatic and easier if you are using multiple AWS regions.
Note: Metric streaming to Datadog currently only supports OpenTelemetry v0.7 output format.
On your Datadog site, go to the Configuration tab of the AWS integration page.
Click on the AWS account to set up metric streaming.
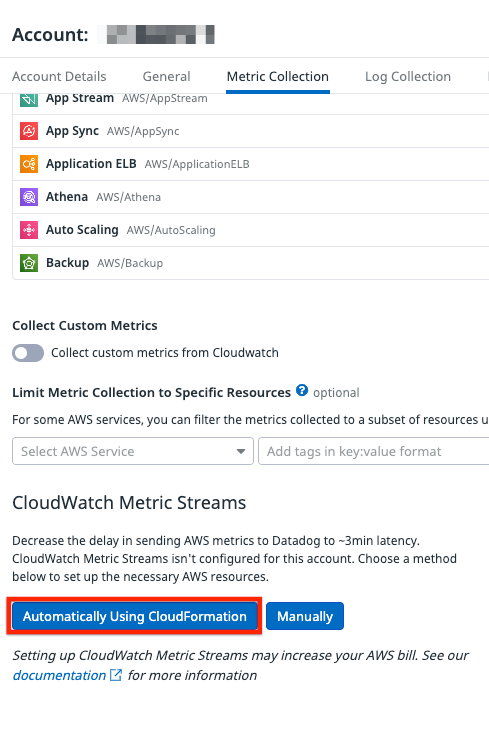
Under Metric Collection, click on Automatically Using CloudFormation under CloudWatch Metric Streams to launch a stack in the AWS console.
Fill in the required parameters:
- ApiKey: Add your Datadog API key.
- DdSite: Select your Datadog site. Your site is:
- Regions: A comma-separated list of the regions you wish to set up for metrics streaming. For a full list of supported regions, see the AWS documentation on Using metric streams.
Fill in the optional parameters:
- FilterMethod: Include or Exclude list of namespaces to include for metrics streaming.
- First/Second/Third Namespace: Specify the namespaces you wish to include or exclude. Note: The namespace values have to precisely match the values in the namespace column in AWS’s documentation. For example, AWS/EC2.
Check the acknowledgment box that states, “I acknowledge that AWS CloudFormation might create IAM resources with custom names.”
Click Create Stack.
Results
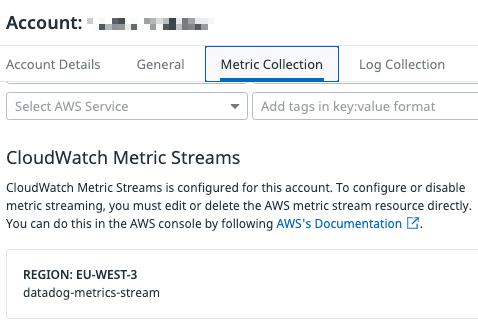
Once the stack is successfully created, wait five minutes for Datadog to recognize the change. To validate completion, go to the Metric Collection tab in Datadog’s AWS integration page and verify that the activated regions appear for the selected account.
To set up metric streams using the AWS Console, create a CloudWatch Metric Stream for each AWS region.
Note: Metric streaming to Datadog currently only supports OpenTelemetry v0.7 output format.
Choose the Quick AWS Partner Setup and select Datadog as the AWS Partner destination from the dropdown menu.
Choose the Datadog site to which you want to stream metrics and enter your Datadog API key.
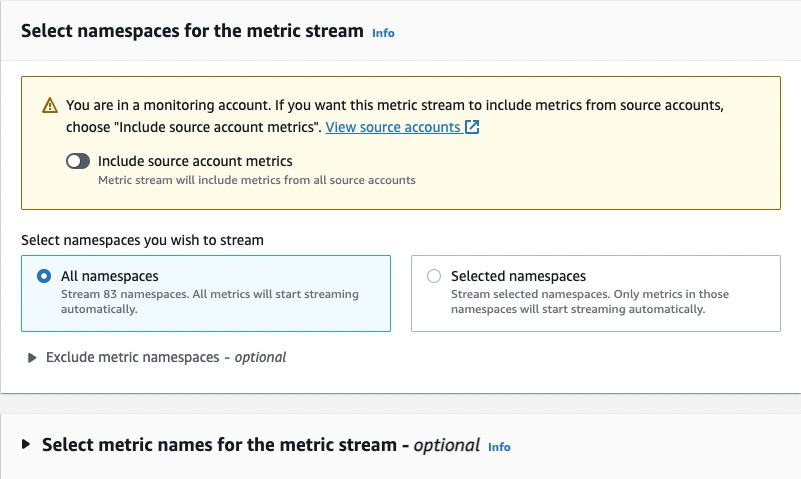
Choose whether you want to stream all CloudWatch metrics, or only specific namespaces. You also have the option to exclude specific metrics. If you are in a Monitoring Account, you can also choose to enable Cross-account streaming.
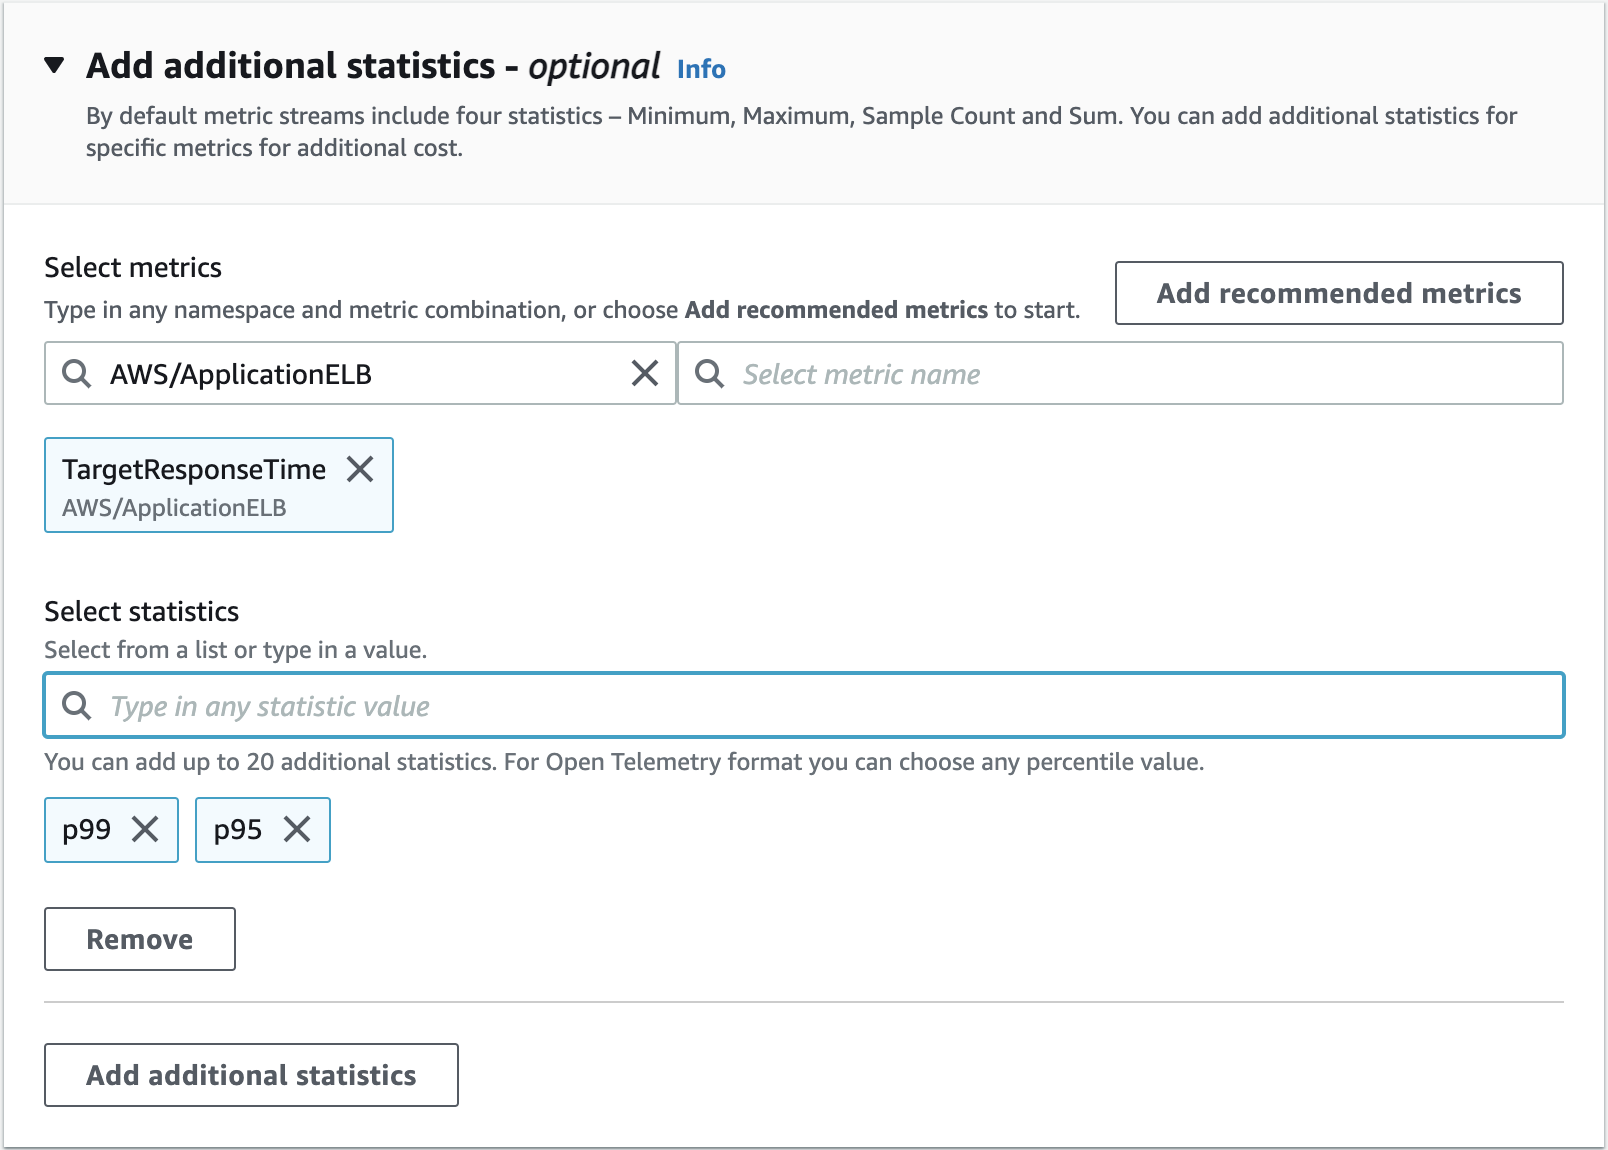
Under Add additional statistics, include the AWS percentile metrics to send to Datadog. See the CloudFormation template for a list of the percentile metrics Datadog supports through polling.
Assign a name to your metric stream.
Click Create metric stream.
Results
After you see the Metric Stream resource has been successfully created, wait five minutes for Datadog to recognize the change. To validate completion, go to the Metric Collection tab in Datadog’s AWS integration page and verify that the activated regions are enabled under CloudWatch Metric Streams for the specified AWS account.
Note: If you’ve already enabled polling CloudWatch APIs, the transition to streaming could cause a brief (up to five minutes) period where the specific metrics you are streaming are double-counted in Datadog. This is because of the difference in timing between when Datadog’s crawlers are running and submitting your CloudWatch metrics, and when Datadog recognizes that you have started streaming those metrics and turn off the crawlers.
Cross-account metric streaming
Use cross-account metric streaming to include metrics in a single Metric Stream that spans across multiple AWS accounts within an AWS region. This helps to reduce the number of streams needed to collect metrics for a common destination. To do this, connect your source accounts with your monitoring account and enable Cross-account streaming to Datadog in your AWS monitoring account.
Your monitoring account needs to have the following permissions in order for this feature to work properly:
- oam:ListSinks
- oam:ListAttachedLinks
Note: To collect custom tags and other metadata for your streamed metrics, integrate your source accounts with Datadog.
Disable metric streaming
To disable metric streaming completely for a given AWS account and region, you must delete the AWS Metric Stream and its related resources. To prevent loss of metrics in Datadog, it’s important to follow these deletion steps carefully:
If you set streaming up with CloudFormation:
- Delete the stack that was created during the setup.
If you set streaming up through the AWS Console:
- Delete the CloudWatch Metric Stream linked to your delivery stream.
- Delete all resources that were created while setting up the stream, including the S3 and Firehose IAM roles that are associated with the stream.
Once the resources are deleted, wait for five minutes for Datadog to recognize the change. To validate completion, go to the Metric Collection tab in Datadog’s AWS integration page and verify that the disabled regions are not displayed under CloudWatch Metric Streams for the specified AWS account.
Troubleshooting
To resolve any issues encountered while setting up Metric Streams or the associated resources, see AWS Troubleshooting.
Further Reading
Additional helpful documentation, links, and articles:


