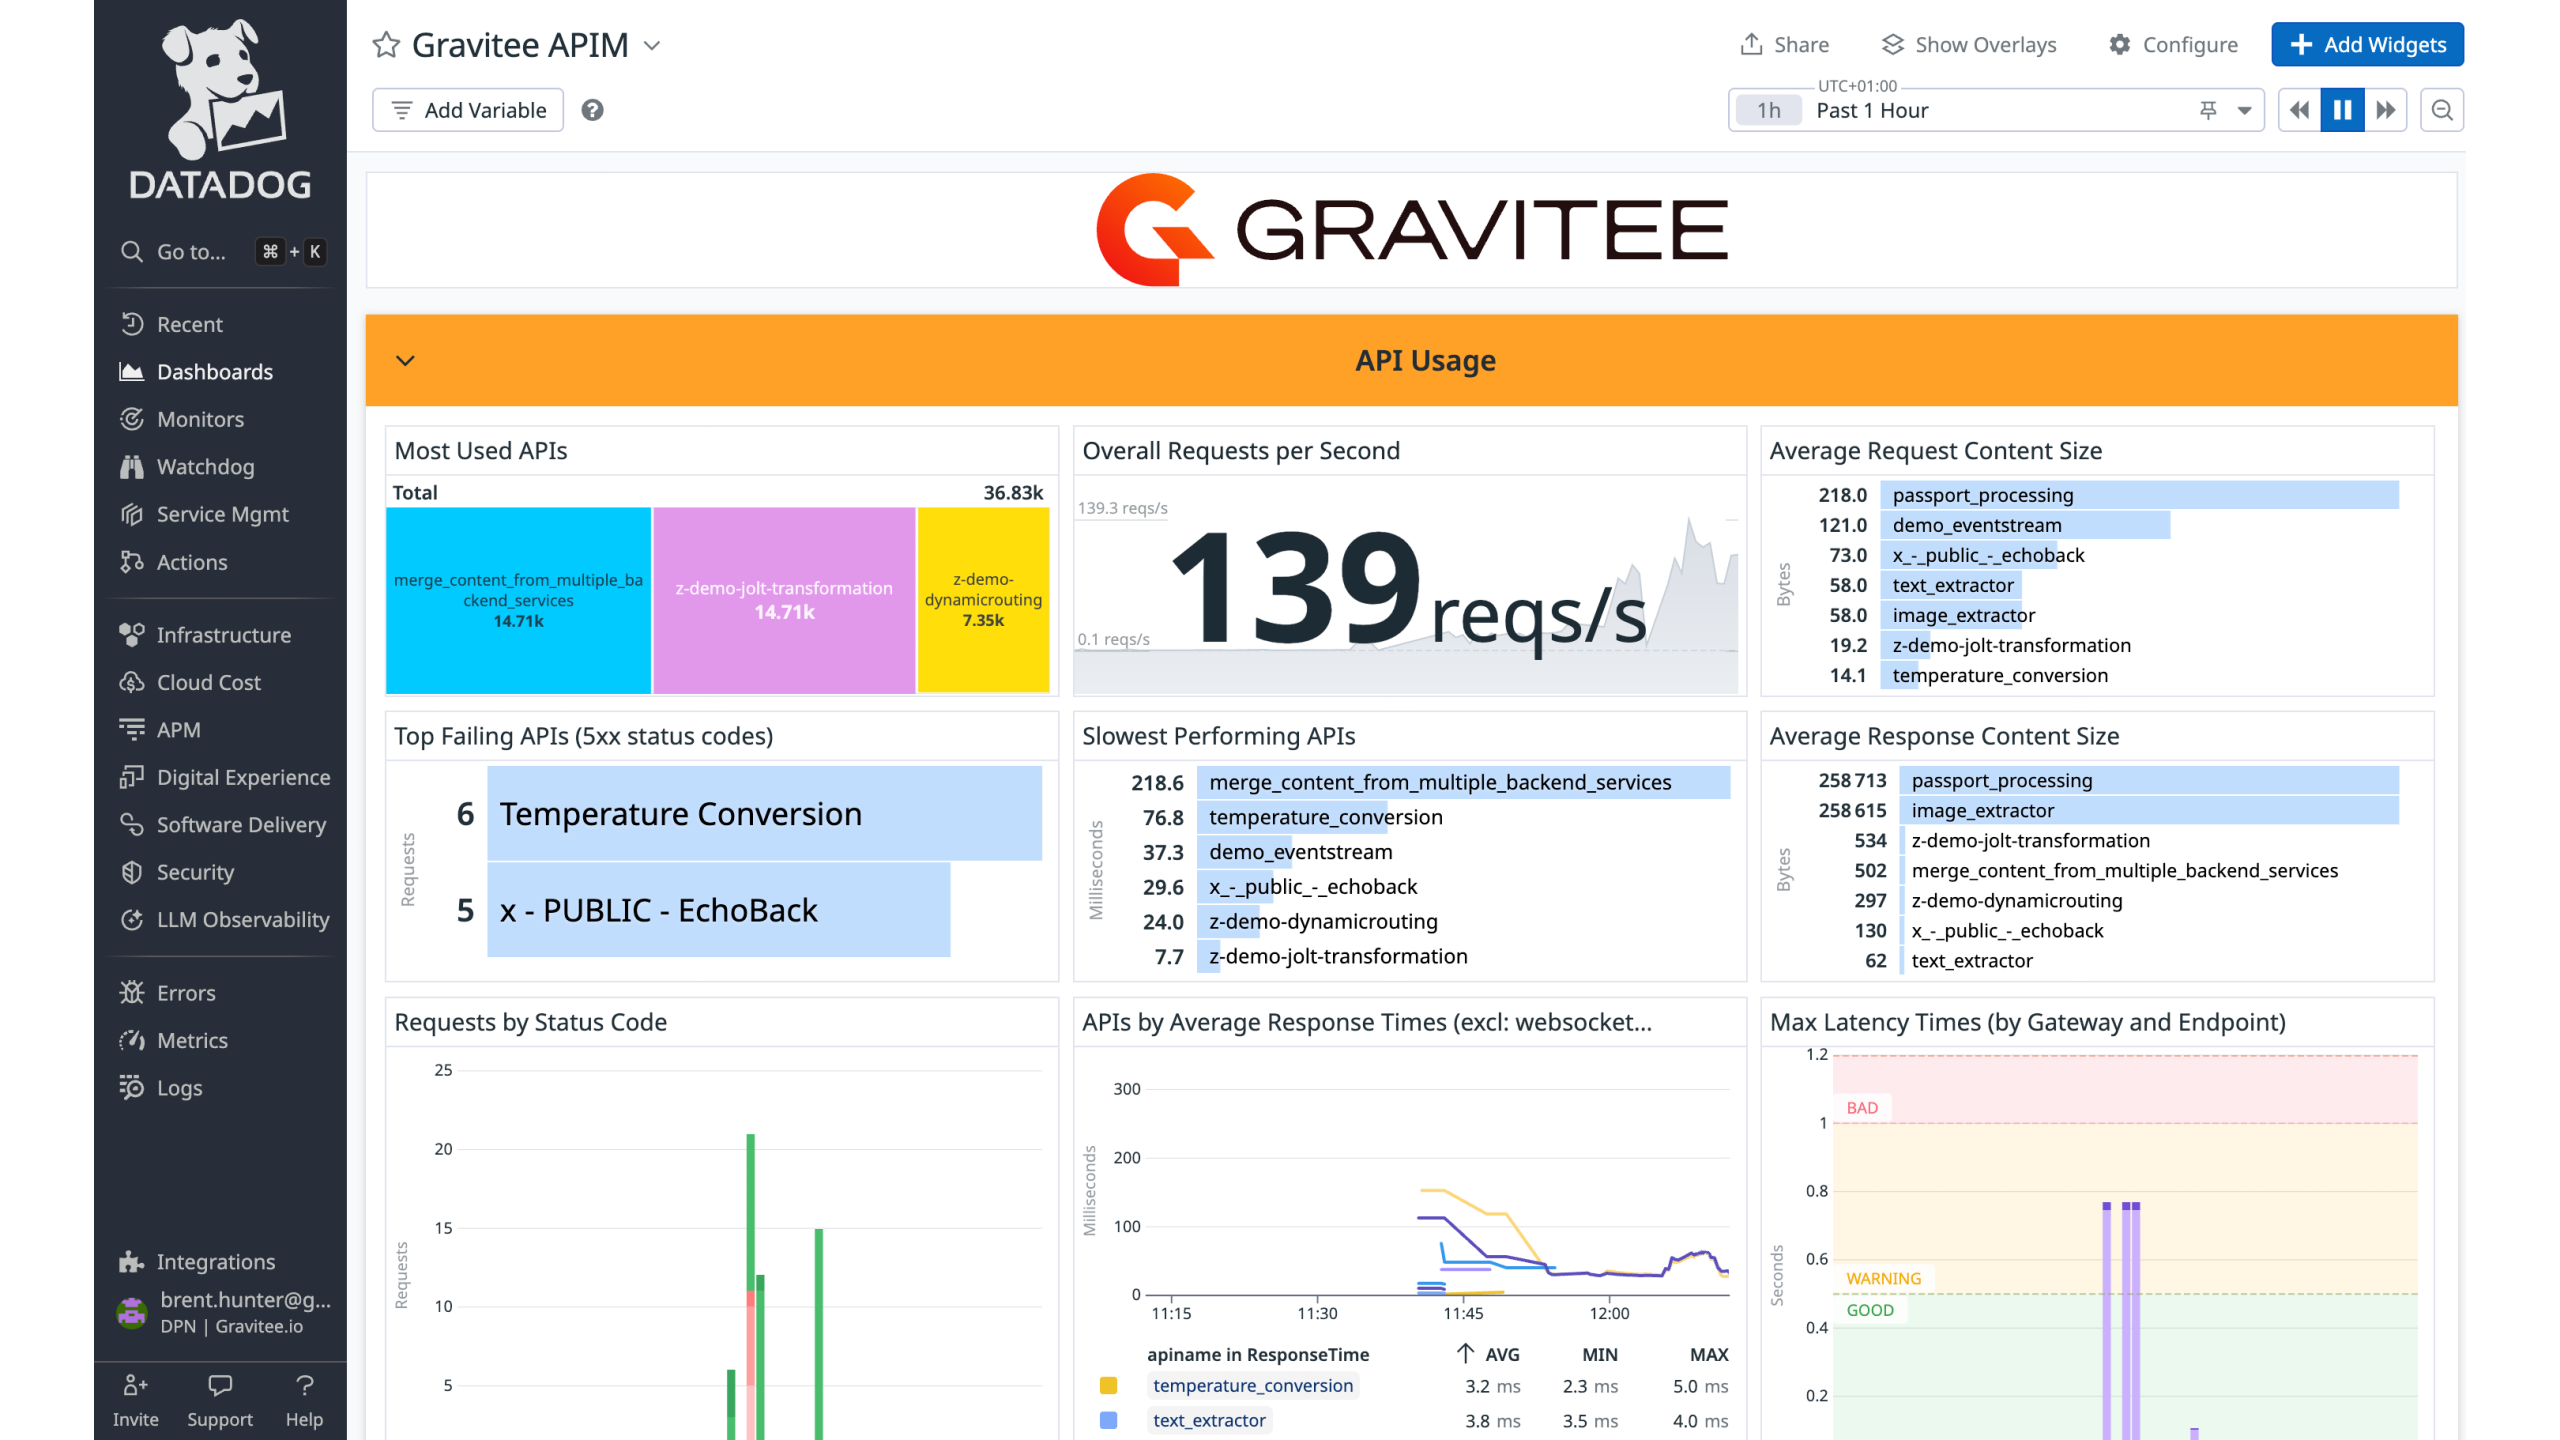
See all metrics of Gravitee API usage in the integration dashboard.
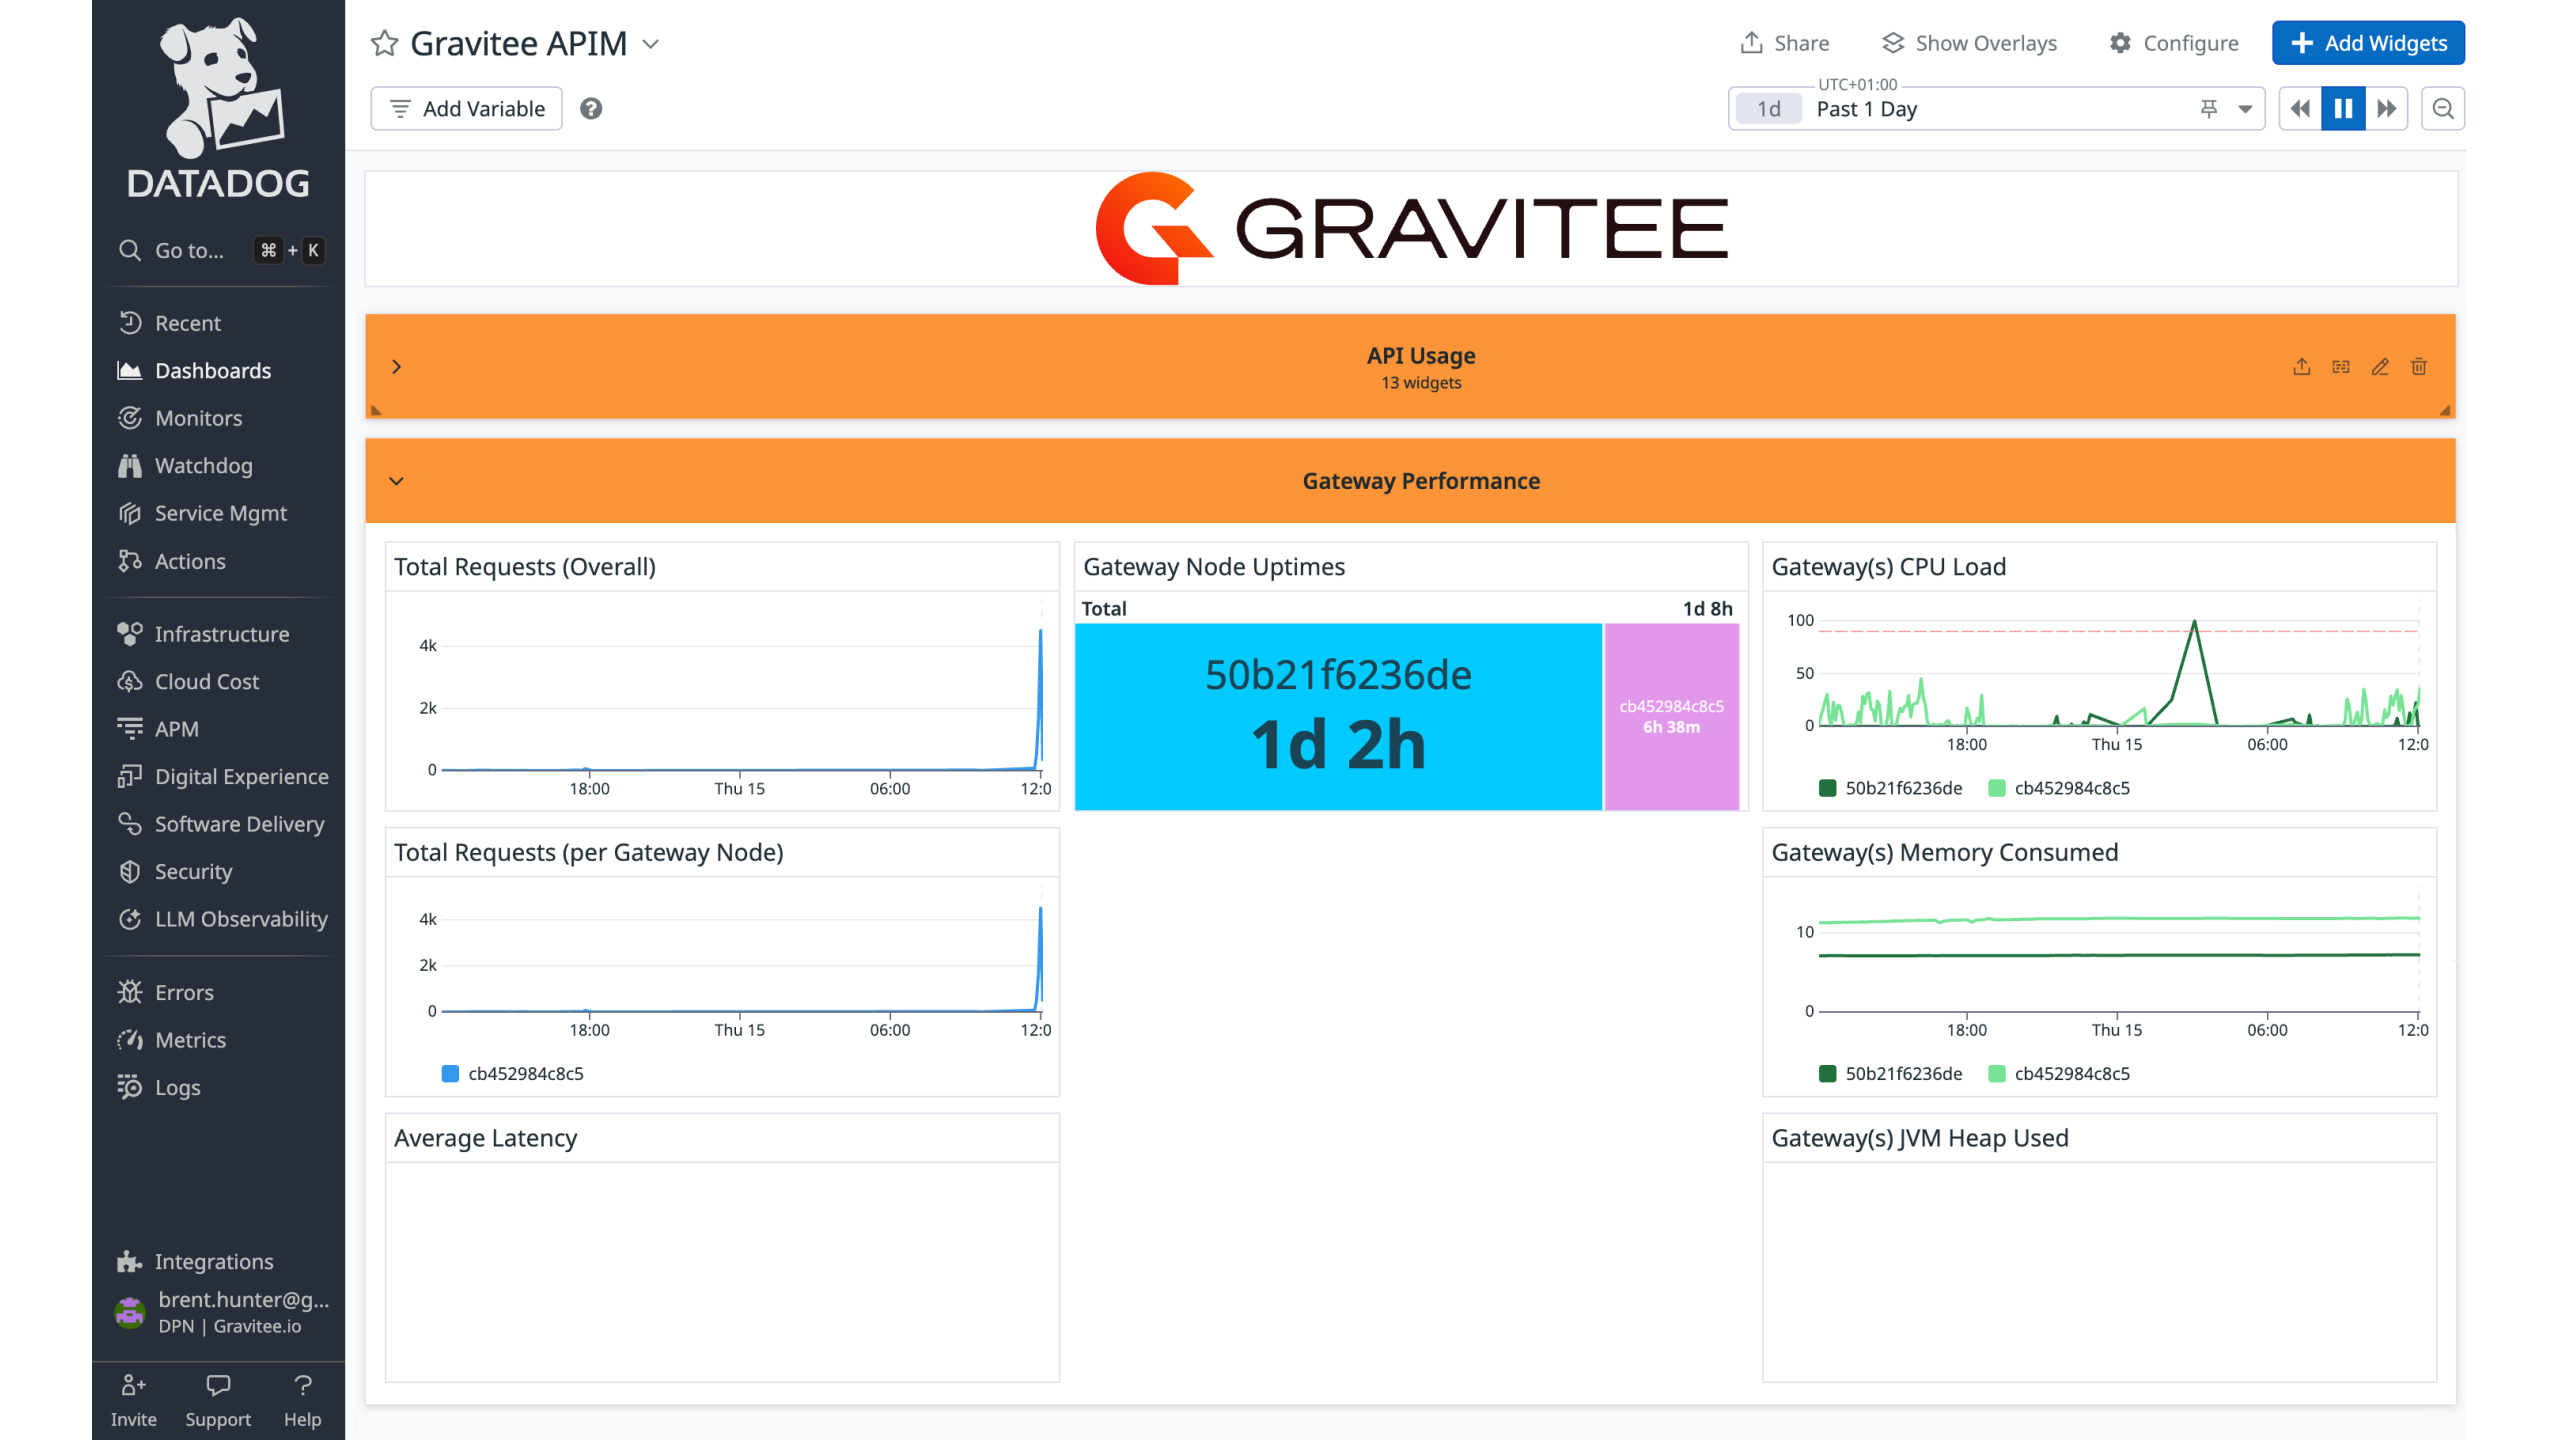
See all Gravitee Gateway metrics & usage in the integration dashboard.
Overview
Gravitee APIM is an enterprise-class agentic AI, API, and event stream management platform. It enables you to manage event streams and agentic AI as securely and easily as traditional APIs, bringing all your APIs together in a unified, full lifecycle management solution.
This integration allows you to monitor API and event stream performance, connection details, and API Gateway metrics, providing insights into the health and behavior of your Gravitee infrastructure. You can track top APIs, request and response times, content sizes, latency, slow performing APIs, gateway performance metrics, logs, and more.
This integration includes a pre-built Datadog dashboard to support comprehensive monitoring and observability of Gravitee APIM.
Setup
Download and install
- Download the Datadog Reporter plugin here.
- Add the downloaded ZIP file to your Gateway(s)
{GRAVITEE_HOME}/plugins folder. - Or, if you are installing the Gravitee Gateway via Helm, add the following entry in the
additionalPlugins section (changing the version as needed):
gateway:
additionalPlugins:
  - https://download.gravitee.io/graviteeio-ee/apim/plugins/reporters/gravitee-reporter-datadog/gravitee-reporter-datadog-5.0.0.zip
- Create a Datadog API Key. You will need this when configuring the Reporter in Gravitee.
Note: As with other reporter plugins, the Datadog Reporter plugin only needs to be installed on the Gateway container, not the Management API container.
Note: If you want to collect system metrics and logs from the Management API service, use the Datadog Agent to tail the Management API logs, or collect them from stdout.
Configuration
- To configure the Datadog Reporter plugin on the Gateway, enable the
reporters section in your Gravitee values.yaml file. See the example below:
reporters:
  datadog:
    enabled: true
    site: "datadoghq.eu"
    authentication:
      #apiKeyPrefix: ""
      apiKey: "YOUR_API_KEY"
      #appKey: "YOUR_APP_KEY"
      #tokenScheme: ""
      #token: "YOUR_TOKEN"
      #username: "YOUR_USERNAME"
      #password: "YOUR_PASSWORD"
Note: You can obscure the value of this API key by using configuration-level secrets in your Gravitee values.yaml file.
Data Type Mapping
Gravitee has different types of reporting data, and each type maps to a different resource type in Datadog. The mapping is as follows:
| Gravitee Convention | Examples | Datadog Convention |
|---|
| Metadata | API name, user agent | Tags |
| Monitoring | CPU, memory usage | Metrics |
| EndpointStatus | Health check status | Events |
| Metrics | Response time, content length | Metrics |
| Logs | Request body, response body | Log |
Data Collected
Metrics
| |
|---|
gravitee.apim.api_request_count
(count) | API V2/V4 Number of requests |
gravitee.apim.api_response_time_ms
(gauge) | API V2 Response time spent to call the backend upstream
Shown as millisecond |
gravitee.apim.count
(count) | Node JVM Threads count |
gravitee.apim.endpoint_response_time_ms
(gauge) | API V4 Response time spent to call the backend upstream
Shown as millisecond |
gravitee.apim.gateway_latency_ms
(gauge) | API V4 Latency of the gateway to apply policies
Shown as millisecond |
gravitee.apim.gateway_response_time_ms
(gauge) | API V4 Global response time to process and respond to the consumer
Shown as millisecond |
gravitee.apim.heap_committed_in_bytes
(gauge) | Node JVM Heap committed in bytes
Shown as byte |
gravitee.apim.heap_max_in_bytes
(gauge) | Node JVM Max Heap in bytes
Shown as byte |
gravitee.apim.heap_used_in_bytes
(gauge) | Node JVM Heap used in bytes
Shown as byte |
gravitee.apim.heap_used_percent
(gauge) | Node JVM Head used in percent
Shown as percent |
gravitee.apim.jvm_timestamp
(gauge) | Node JVM timestamp |
gravitee.apim.load_average_15m
(gauge) | Node CPU load average 15m
Shown as percent |
gravitee.apim.load_average_1m
(gauge) | Node CPU load average 1m
Shown as percent |
gravitee.apim.load_average_5m
(gauge) | Node CPU load average 5m
Shown as percent |
gravitee.apim.max_file_descriptors
(gauge) | Node Maximum number of file descriptors allowed on the system |
gravitee.apim.mem_free_in_bytes
(gauge) | Node Free Memory in bytes
Shown as byte |
gravitee.apim.mem_free_percent
(gauge) | Node Free memory percent
Shown as percent |
gravitee.apim.mem_total_in_bytes
(gauge) | Node Total memory in bytes
Shown as byte |
gravitee.apim.mem_used_in_bytes
(gauge) | Node Used Memory in bytes
Shown as byte |
gravitee.apim.mem_used_percent
(gauge) | Node Used memory precent
Shown as percent |
gravitee.apim.non_heap_committed_in_bytes
(gauge) | Node JVM Non-heap committed in bytes
Shown as byte |
gravitee.apim.non_heap_used_in_bytes
(gauge) | Node JVM Non-Heap used in bytes
Shown as byte |
gravitee.apim.open_file_descriptors
(gauge) | Node Number of opened file descriptors associated with the current process |
gravitee.apim.peak_count
(count) | Node JVM Threads peak count |
gravitee.apim.percent
(gauge) | Node CPU percent usage
Shown as percent |
gravitee.apim.process_percent
(gauge) | Node Process CPU load
Shown as percent |
gravitee.apim.process_timestamp
(gauge) | Node Process timestamp |
gravitee.apim.proxy_latency_ms
(gauge) | API V2 Latency of the gateway to apply policies
Shown as millisecond |
gravitee.apim.proxy_response_time_ms
(gauge) | API V2 Global response time to process and respond to the consumer
Shown as millisecond |
gravitee.apim.request_content_length
(gauge) | API V2/V4 Size of the request payload
Shown as byte |
gravitee.apim.response_content_length
(gauge) | API V2/V4 Size of the response payload
Shown as byte |
gravitee.apim.uptime_in_millis
(gauge) | Node JVM uptime
Shown as millisecond |
Uninstallation
In Gravitee
- To delete the Reporter, delete the
gravitee-reporter-datadog-5.0.0.zip from your Gateway {GRAVITEE_HOME}/plugins folder. - To disable the Reporter, change the
reporters.datadog.enabled attribute to false (in your Gravitee values.yaml file).
In Datadog
- Click Uninstall on the integration tile to remove the dashboard.
Support
Need help? Contact Gravitee support.
Have feedback about the integration? Email Gravitee at contact@graviteesource.com.
Further Reading
Additional helpful documentation, links, and articles: