Checkpoint Harmony Endpoint
Checkpoint Harmony Endpoint Overview (Light)
Checkpoint Harmony Endpoint Overview (Dark)
Overview
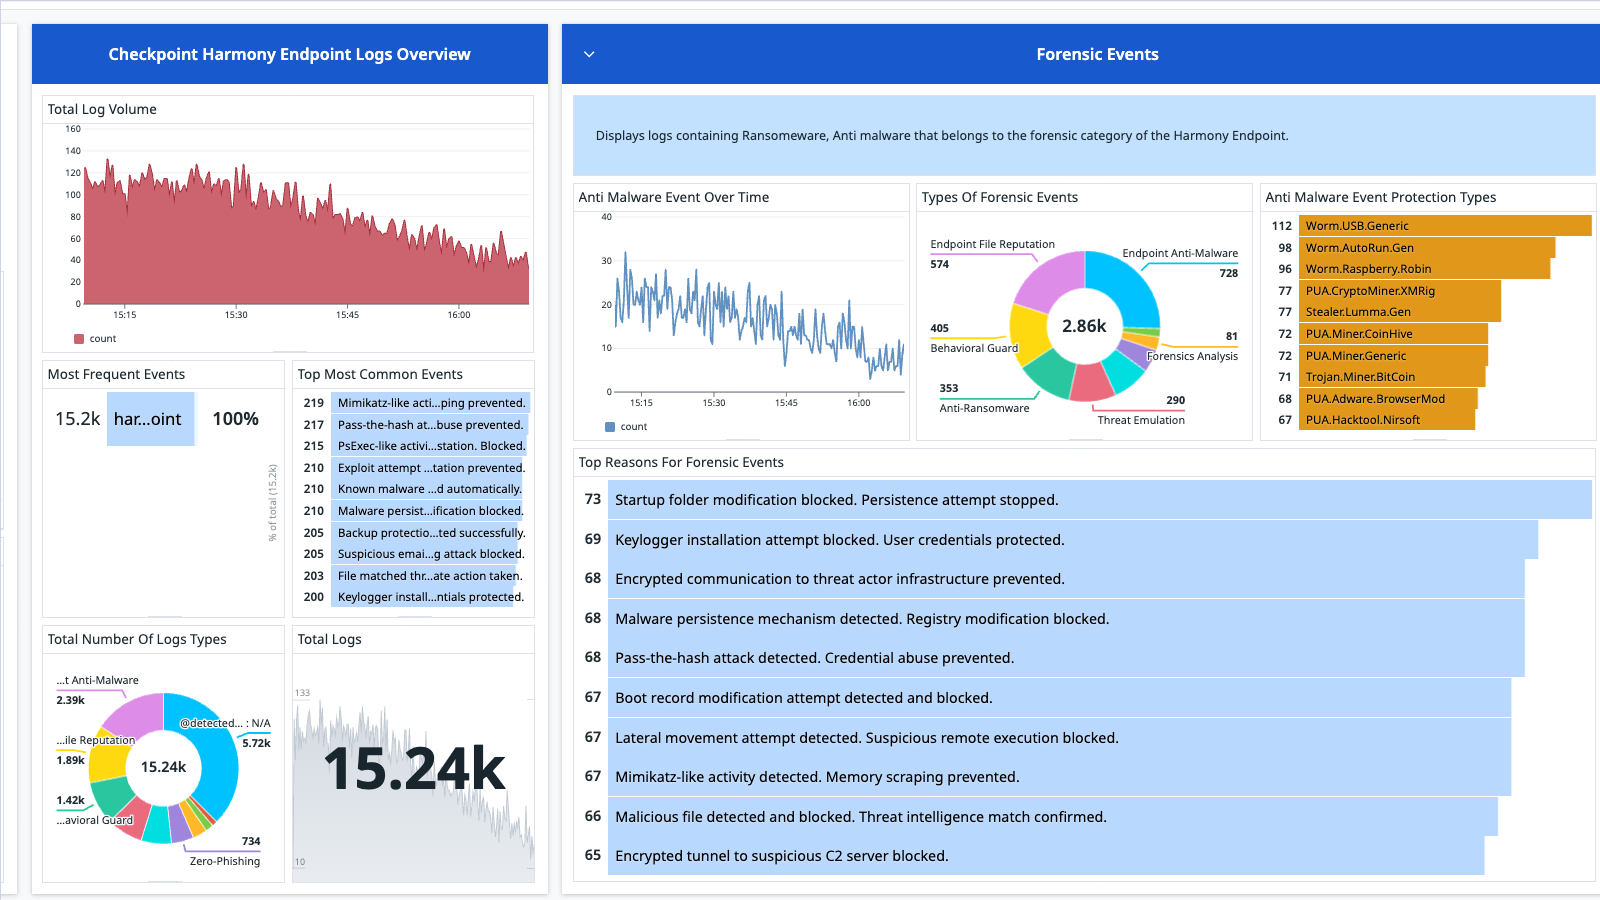
Checkpoint Harmony Endpoint is a next-generation endpoint security solution designed to prevent, detect, and respond to threats on user devices, such as desktops, laptops, and servers. This integration monitors Checkpoint Harmony Endpoint.
Setup
Collecting logs is disabled by default in the Datadog Agent. Enable it in the datadog.yaml file with:
Add this configuration block to your checkpoint_harmony_endpoint.d/conf.yaml file to start collecting your checkpoint_harmony_endpoint logs:
  logs:
    - type: file
      path:  /var/log/checkpoint.log
      source: checkpoint_harmony_endpoint
      service: <SERVICE_NAME>
Change the path and service parameter values for your environment.
Restart the Agent.
Installation
The checkpoint harmony endpoint check is included in the Datadog Agent package.
Prerequisites
- Administrative access to Checkpoint Harmony Endpoint - Gaia installed on your server.
- The Datadog Agent installed and running (on a server or container that can receive syslog messages).
- Network Access between the endpoint and the Datadog Agent, over port 514, unless you’re using a custom port value. Enable log exporter in the Smart Console for log streaming.
- Syslog support enabled in the Datadog Agent (with a TCP or UDP listener configured).
Validation
Confirm the Datadog Agent is listening on the correct port (514 in the following examples)
sudo netstat -tunlp | grep 514
If using TCP and UDP listeners, use the following command:
Confirm logs are reaching the Agent from the correct log source.
tail -f /var/log/datadog/syslog.log
Note: If the file doesn’t exist, verify that syslog logs are being written by your configuration.
Use the tcpdump command to confirm network traffic. On the Datadog Agent host:
sudo tcpdump -i any port 514
After running this command, you should see traffic from the Checkpoint endpoint client’s IP address. If you don’t see any such traffic, check the firewall rules between Checkpoint Endpoint and the Datadog Agent. Confirm the correct protocol (UDP or TCP) is being used on both sides.
Check the Datadog Live Tail in Datadog for logs from the source and service you defined in the conf.yaml file.
Create a test log on the harmony client by triggering an event.
Check for tags or facets to use for better filtering based on the required data.
Metrics
The Checkpoint Harmony Endpoint integration does not include any metrics.
Log collection
Data Collected
To help monitor endpoint data collected by Datadog, the Checkpoint Harmony Endpoint logs contain key information of the endpoint client, such as:
- event timestamp
- detected_by
- client IPs and ports
- the protocol used
- firewall actions (allow/deny)
- matched rule name
- user identity (if available)
- log type (for example, forensic or malware)
- action used
- device name
- status of the operation
Events
The checkpoint harmony endpoint integration includes log events such as attacks and malware hits.
Troubleshooting
Need help? Contact Datadog support.