Barracuda SecureEdge Overview Light Mode
Barracuda SecureEdge Overview Bottom Light Mode
Overview
Barracuda SecureEdge is a unified Secure Access Service Edge (SASE) platform that includes Next-Generation Firewall (NGFW), zero trust, and secure Software-Defined Wide Area Network (SD-WAN) capabilities. This integration collects and analyzes logs from your Barracuda SecureEdge deployment to monitor security events, network traffic, and system activity.
Setup
Installation
The Barracuda SecureEdge check is included in the Datadog Agent package.
Prerequisites
A syslog server that can receive logs from the Barracuda SecureEdge instance.
Configure syslog streaming through the Barracuda SecureEdge Manager. Follow the configuration instructions. When configuring syslog streaming, you can select different log sources. When enabled, each log source will generate one or more log files in your syslog server under /var/phion/logs by default. If your syslog server stores the logs in a different directory, note down this directory as it will be necessary during the configuration step. By default, the Barracuda SecureEdge integration supports the following log files:
box_Auth_access.log
box_Event_eventS.log
box_Event_operative.log
box_Config_admin.log
box_Config_changes.log
box_Config_sync.log
box_Control_admin.log
box_Control_AuthService.log
box_Firewall.log
box_Firewall_Activity.log
box_Network_dhcp.log
box_Network_activation.log
box_System_mgmaccess.log
box_SSH_sshd.log
box_SSH_config.log
srv_CSC_VPN.log
srv_CSC_VPN_sslvpn.log
If you want to extend the log files ingested by the integration, see the Add Extra Log Sources section for instructions on how to add them.
Ensure there is an instance of the Datadog Agent running on your syslog server/container and that it has access to the logs directory.
Configuration
Collecting logs is disabled by default in the Datadog Agent. Enable it in the datadog.yaml file with:
```yaml
  logs_enabled: true
```
Running On A Host
If your syslog server is deployed on a host (not containerized), rename the conf.d/secure_edge.d/conf.yaml.example found in the root of your Agent’s configuration directory to conf.yaml. See the example configuration for the contents of this file. Replace the <SERVICE> value in each log source with the service that best suits your environment.
The path to the log files is the default path where Barracuda SecureEdge streams logs to. If your syslog server stores the logs in a different directory, update those values in the conf.yaml file.
Once the file has been renamed and updated, restart the Agent.
Running In A Container
If your syslog server is deployed in a container, see the Autodiscovery Integration Templates for guidance on applying these instructions. It is important that each of the log sources has the same tags attached as shown in the example configuration file.
If you want to collect logs from any log file that is not supported by the integration, follow these instructions to add them to the log files tracked by the integration.
Add a new file log source to the conf.yaml file, pod annotations, or container labels:
  - type: file
    path: /var/phion/logs/<new-log-file>.log
    service: <SERVICE>
    source: barracuda_secure_edge
    tags:
      - log_component:<NEW_TAG>
It is important to keep the source as barracuda_secure_edge and to assign a new tag to this log source.
Restart the Agent.
You can also add a new log pipeline to your Datadog account with the filter query source:barracuda_secure_edge log_component:<NEW_TAG> if you want to further parse the contents of this log.
Validation
After configuration, you can see your logs in the Datadog Live Tail. Filter for logs received where source is barracuda_secure_edge.
Data Collected
Metrics
The Barracuda SecureEdge integration does not include any metrics.
Logs
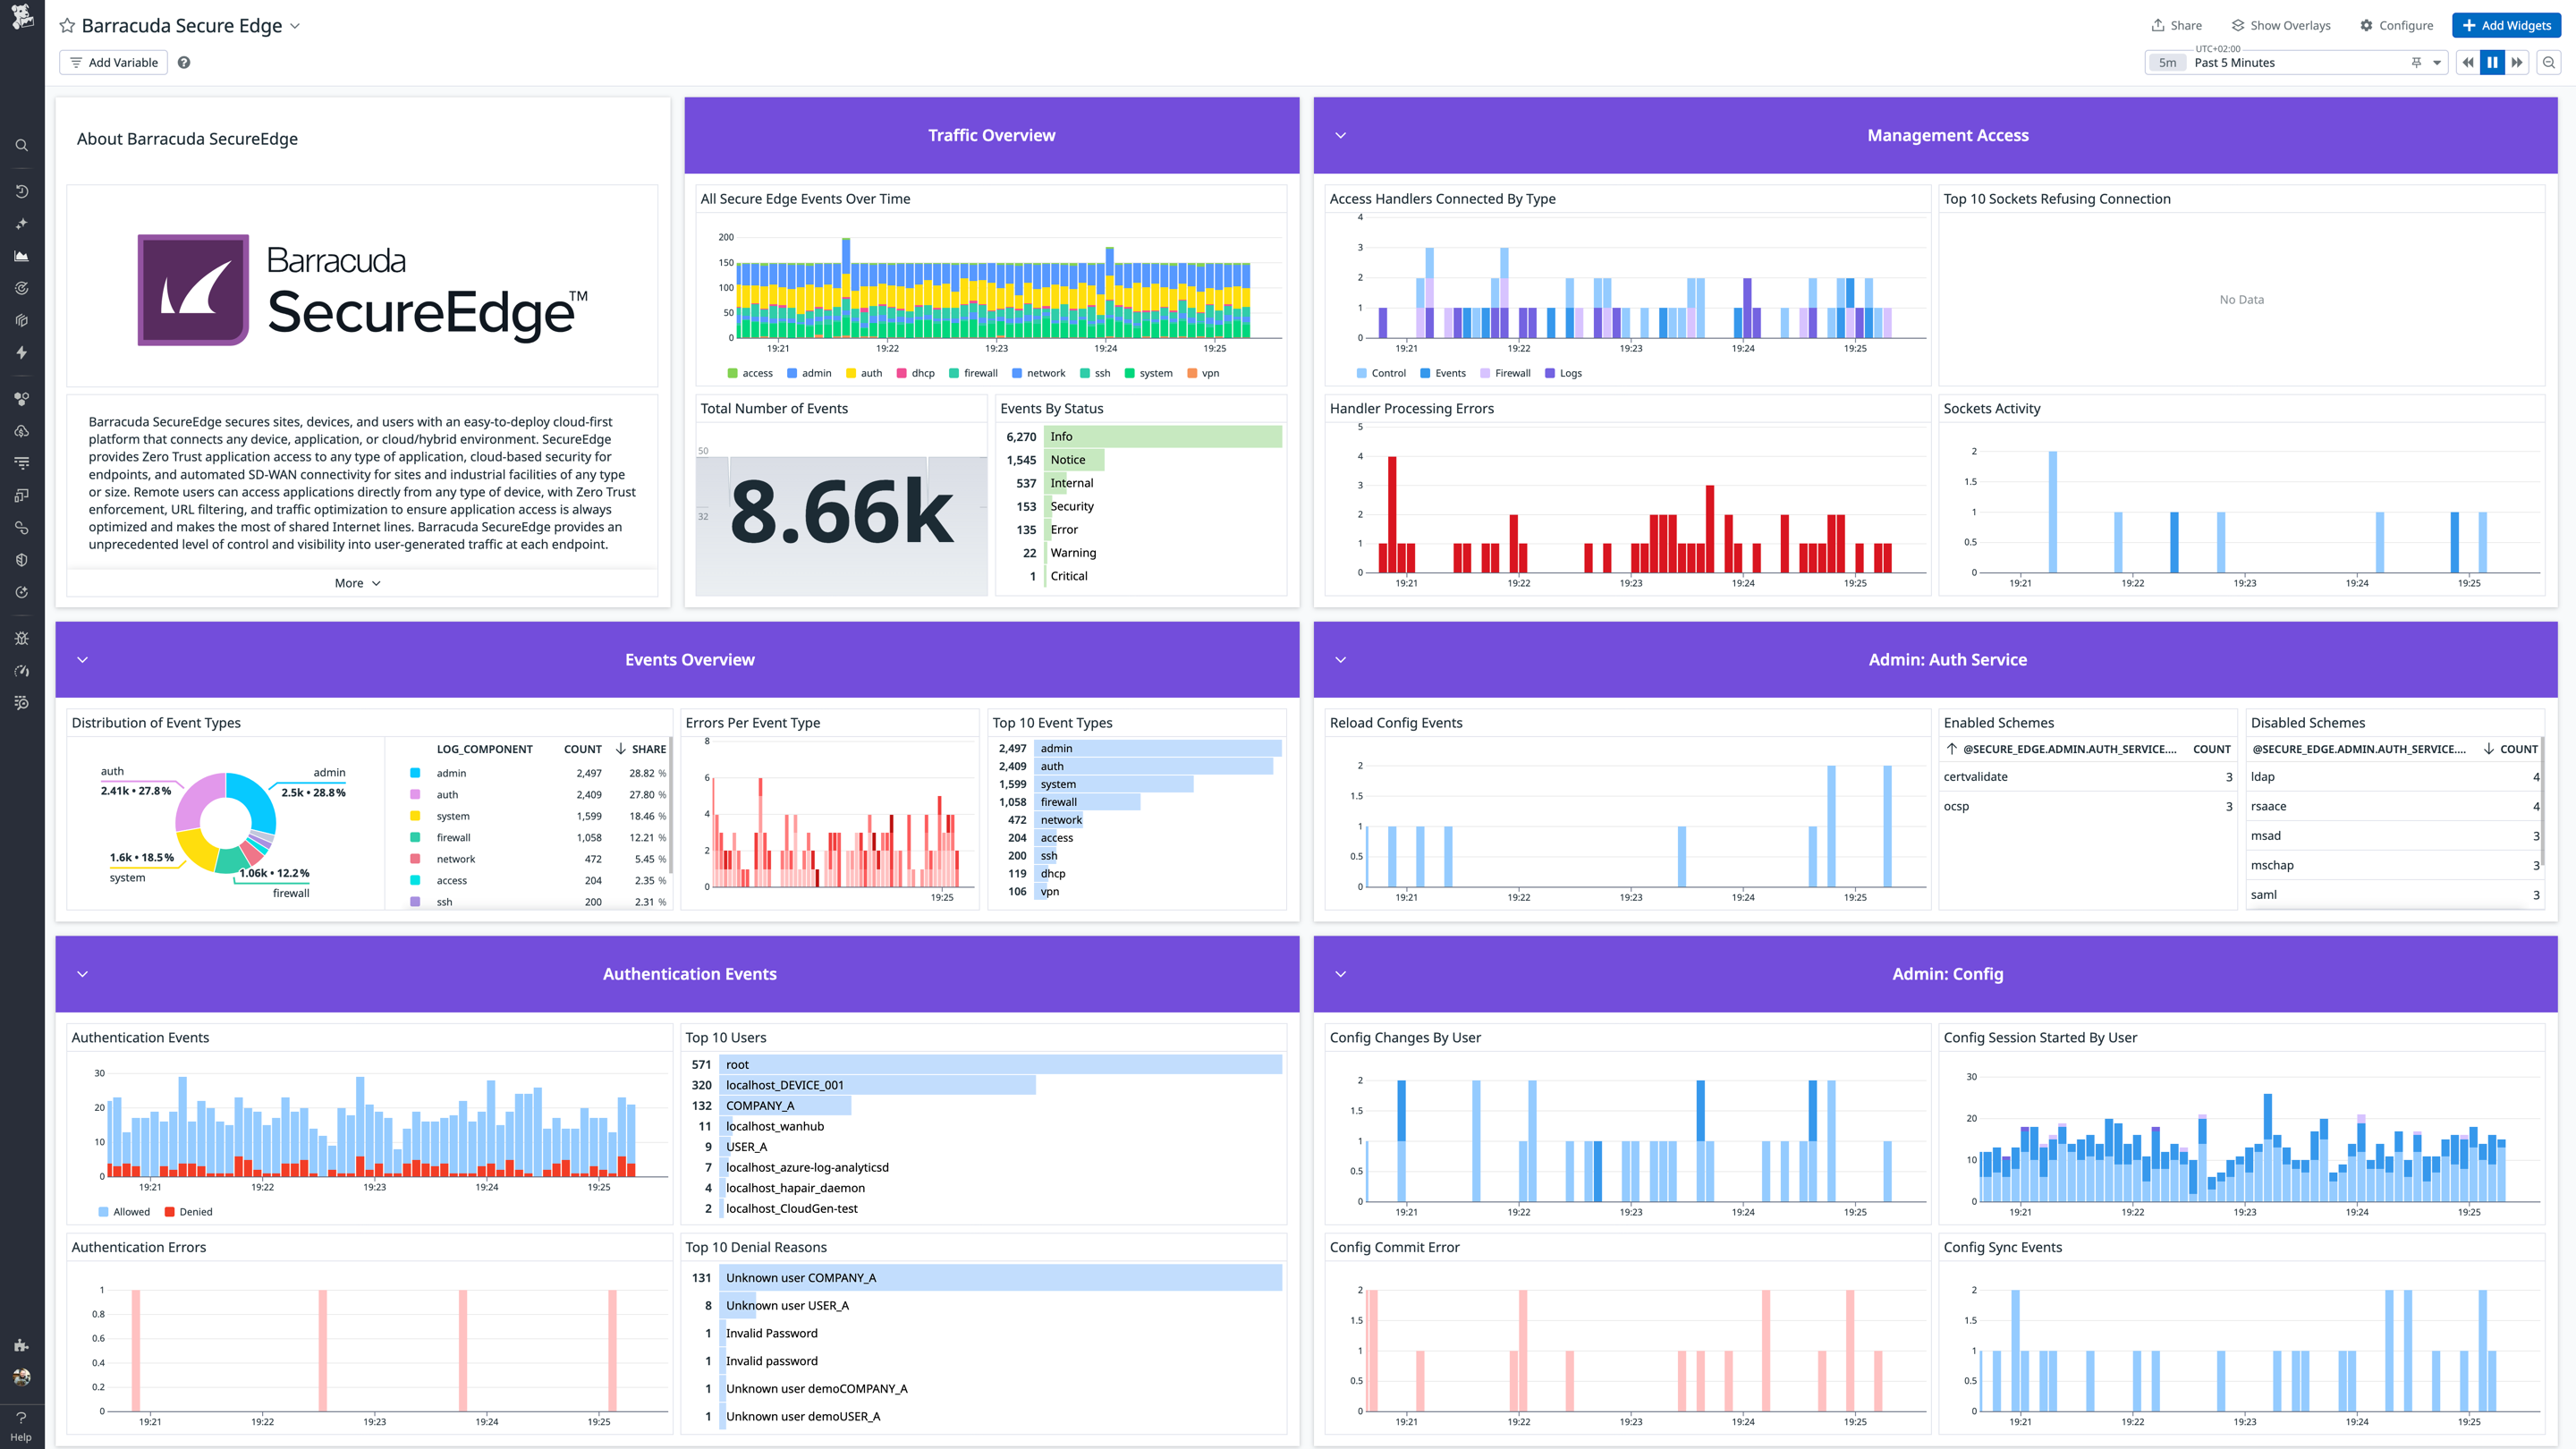
The Barracuda SecureEdge integration collects logs containing the following types of information:
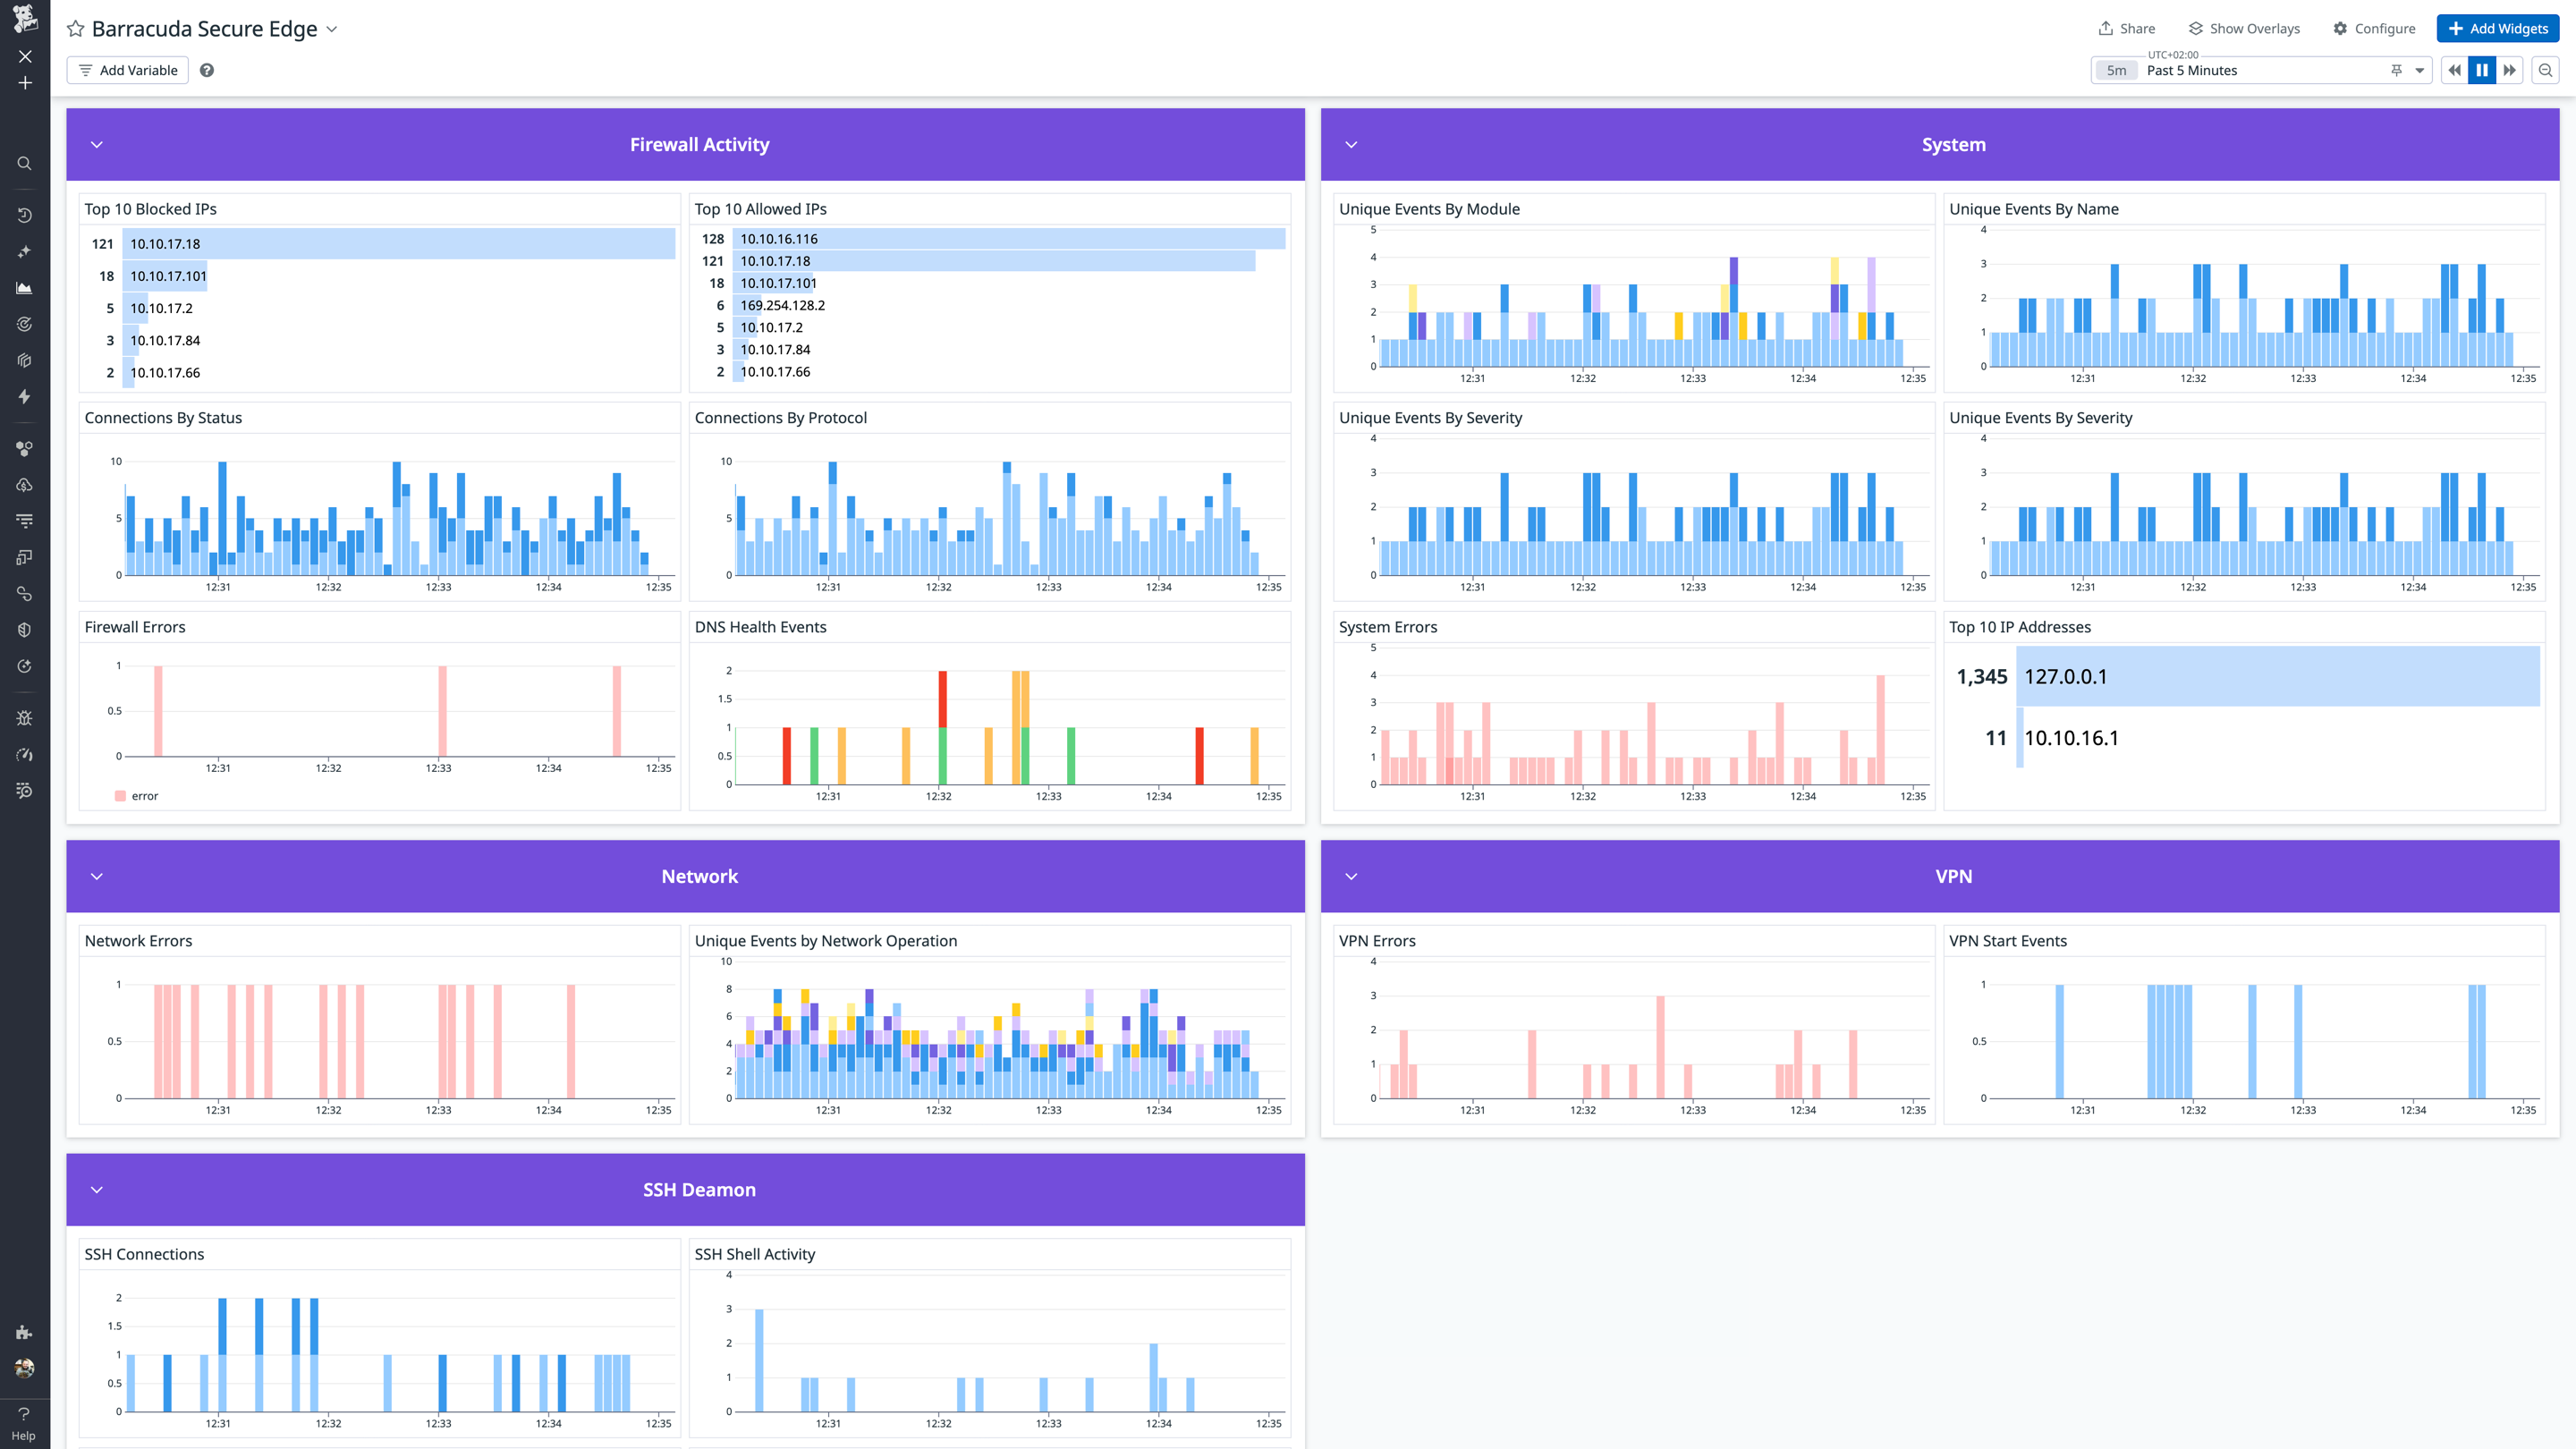
- Security Events: Security-related events including event database operations, alarms, and security policy processing.
- Network Traffic and Firewall Activity: Detailed firewall rule processing with allow/deny/block decisions, connection tracking, protocol information, source/destination IPs and ports, and NAT translations.
- Authentication and Access: User login attempts and sessions (successful and failed), authentication service operations (LDAP, RADIUS, certificate validation), SSH access attempts, management access connections, and session lifecycle tracking.
- VPN Activity: VPN service operations including SSL-VPN, L2TP, and PPTP connection events, configuration, and status.
- Configuration Management: Configuration commits, changes, and synchronization operations performed by administrators and automated processes.
- System and Network Services: Device operational events, SSH daemon operations, DHCP service activity, network subsystem activation and initialization, firewall service startup/shutdown, and system health indicators.
Events
The Barracuda SecureEdge integration does not include any events.
Troubleshooting
Need help? Contact Datadog support.