Overview
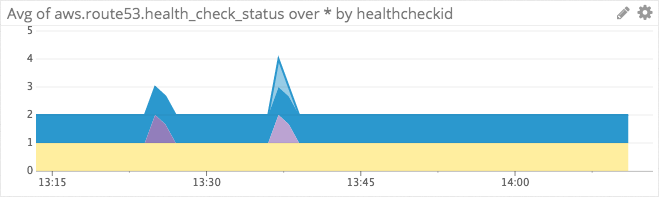
Amazon Route 53 provides DNS and traffic management along with availability and performance monitoring through health checks. You can view the health check information in Datadog to provide context around other metrics and events in your environments. Here’s an example dashboard of Route 53’s health check status graph:
For information about the rest of the AWS services, see the AWS tile
Setup
Installation
If you haven’t already, set up the Amazon Web Services integration first.
Metric collection
In the AWS integration page, ensure that Route53 is enabled under the Metric Collection tab.
Add those permissions to your Datadog IAM policy in order to collect Amazon Route 53 metrics:
route53:listHealthChecks: List available health checks.route53:listTagsForResources: Add custom tags on Route53 CloudWatch metrics.
For more information, see the Route53 policies on the AWS website.
Install the Datadog - Amazon Route53 integration.
Note: To get Amazon Route 53 metrics using CloudWatch, you must choose US East (N. Virginia) as the region. Amazon Route 53 metrics are not available if you select any other region. See Monitoring health check status and getting notifications for more information.
Log collection
Configure Amazon Route 53 to log information about the queries that Route 53 receives, such as the following:
- The domain or subdomain that was requested
- The date and time of the request
- The DNS record type (such as A or AAAA)
- The Route 53 edge location that responded to the DNS query
- The DNS response code, such as NoError or ServFail
- Resolver Query logs for you VPC
Enable Route53 DNS query logging
- Go to your Route 53 AWS console and click Hosted zones.
- Click the radio button for the hosted zone you want to configure logs for.
- Click View Details.
- Click Configure query logging.
- Select the CloudWatch log group or create a new one to send the logs to. Make sure “route53” is included in the log group name.
Enable Route53 resolver query logging
- In the Route 53 settings pane on the left, select Query Logging under Resolver.
- Click Configure Query Logging.
- Enter a name for your Resolver query.
- Select the CloudWatch Logs group you want the Resolver to send the query logs to. Make sure “route53” is included in the log group name.
- Add the VPCs that you want to log Resolver queries for.
- Optionally, add tags.
- Click Configure query logging.
Send logs to Datadog
- If you haven’t already, set up the Datadog Forwarder Lambda function in your AWS account.
- Once set up, go to the Datadog Forwarder Lambda function. In the Function Overview section, click Add Trigger.
- Select the CloudWatch Logs trigger for the Trigger Configuration.
- Select the CloudWatch log group that contains your Route53 logs.
- Enter a name for the filter.
- Click Add to add the trigger to your Lambda.
Go to the Log Explorer to start exploring your logs.
For more information on collecting AWS Services logs, see Send AWS Services Logs with the Datadog Lambda Function.
Data Collected
Metrics
| |
|---|
aws.route53.child_health_check_healthy_count
(gauge) | For a calculated health check, the number of health checks that are healthy among the health checks that Amazon Route 53 is monitoring. |
aws.route53.connection_time
(gauge) | The average time that it took Amazon Route 53 health checkers to establish a TCP connection with the endpoint.
Shown as millisecond |
aws.route53.dnsqueries
(count) | The number of DNS queries that Route53 responds to for all records in a hosted zone.
Shown as query |
aws.route53.health_check_percentage_healthy
(gauge) | The percentage of Amazon Route 53 health checkers that consider the selected endpoint to be healthy.
Shown as percent |
aws.route53.health_check_status
(gauge) | The status of the health check endpoint that CloudWatch is checking. 1 indicates healthy, and 0 indicates unhealthy. |
aws.route53.sslhandshake_time
(gauge) | The average time that it took Amazon Route 53 health checkers to complete the SSL handshake. |
aws.route53.time_to_first_byte
(gauge) | The average time that it took Amazon Route 53 health checkers to receive the first byte of the response to an HTTP or HTTPS request.
Shown as millisecond |
aws.route53resolver.inbound_query_volume
(count) | The number of DNS queries forwarded from your network to your VPCs through the endpoint specified by EndpointId.
Shown as query |
aws.route53resolver.outbound_query_aggregate_volume
(count) | The number of DNS queries forwarded from your VPCs to your network through the endpoint that is specified by EndpointId.
Shown as query |
aws.route53resolver.outbound_query_volume
(count) | The number of DNS queries forwarded from your VPCs to your network through the endpoint specified by EndpointId.
Shown as query |
aws.route53resolver.endpoint_healthy_enicount
(gauge) | The number of elastic network interfaces in the OPERATIONAL status.
Shown as unit |
aws.route53resolver.endpoint_unhealthy_enicount
(gauge) | The number of elastic network interfaces in the AUTO_RECOVERING status.
Shown as unit |
aws.route53resolver.vpc_firewall_query_volume
(count) | The number of DNS Firewall queries from a VPC (specified by VpcId).
Shown as query |
aws.route53resolver.firewall_rule_group_query_volume
(count) | The number of DNS Firewall queries that match a firewall rule group (specified by FirewallRuleGroupId).
Shown as query |
aws.route53resolver.firewall_rule_group_vpc_query_volume
(count) | The number of DNS Firewall queries from a VPC (specified by VpcId) that match a firewall rule group (specified by FirewallRuleGroupId).
Shown as query |
aws.route53resolver.firewall_rule_query_volume
(count) | The number of DNS firewall queries that match a firewall domain list (specified by FirewallDomainListId) within a firewall rule group (specified by FirewallRuleGroupId).
Shown as query |
Each of the metrics retrieved from AWS are assigned the same tags that appear in the AWS console, including but not limited to host name, security-groups, and more.
Events
The Amazon Route 53 integration does not include any events.
Service Checks
The Amazon Route 53 integration does not include any service checks.
Troubleshooting
Need help? Contact Datadog support.