- Essentials
- Getting Started
- Agent
- API
- APM Tracing
- Containers
- Dashboards
- Database Monitoring
- Datadog
- Datadog Site
- DevSecOps
- Incident Management
- Integrations
- Internal Developer Portal
- Logs
- Monitors
- Notebooks
- OpenTelemetry
- Profiler
- Search
- Session Replay
- Security
- Serverless for AWS Lambda
- Software Delivery
- Synthetic Monitoring and Testing
- Tags
- Workflow Automation
- Learning Center
- Support
- Glossary
- Standard Attributes
- Guides
- Agent
- Integrations
- Extend Datadog
- Authorization
- DogStatsD
- Custom Checks
- Integrations
- Build an Integration with Datadog
- Create an Agent-based Integration
- Create an API-based Integration
- Create a Log Pipeline
- Integration Assets Reference
- Build a Marketplace Offering
- Create an Integration Dashboard
- Create a Monitor Template
- Create a Cloud SIEM Detection Rule
- Install Agent Integration Developer Tool
- Service Checks
- Community
- Guides
- OpenTelemetry
- Administrator's Guide
- API
- Partners
- Datadog Mobile App
- DDSQL Reference
- CoScreen
- CoTerm
- Remote Configuration
- Cloudcraft (Standalone)
- In The App
- Dashboards
- Notebooks
- DDSQL Editor
- Reference Tables
- Sheets
- Monitors and Alerting
- Service Level Objectives
- Metrics
- Watchdog
- Bits AI
- Internal Developer Portal
- Error Tracking
- Change Tracking
- Event Management
- Incident Response
- Actions & Remediations
- Infrastructure
- Cloudcraft
- Resource Catalog
- Universal Service Monitoring
- End User Device Monitoring
- Hosts
- Containers
- Processes
- Serverless
- Network Monitoring
- Storage Management
- Cloud Cost
- Application Performance
- APM
- Continuous Profiler
- Database Monitoring
- Agent Integration Overhead
- Setup Architectures
- Setting Up Postgres
- Setting Up MySQL
- Setting Up SQL Server
- Setting Up Oracle
- Setting Up Amazon DocumentDB
- Setting Up MongoDB
- Connecting DBM and Traces
- Data Collected
- Exploring Database Hosts
- Exploring Query Metrics
- Exploring Query Samples
- Exploring Database Schemas
- Exploring Recommendations
- Troubleshooting
- Guides
- Data Streams Monitoring
- Data Observability
- Digital Experience
- Real User Monitoring
- Synthetic Testing and Monitoring
- Continuous Testing
- Product Analytics
- Session Replay
- Software Delivery
- CI Visibility
- CD Visibility
- Deployment Gates
- Test Optimization
- Code Coverage
- PR Gates
- DORA Metrics
- Feature Flags
- Developer Integrations
- Security
- Security Overview
- Cloud SIEM
- Code Security
- Cloud Security
- App and API Protection
- AI Guard
- Workload Protection
- Sensitive Data Scanner
- AI Observability
- Log Management
- Observability Pipelines
- Configuration
- Sources
- Processors
- Destinations
- Packs
- Akamai CDN
- Amazon CloudFront
- Amazon VPC Flow Logs
- AWS Application Load Balancer Logs
- AWS CloudTrail
- AWS Elastic Load Balancer Logs
- AWS Network Load Balancer Logs
- Cisco ASA
- Cloudflare
- F5
- Fastly
- Fortinet Firewall
- HAProxy Ingress
- Istio Proxy
- Juniper SRX Firewall Traffic Logs
- Netskope
- NGINX
- Okta
- Palo Alto Firewall
- Windows XML
- ZScaler ZIA DNS
- Zscaler ZIA Firewall
- Zscaler ZIA Tunnel
- Zscaler ZIA Web Logs
- Search Syntax
- Scaling and Performance
- Monitoring and Troubleshooting
- Guides and Resources
- Log Management
- CloudPrem
- Administration
GPU Monitoring
GPU Monitoring is not available for the site.
Join the Preview!
GPU Monitoring is in Preview. To join the preview, click Request Access and complete the form.
Request AccessOverview
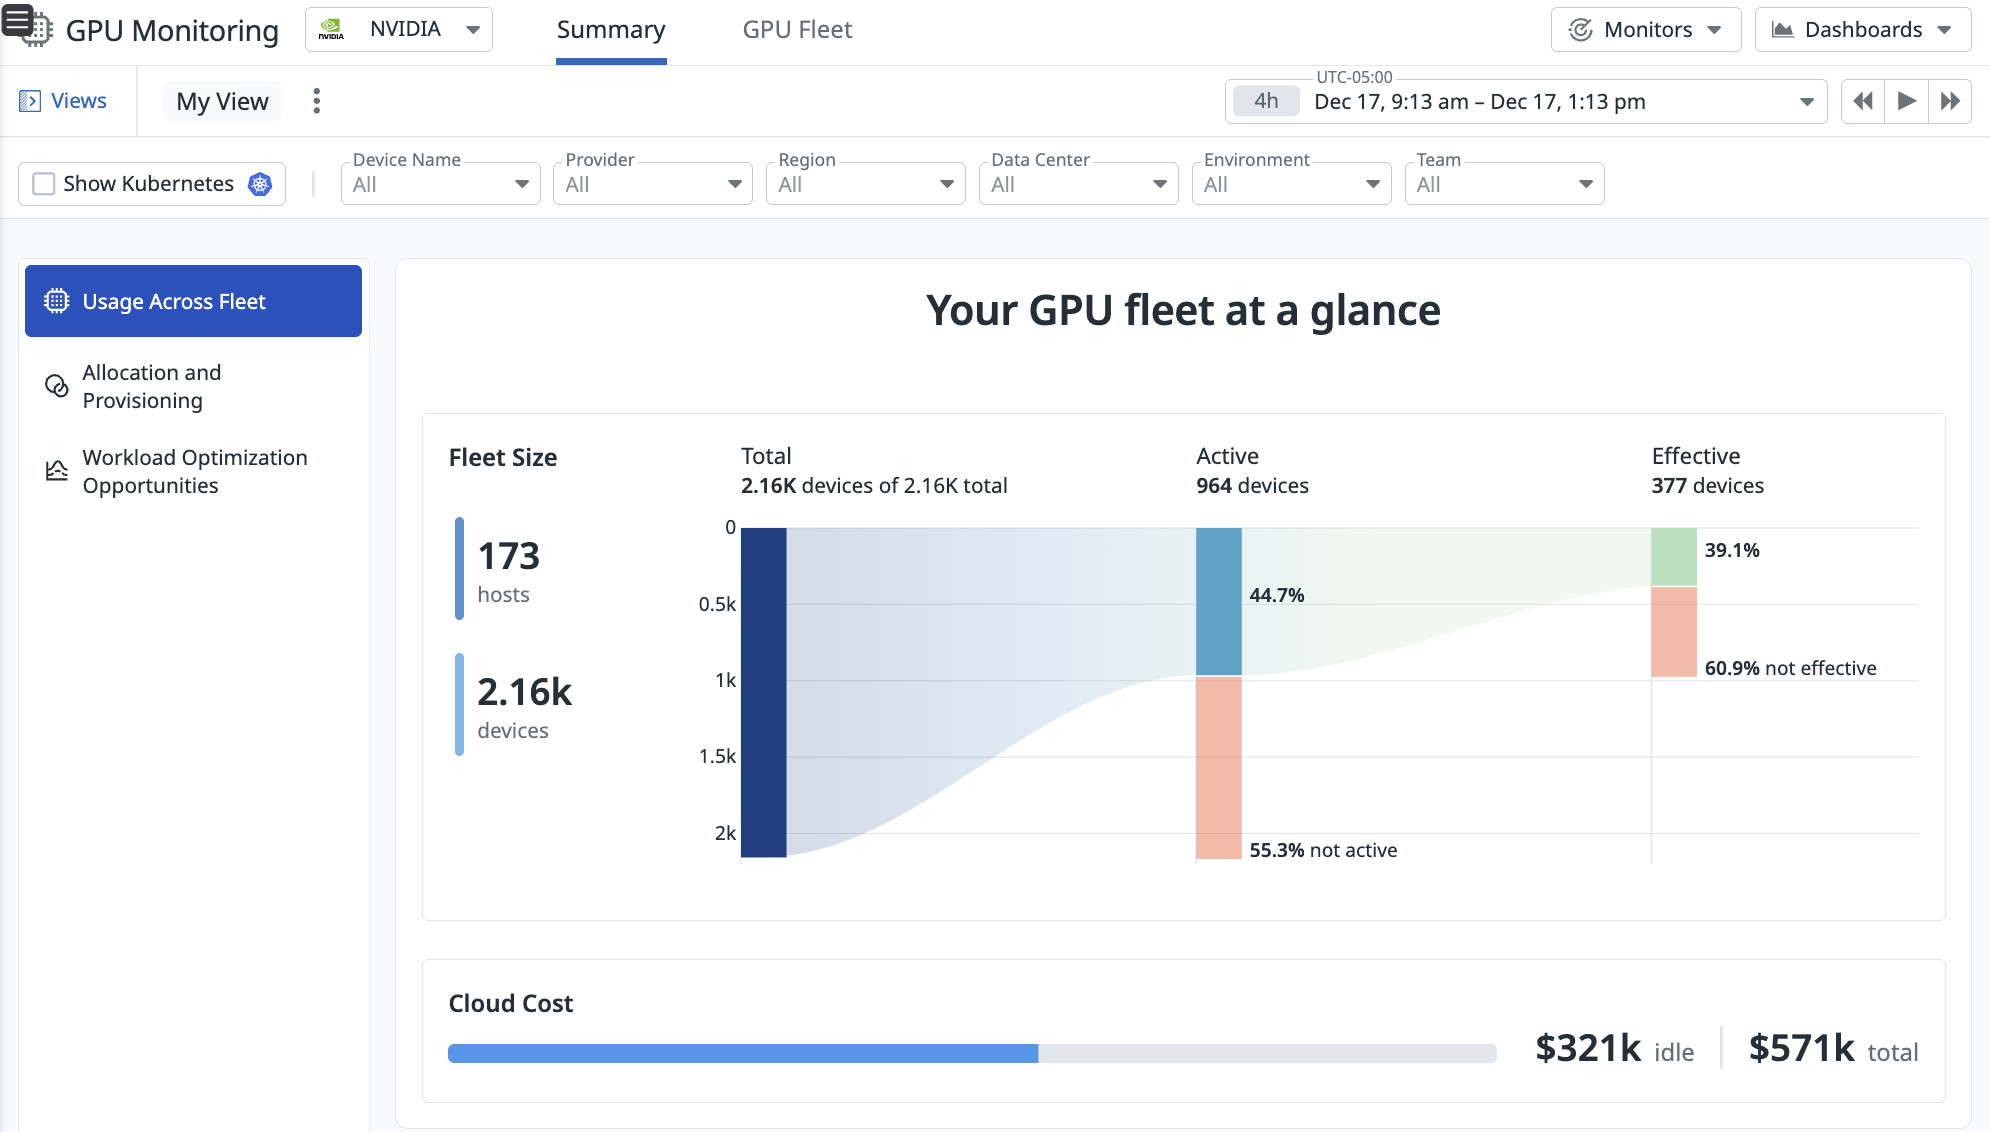
Datadog’s GPU Monitoring provides a centralized view into your GPU fleet’s health, cost, and performance. It enables teams to make better provisioning decisions, optimize and troubleshoot AI workload performance, and eliminate idle GPU costs without having to manually set up individual vendor tools (like NVIDIA’s DCGM). GPU Monitoring supports fleets deployed across the major cloud providers (AWS, GCP, Azure, Oracle Cloud), hosted on-premises, or provisioned through GPU-as-a-Service platforms like Coreweave and Lambda Labs.
You can access insights into your GPU fleet by deploying the Datadog Agent on your GPU-accelerated hosts. For setup instructions, see Set up GPU Monitoring.
Key Capabilities
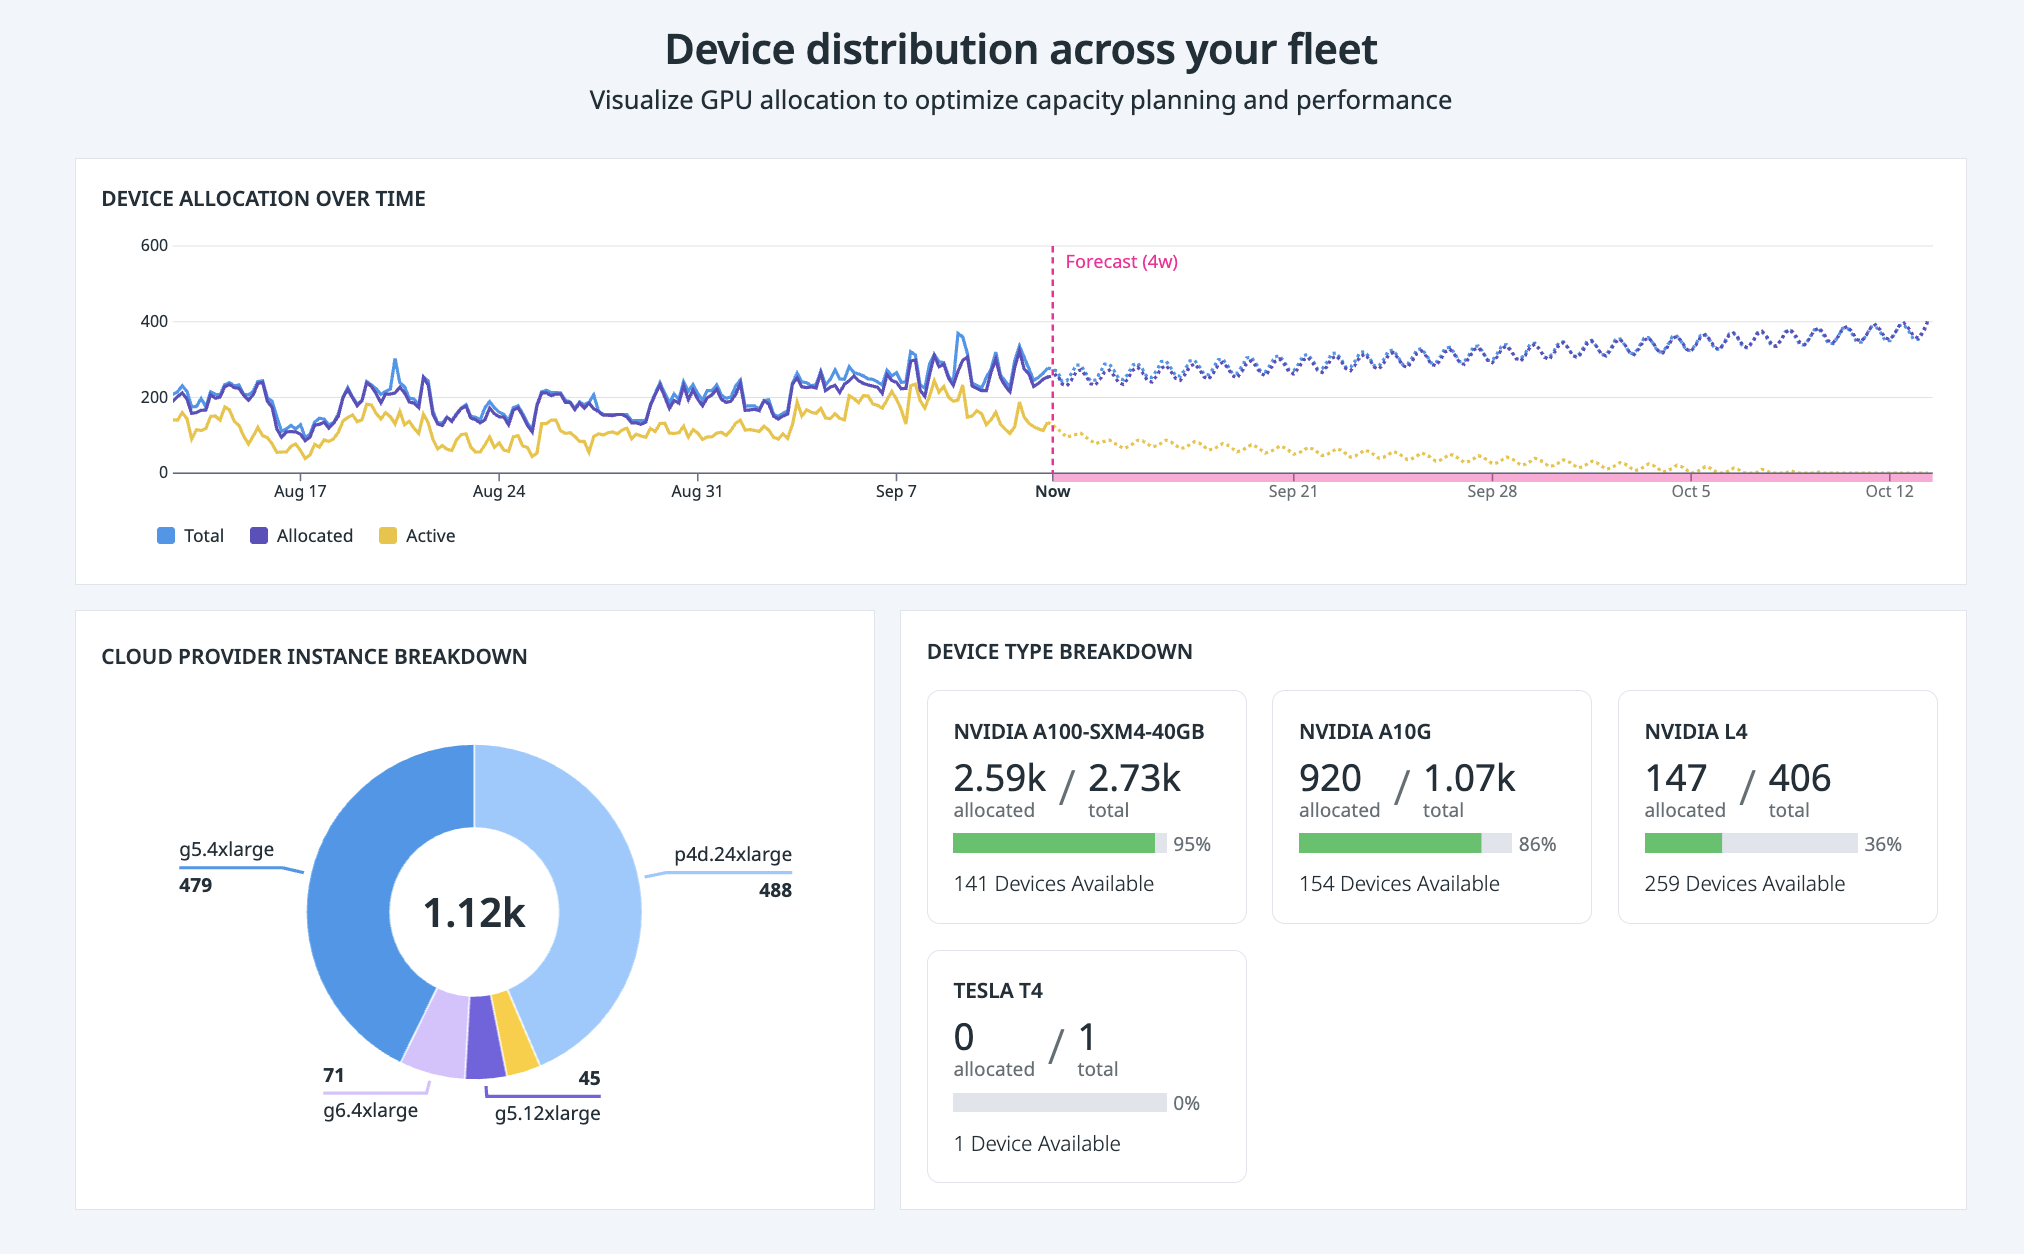
1. Make data-driven GPU allocation and provisioning decisions
With a comprehensive view of your entire fleet and available capacity, Datadog’s GPU Monitoring helps you assign and manage your infrastructure and capacity fairly across your organization.
You can also understand your current device availability and forecast how many devices are needed for certain teams or workloads to avoid failed workloads from resource contention.
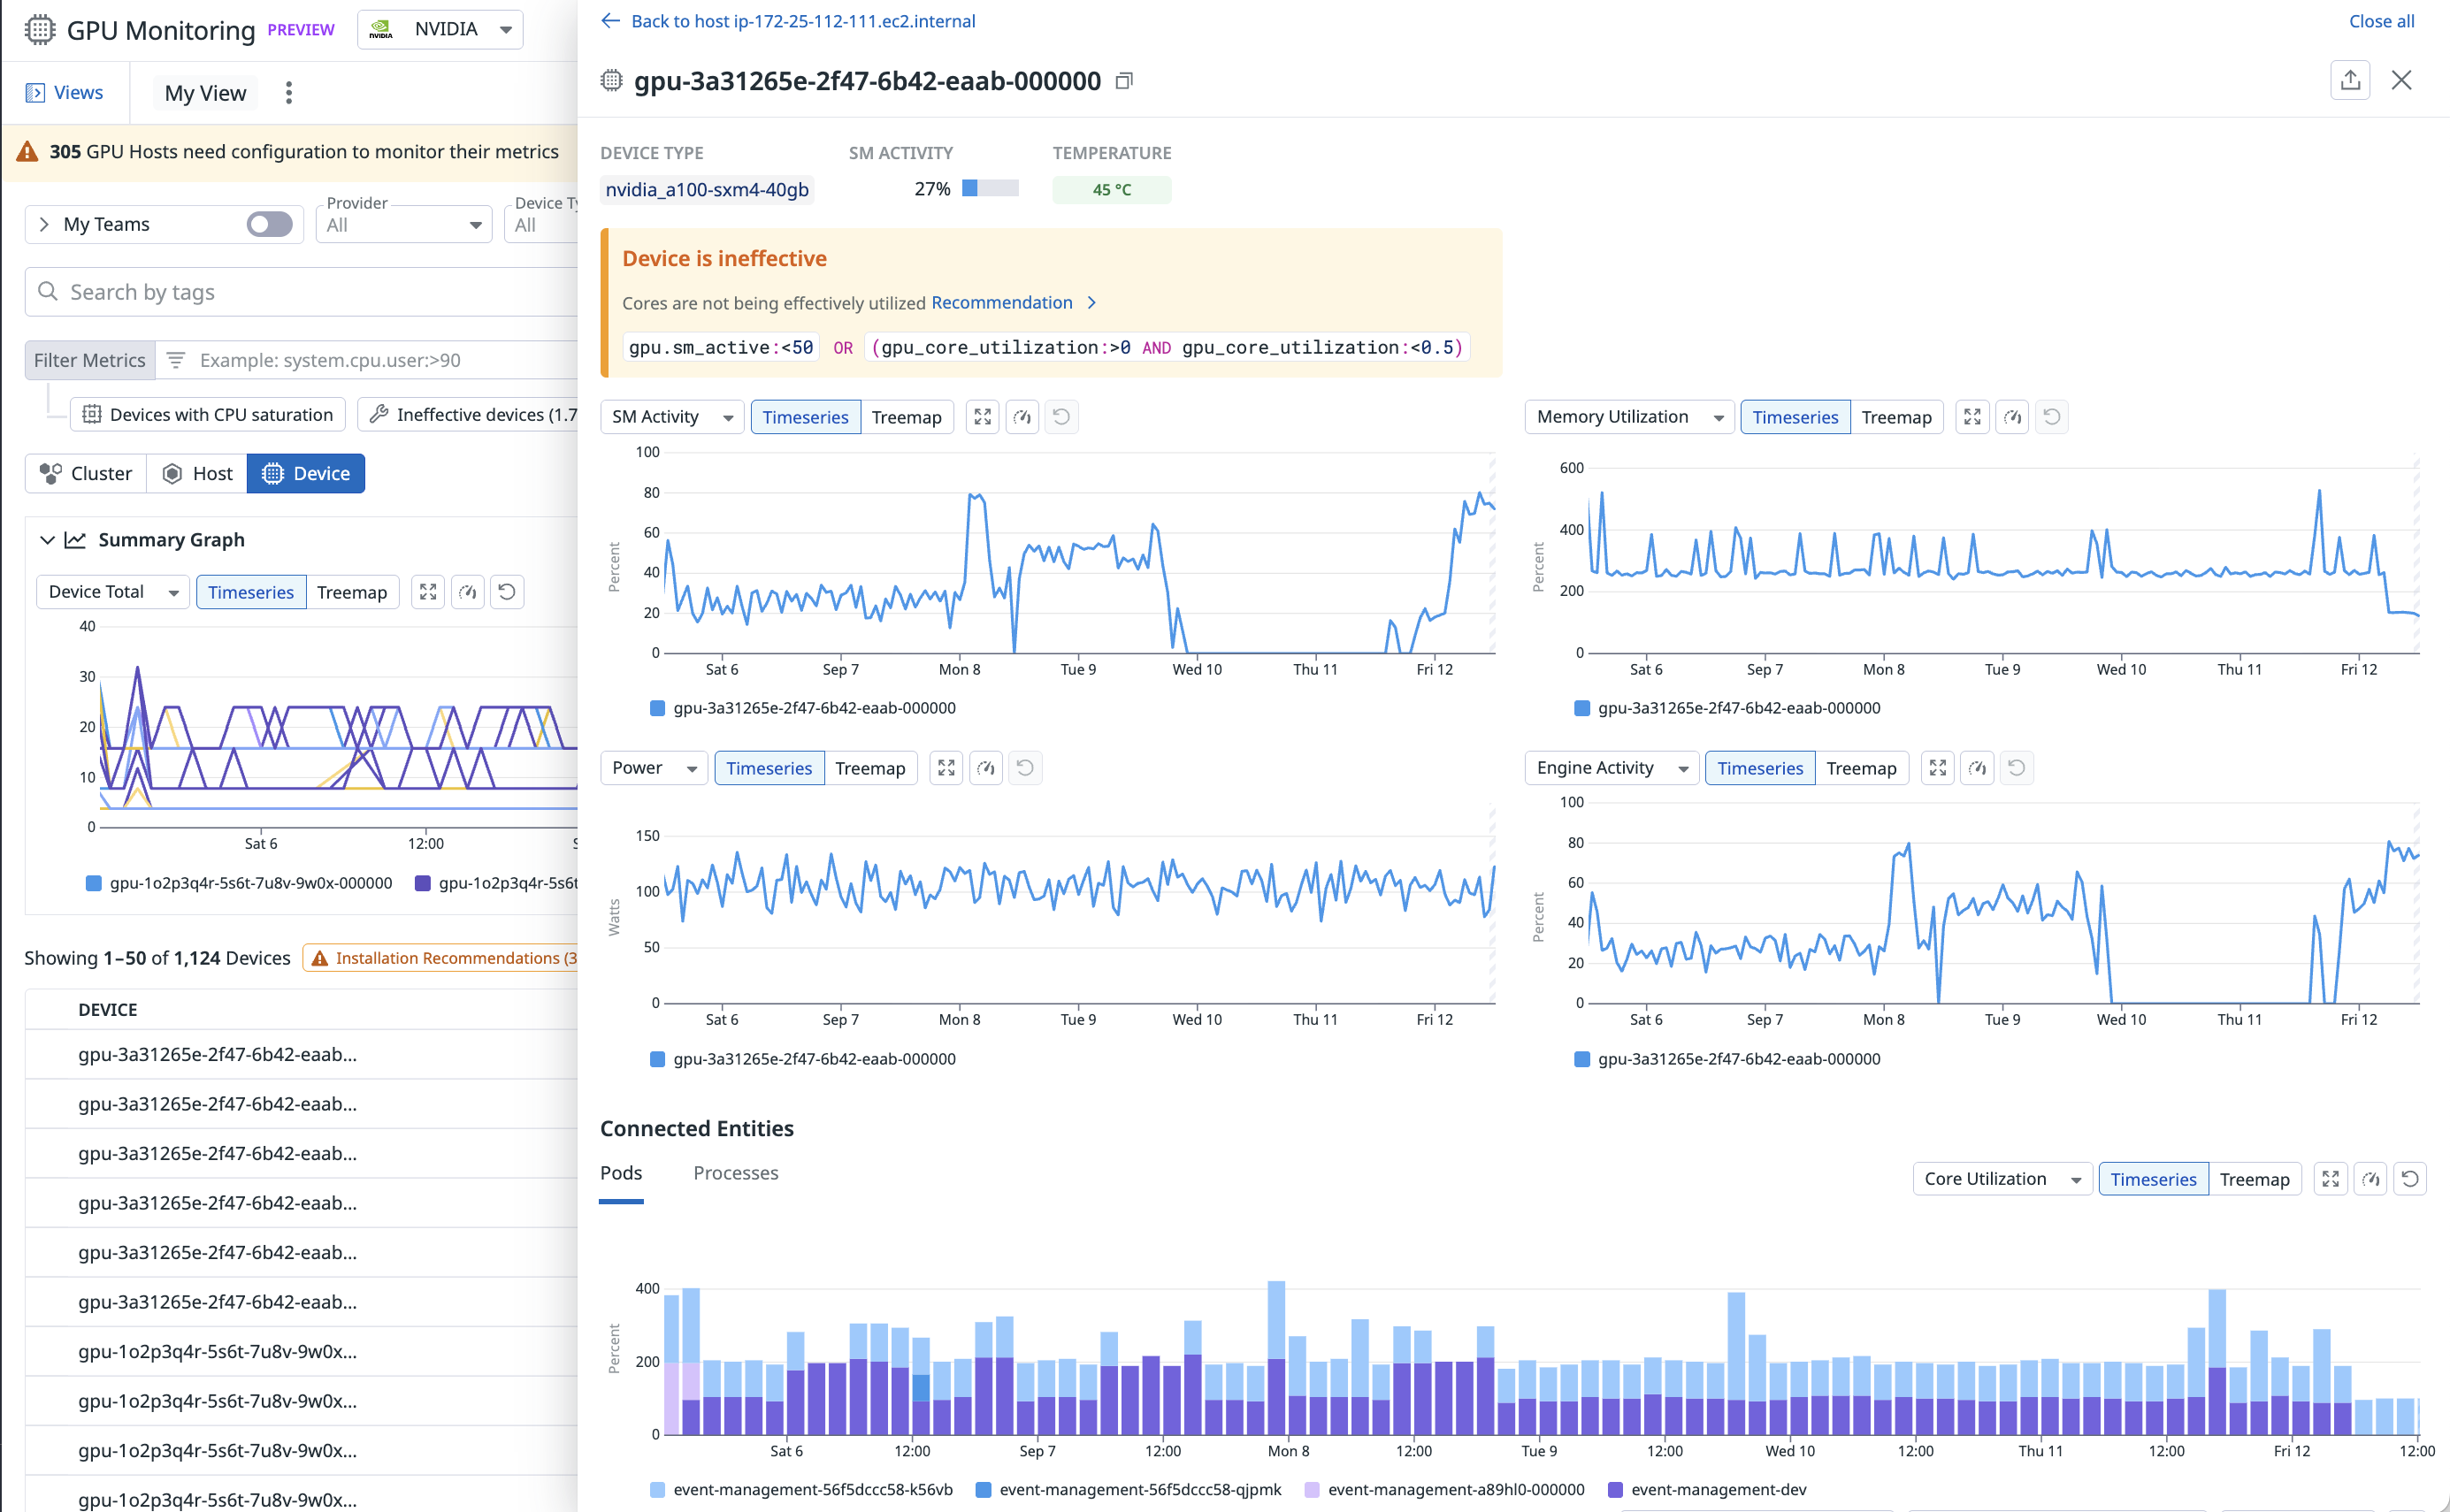
2. Maximize model and application performance
With GPU Monitoring’s resource telemetry, you can analyze trends in GPU resources and metrics (including GPU utilization, power, and memory) by host, node, or pod over time, helping you understand devices’ effects on your model and application performance. For example, you can identify hotspots or underutilization of expensive GPU infrastructure that could be bottlenecks for your workloads’ execution
3. Proactively detect hardware issues
GPUs are an expensive and scarce resource that have higher failure rates than standard servers. Datadog’s GPU Monitoring solution provides OOTB monitors and proactive recommendations to help you detect and remediate hardware issues before they impact your mission-critical workloads.
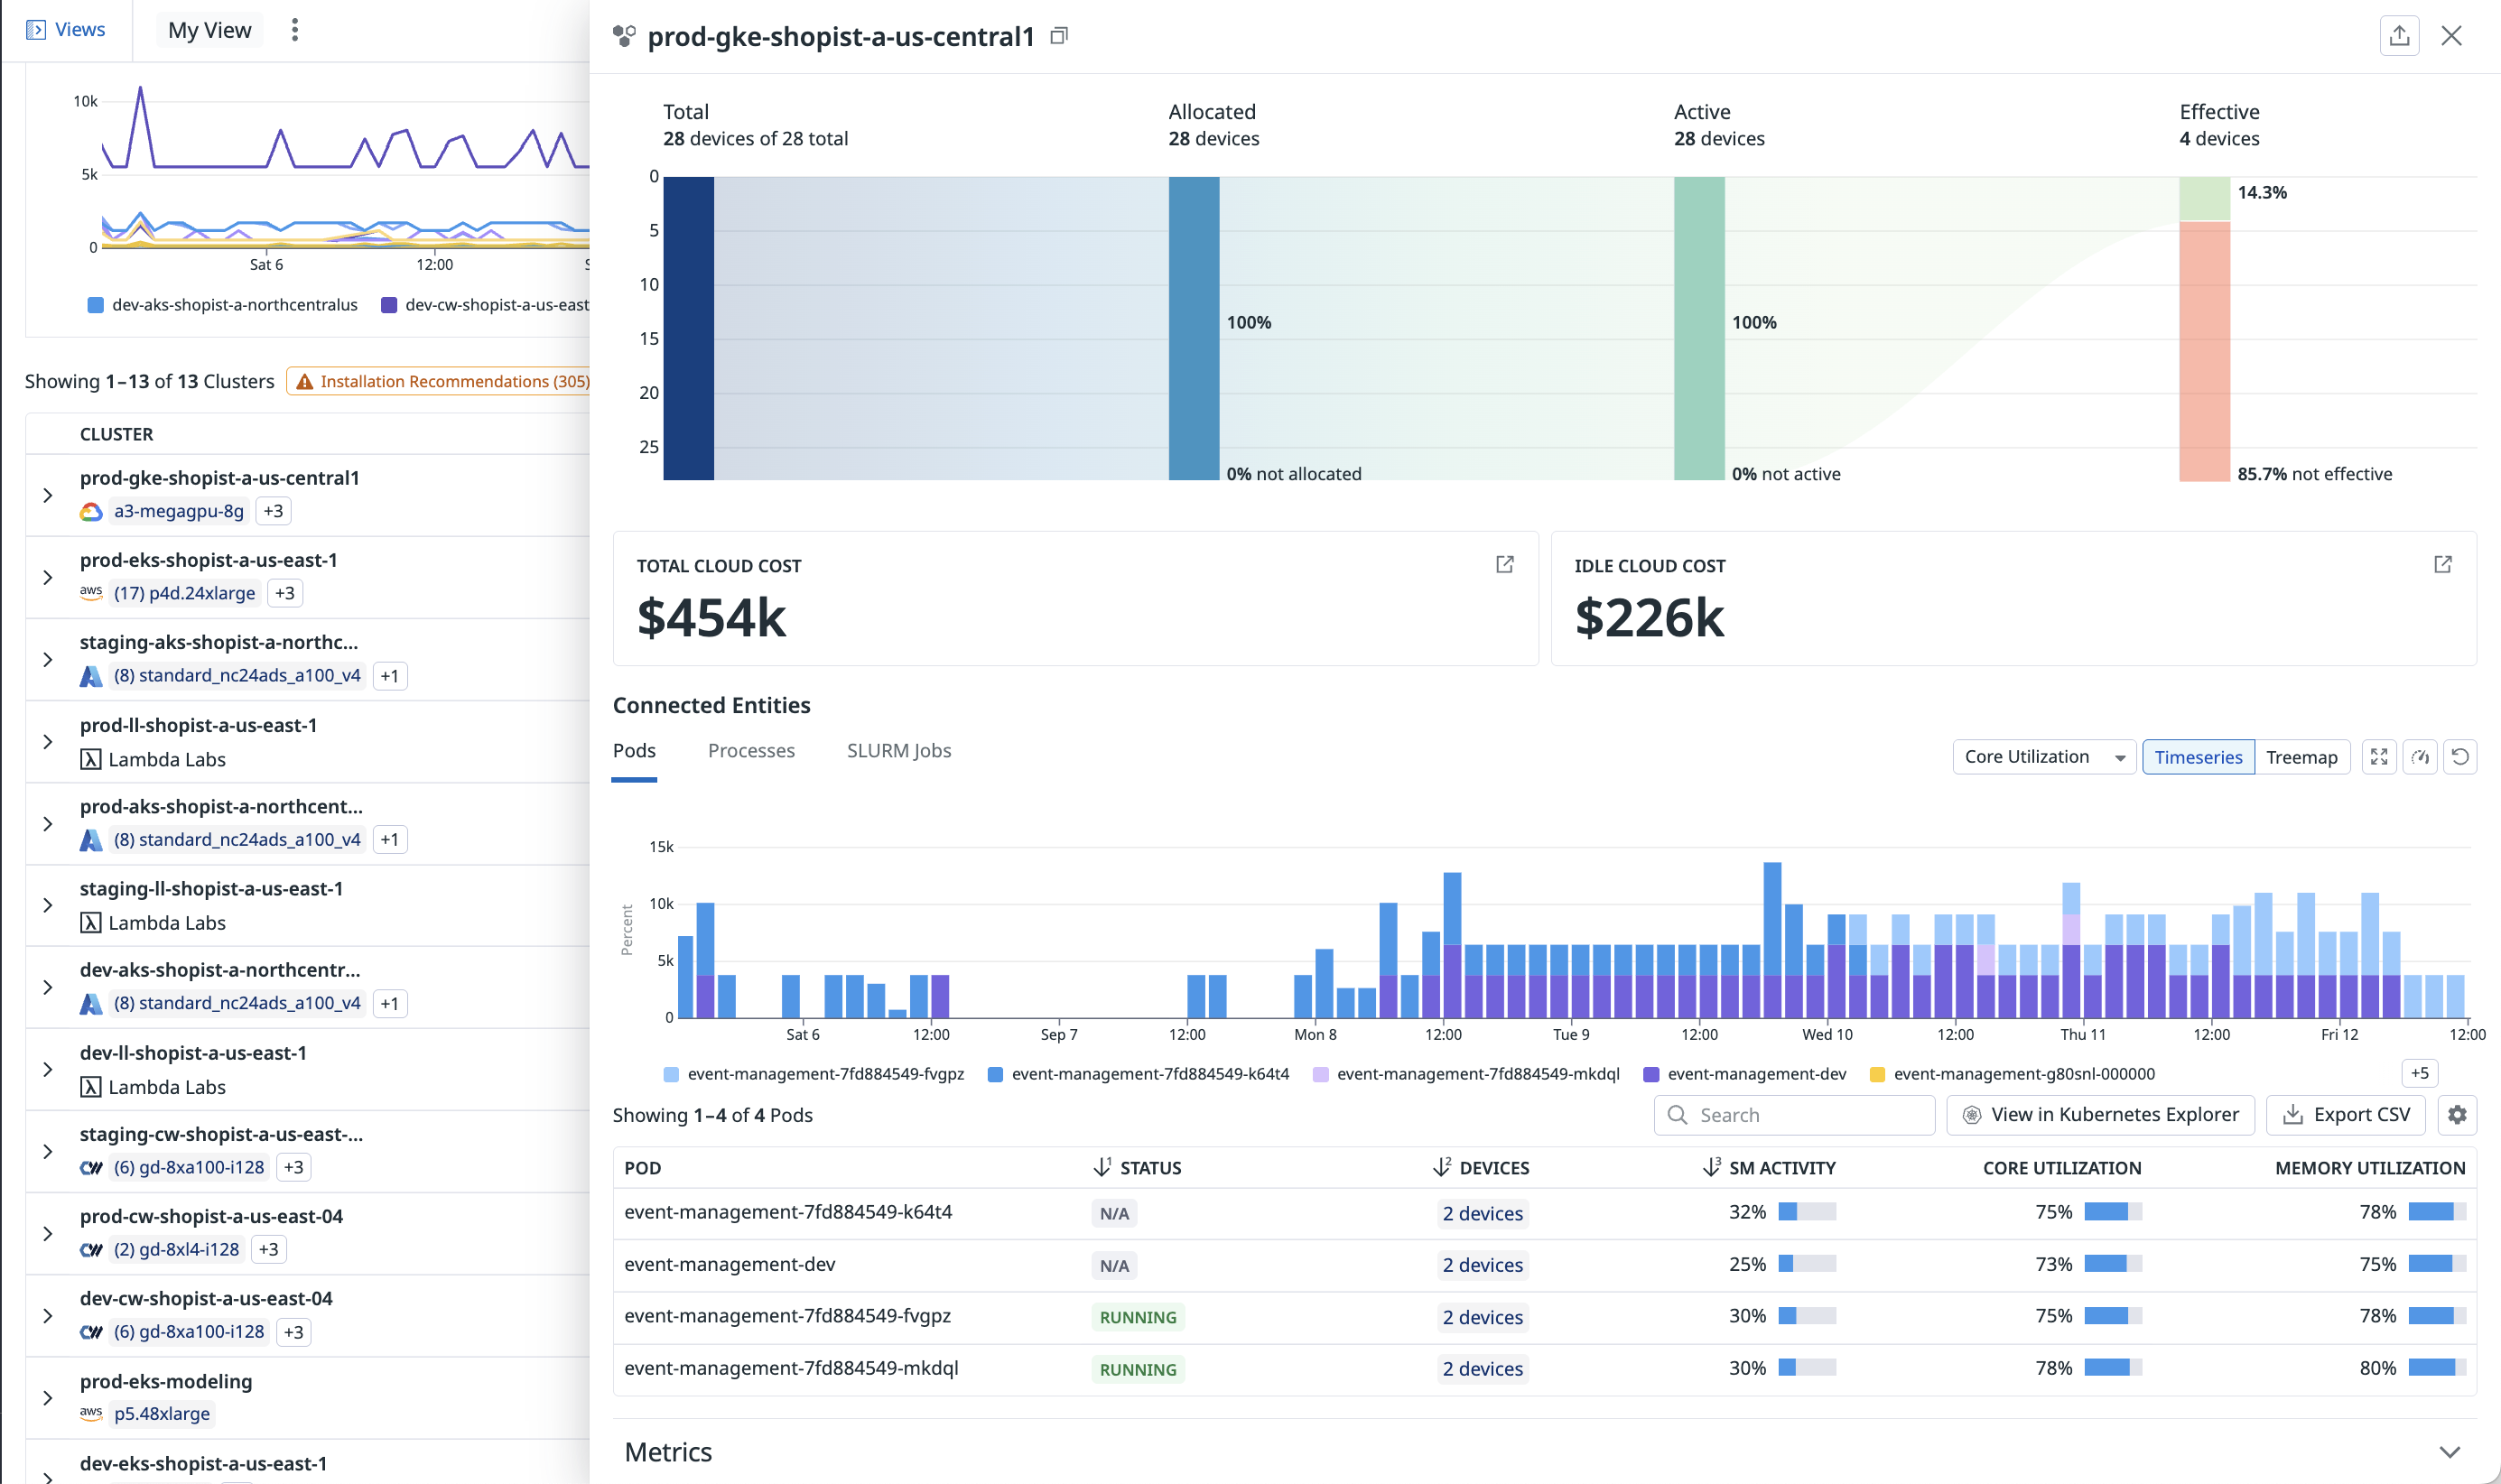
4. Identify and eliminate wasted, idle GPU costs
Identify total spend on GPU infrastructure and attribute those costs to specific workloads and instances. Directly correlate GPU usage to related pods or processes.
Ready to start?
See Set up GPU Monitoring for instructions on how to set up Datadog’s GPU Monitoring.
Further Reading
Additional helpful documentation, links, and articles:


