- Essentials
- Getting Started
- Agent
- API
- APM Tracing
- Containers
- Dashboards
- Database Monitoring
- Datadog
- Datadog Site
- DevSecOps
- Incident Management
- Integrations
- Internal Developer Portal
- Logs
- Monitors
- OpenTelemetry
- Profiler
- Session Replay
- Security
- Serverless for AWS Lambda
- Software Delivery
- Synthetic Monitoring and Testing
- Tags
- Workflow Automation
- Learning Center
- Support
- Glossary
- Standard Attributes
- Guides
- Agent
- Integrations
- Developers
- Authorization
- DogStatsD
- Custom Checks
- Integrations
- Create an Agent-based Integration
- Create an API Integration
- Create a Log Pipeline
- Integration Assets Reference
- Build a Marketplace Offering
- Create a Tile
- Create an Integration Dashboard
- Create a Monitor Template
- Create a Cloud SIEM Detection Rule
- OAuth for Integrations
- Install Agent Integration Developer Tool
- Service Checks
- IDE Plugins
- Community
- Guides
- OpenTelemetry
- Administrator's Guide
- API
- Partners
- Datadog Mobile App
- DDSQL Reference
- CoScreen
- CoTerm
- Cloudcraft (Standalone)
- In The App
- Dashboards
- Notebooks
- DDSQL Editor
- Reference Tables
- Sheets
- Monitors and Alerting
- Metrics
- Watchdog
- Bits AI
- Internal Developer Portal
- Error Tracking
- Change Tracking
- Service Management
- Actions & Remediations
- Infrastructure
- Cloudcraft
- Resource Catalog
- Universal Service Monitoring
- Hosts
- Containers
- Processes
- Serverless
- Network Monitoring
- Cloud Cost
- Application Performance
- APM
- APM Terms and Concepts
- Application Instrumentation
- APM Metrics Collection
- Trace Pipeline Configuration
- Correlate Traces with Other Telemetry
- Trace Explorer
- Recommendations
- Code Origins for Spans
- Service Observability
- Endpoint Observability
- Dynamic Instrumentation
- Live Debugger
- Error Tracking
- Data Security
- Guides
- Troubleshooting
- Continuous Profiler
- Database Monitoring
- Agent Integration Overhead
- Setup Architectures
- Setting Up Postgres
- Setting Up MySQL
- Setting Up SQL Server
- Setting Up Oracle
- Setting Up Amazon DocumentDB
- Setting Up MongoDB
- Connecting DBM and Traces
- Data Collected
- Exploring Database Hosts
- Exploring Query Metrics
- Exploring Query Samples
- Exploring Database Schemas
- Exploring Recommendations
- Troubleshooting
- Guides
- Data Streams Monitoring
- Data Jobs Monitoring
- Data Observability
- Digital Experience
- Real User Monitoring
- Synthetic Testing and Monitoring
- Continuous Testing
- Product Analytics
- Software Delivery
- CI Visibility
- CD Visibility
- Deployment Gates
- Test Optimization
- Quality Gates
- DORA Metrics
- Security
- Security Overview
- Cloud SIEM
- Code Security
- Cloud Security
- App and API Protection
- Workload Protection
- Sensitive Data Scanner
- AI Observability
- Log Management
- Observability Pipelines
- Log Management
- Administration
Getting Started with Test Optimization
This product is not supported for your selected Datadog site. ().
Overview
Test Optimization allows you to better understand your test posture, identify commits introducing flaky tests, identify performance regressions, and troubleshoot complex test failures.
You can visualize the performance of your test runs as traces, where spans represent the execution of different parts of the test.
Test Optimization enables development teams to debug, optimize, and accelerate software testing across CI environments by providing insights about test performance, flakiness, and failures. Test Optimization automatically instruments each test and integrates intelligent test selection using the Test Impact Analysis, enhancing test efficiency and reducing redundancy.
With historical test data, teams can understand performance regressions, compare the outcome of tests from feature branches to default branches, and establish performance benchmarks. By using Test Optimization, teams can improve their developer workflows and maintain quality code output.
Set up a test service
Test Optimization tracks the performance and results of your CI tests, and displays results of the test runs.
To start instrumenting and running tests, see the documentation for one of the following languages.
Test Optimization is compatible with any CI provider and is not limited to those supported by CI Visibility. For more information about supported features, see Test Optimization.
Use CI test data
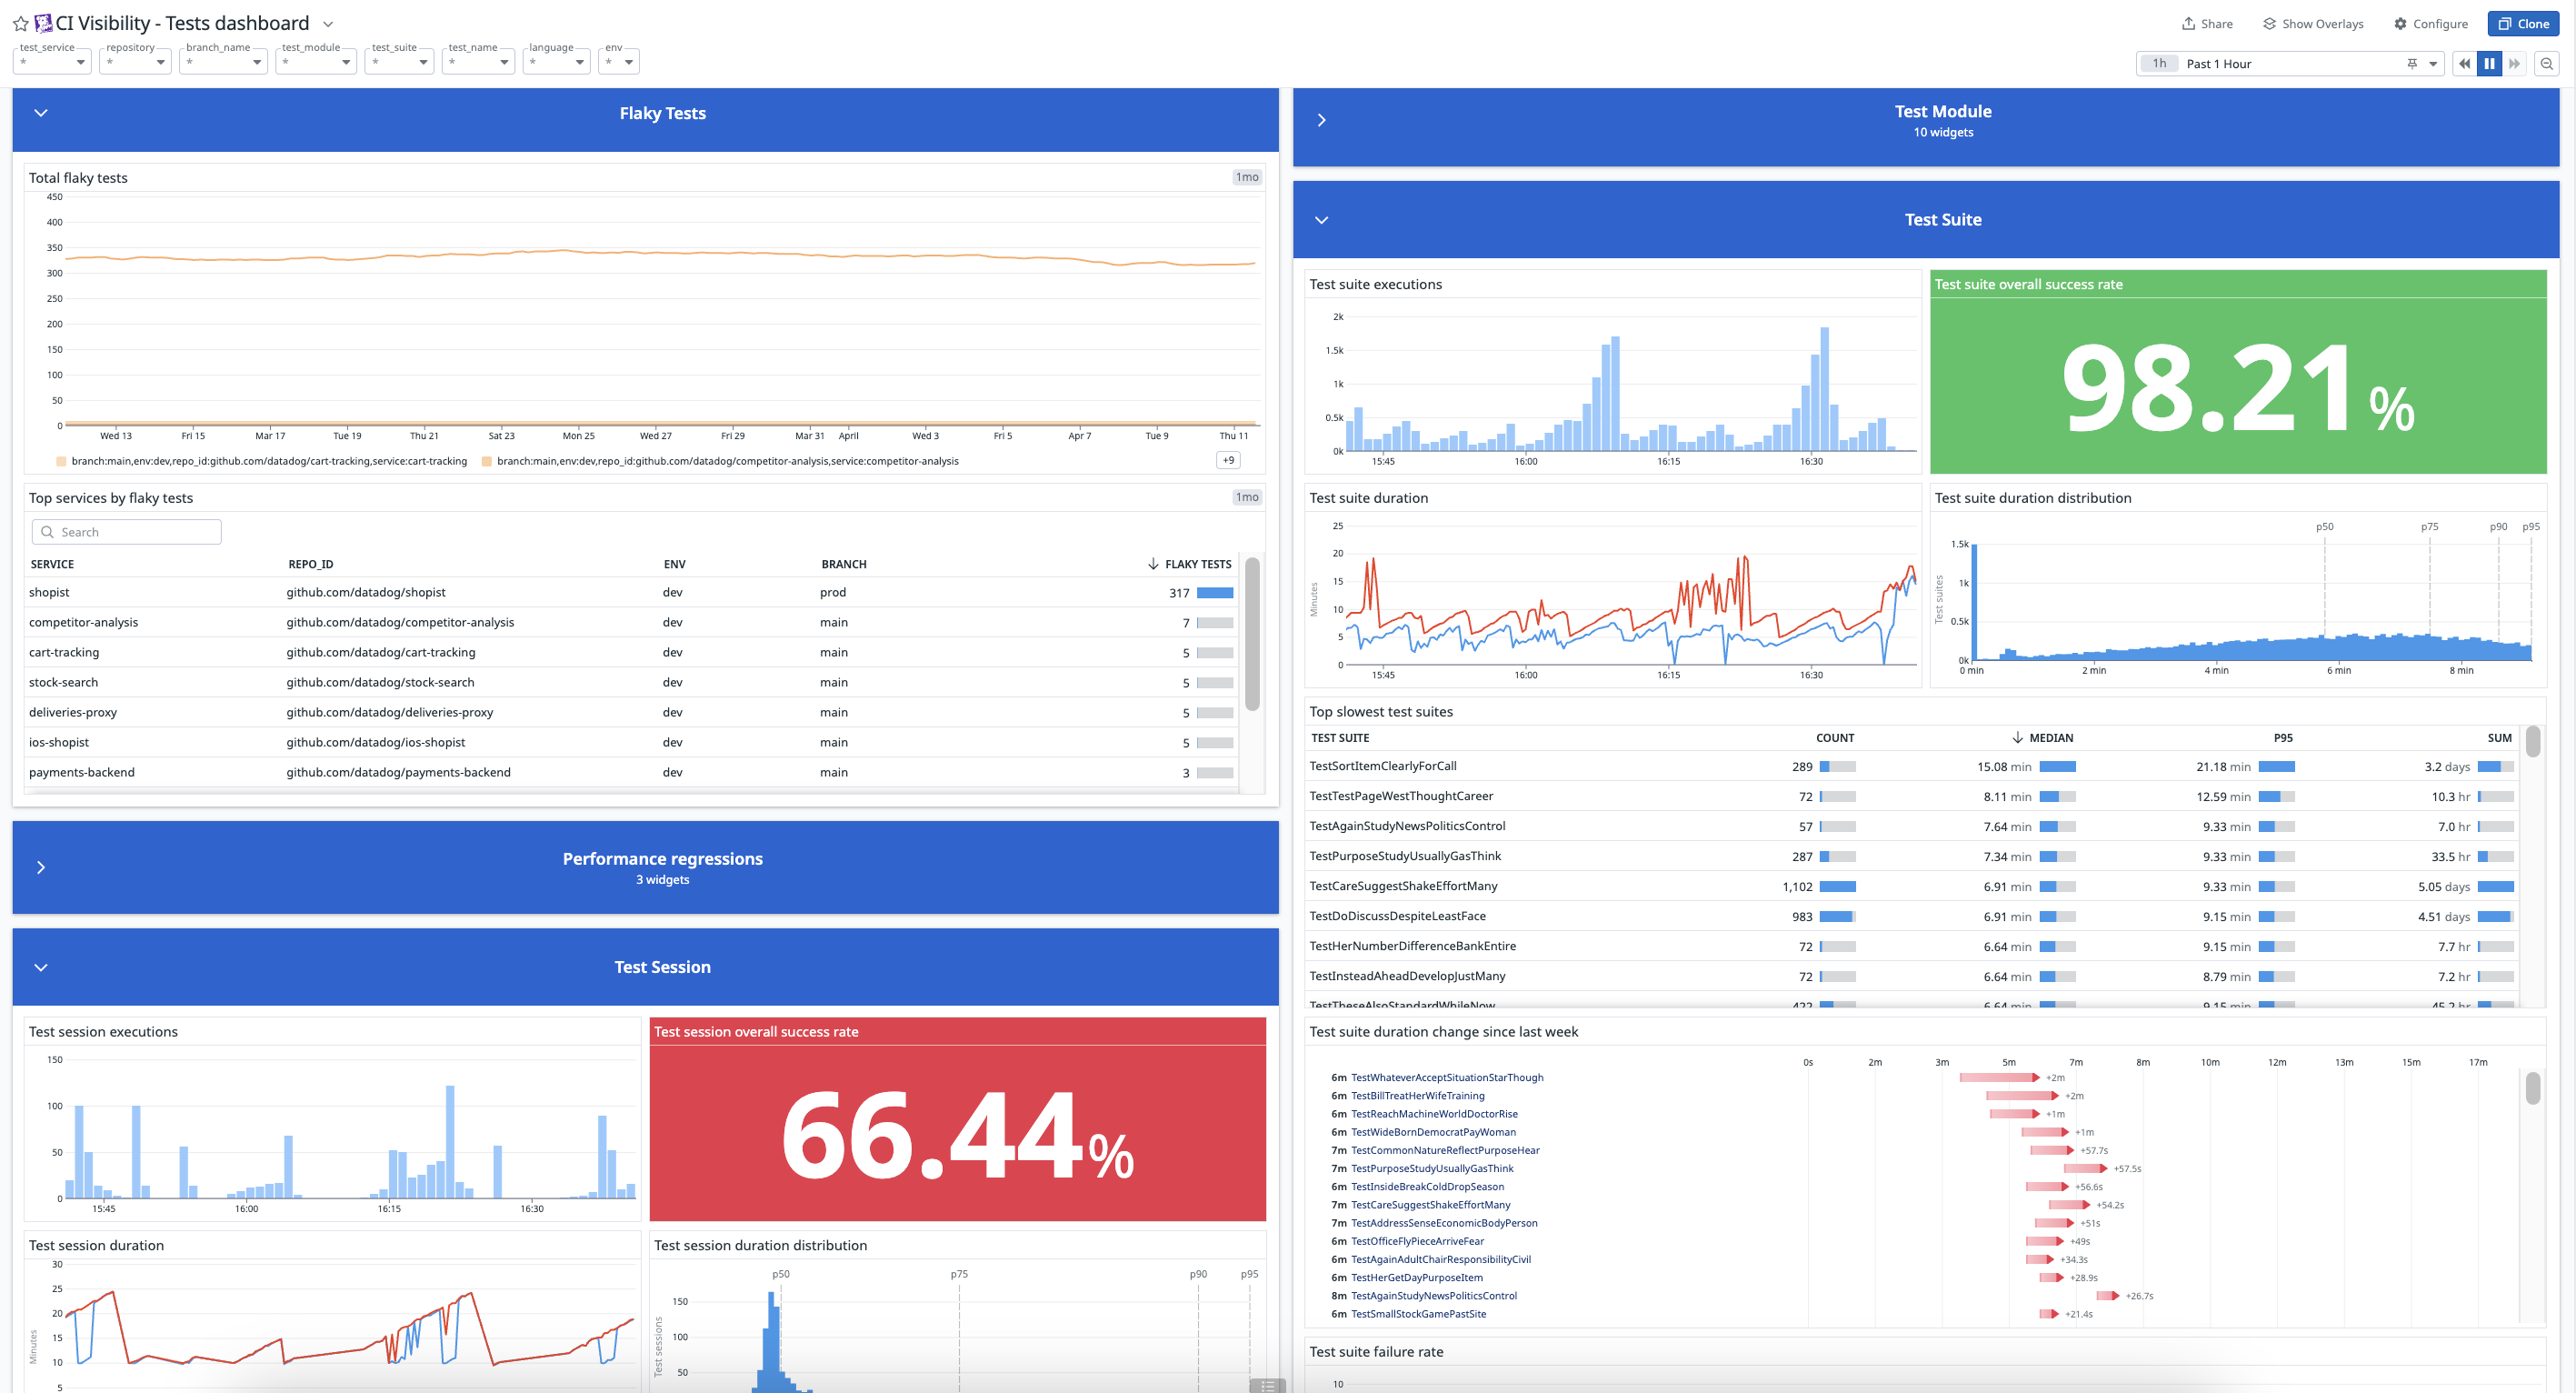
Access your tests’ metrics (such as executions, duration, distribution of duration, overall success rate, failure rate, and more) to start identifying important trends and patterns using the data collected from your tests across CI pipelines.
You can create dashboards for monitoring flaky tests, performance regressions, and test failures occurring within your tests. Alternatively, you can utilize an out-of-the-box dashboard containing widgets populated with data collected in Test Optimization to visualize the health and performance of your CI test sessions, modules, suites, and tests.
Manage flaky tests
A flaky test is a test that exhibits both a passing and failing status across multiple test runs for the same commit. If you commit some code and run it through CI, and a test fails, and you run it through CI again and the same test now passes, that test is unreliable and marked as flaky.
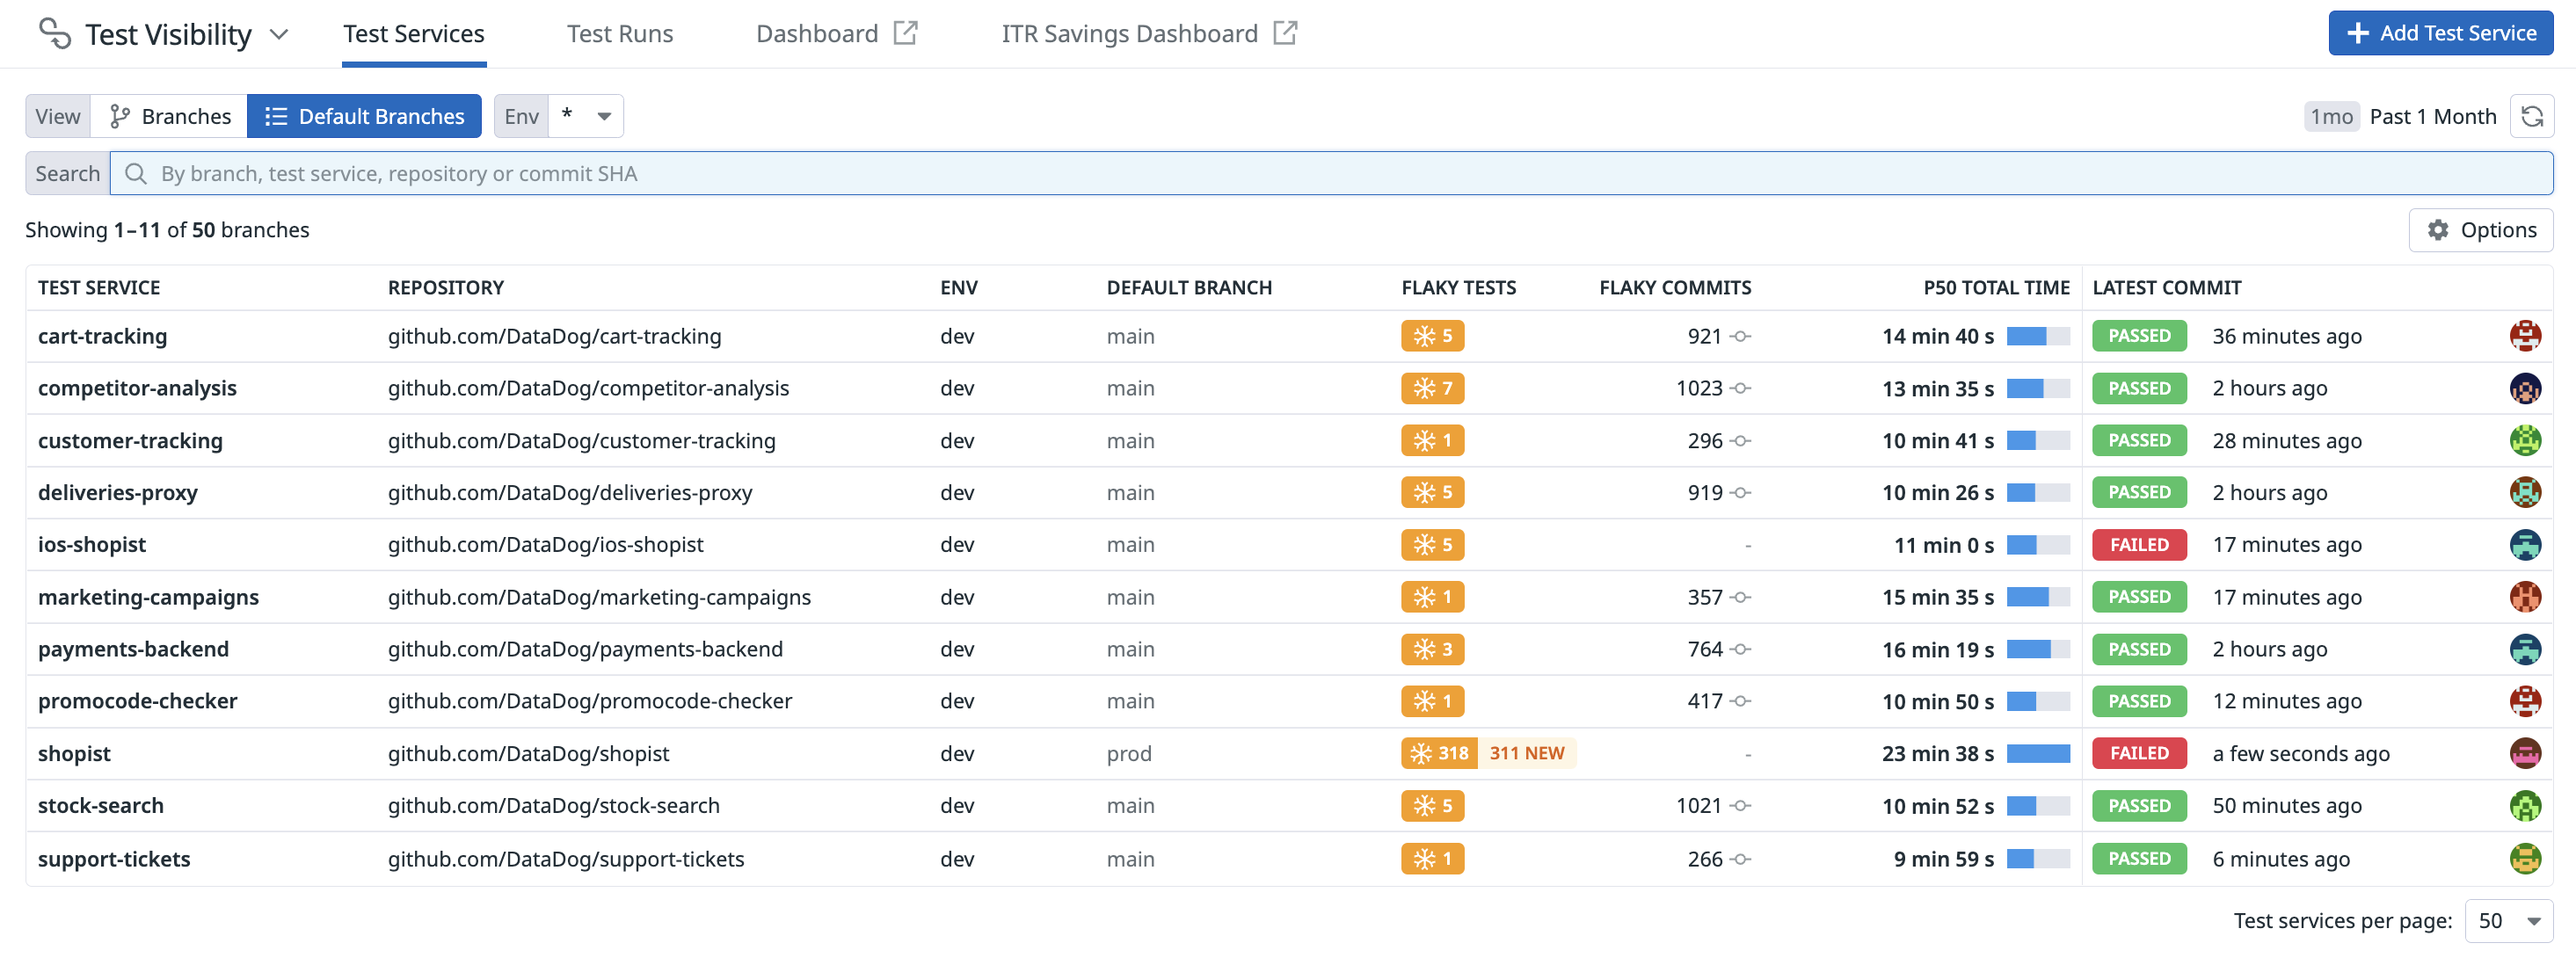
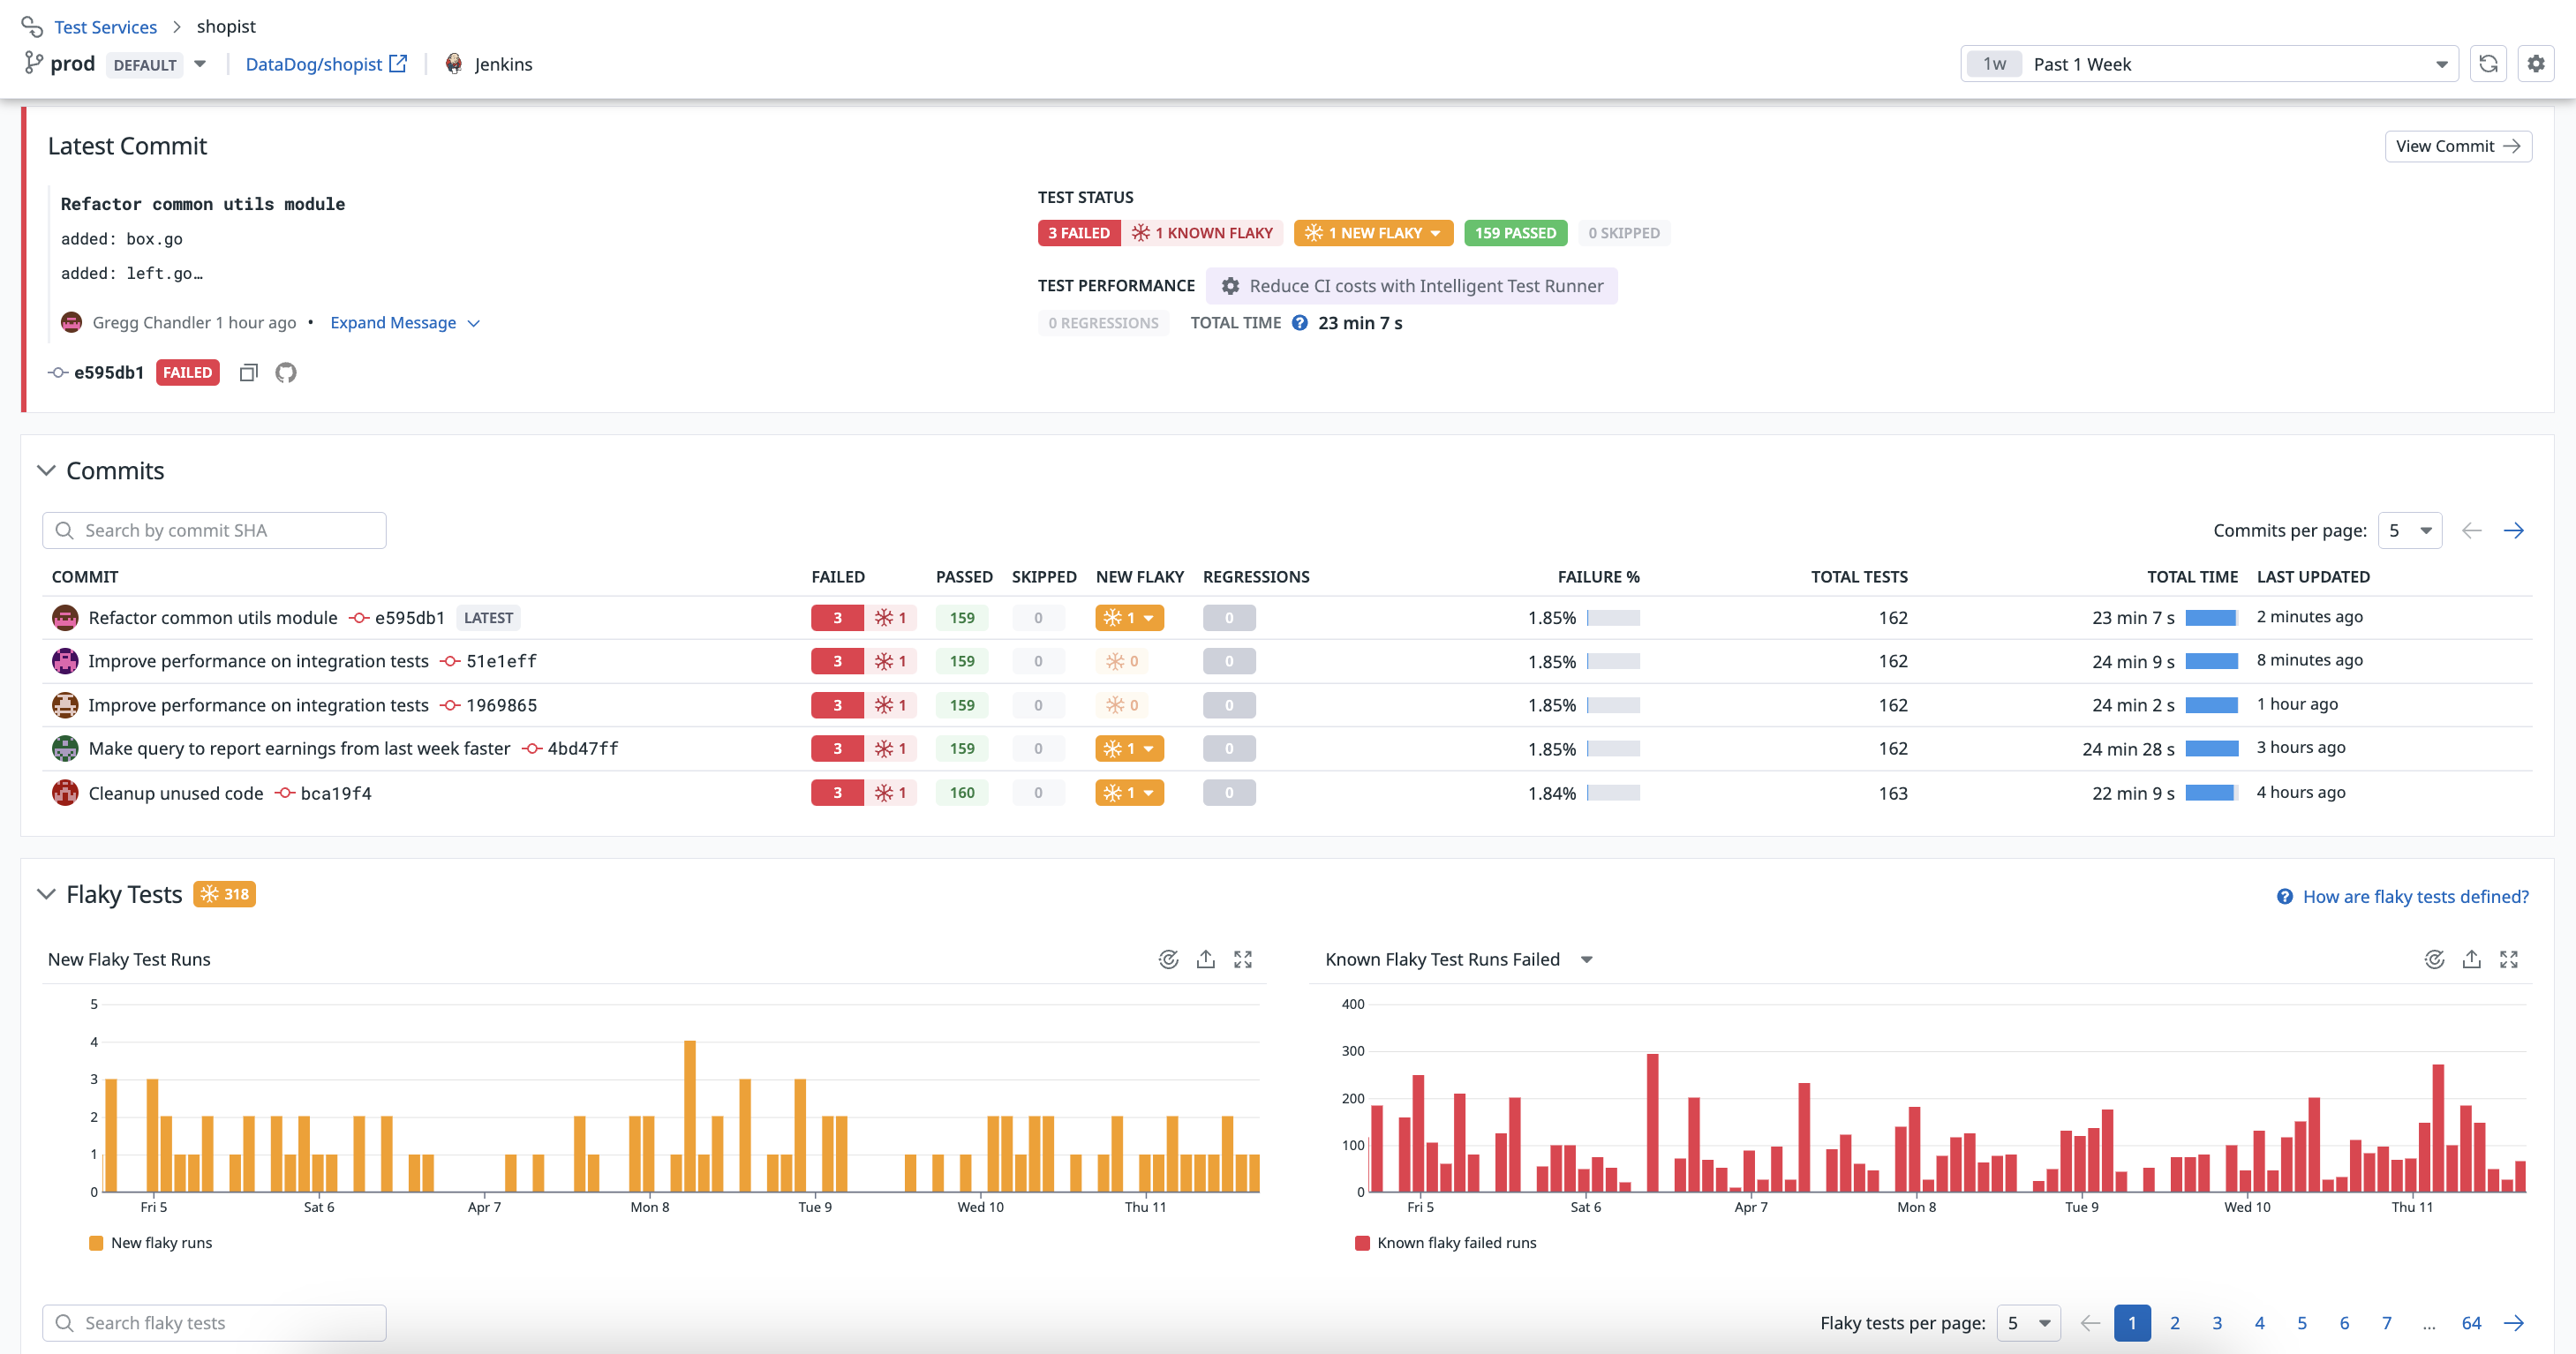
You can access flaky test information in the Flaky Tests section of a test run’s overview page, or as a column on your list of test services on the Test List page.
For each branch, the list shows the number of new flaky tests, the number of commits flaked by the tests, total test time, and the branch’s latest commit details.
- Average duration
- The average time the test takes to run.
- First flaked and Last flaked
- The date and commit SHAs for when the test first and most recently exhibited flaky behavior.
- Commits flaked
- The number of commits in which the test exhibited flaky behavior.
- Failure rate
- The percentage of test runs that have failed for this test since it first flaked.
- Trend
- A visualization that indicates whether a flaky test was fixed or it is still actively flaking.
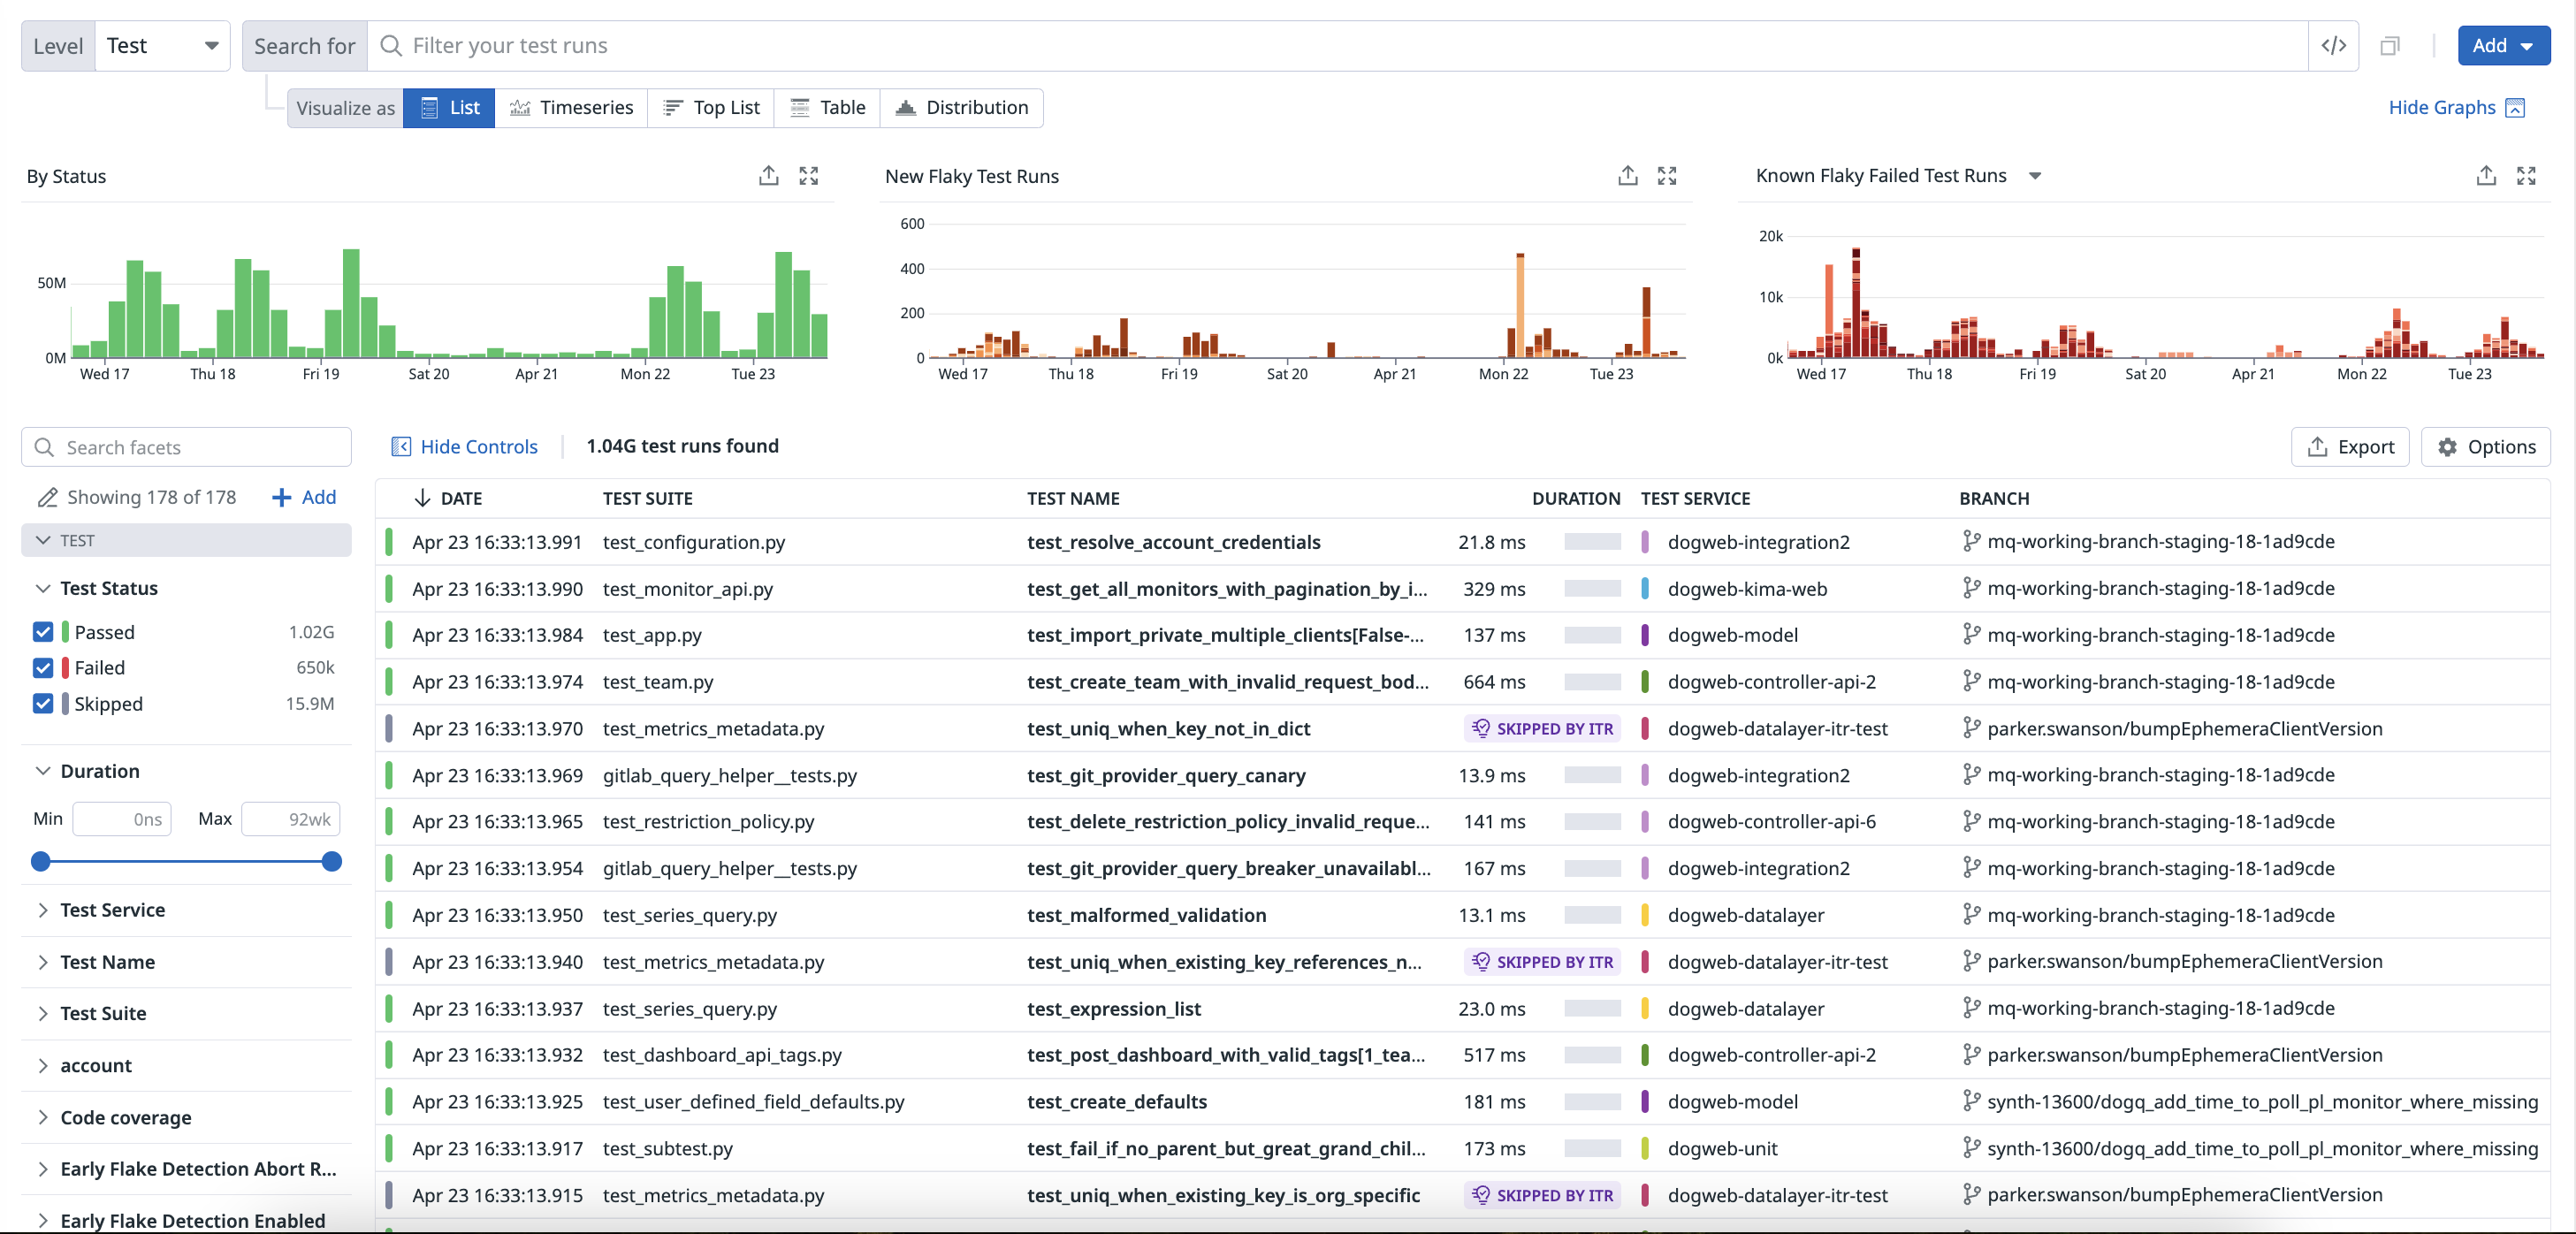
Test Optimization displays the following graphs to help you understand your flaky test trends and the impact of your flaky tests in a commit’s Flaky Tests section:
- New Flaky Test Runs
- How often new flaky tests are being detected.
- Known Flaky Test Runs
- All of the test failures associated with the flaky tests being tracked. This shows every time a flaky test “flakes”.
To ignore new flaky tests for a commit that you’ve determined the flaky tests were detected by mistake, click on a test containing a New Flaky value with a dropdown option, and click Ignore flaky tests. For more information, see Flaky Test Management.
Examine results in the Test Optimization Explorer
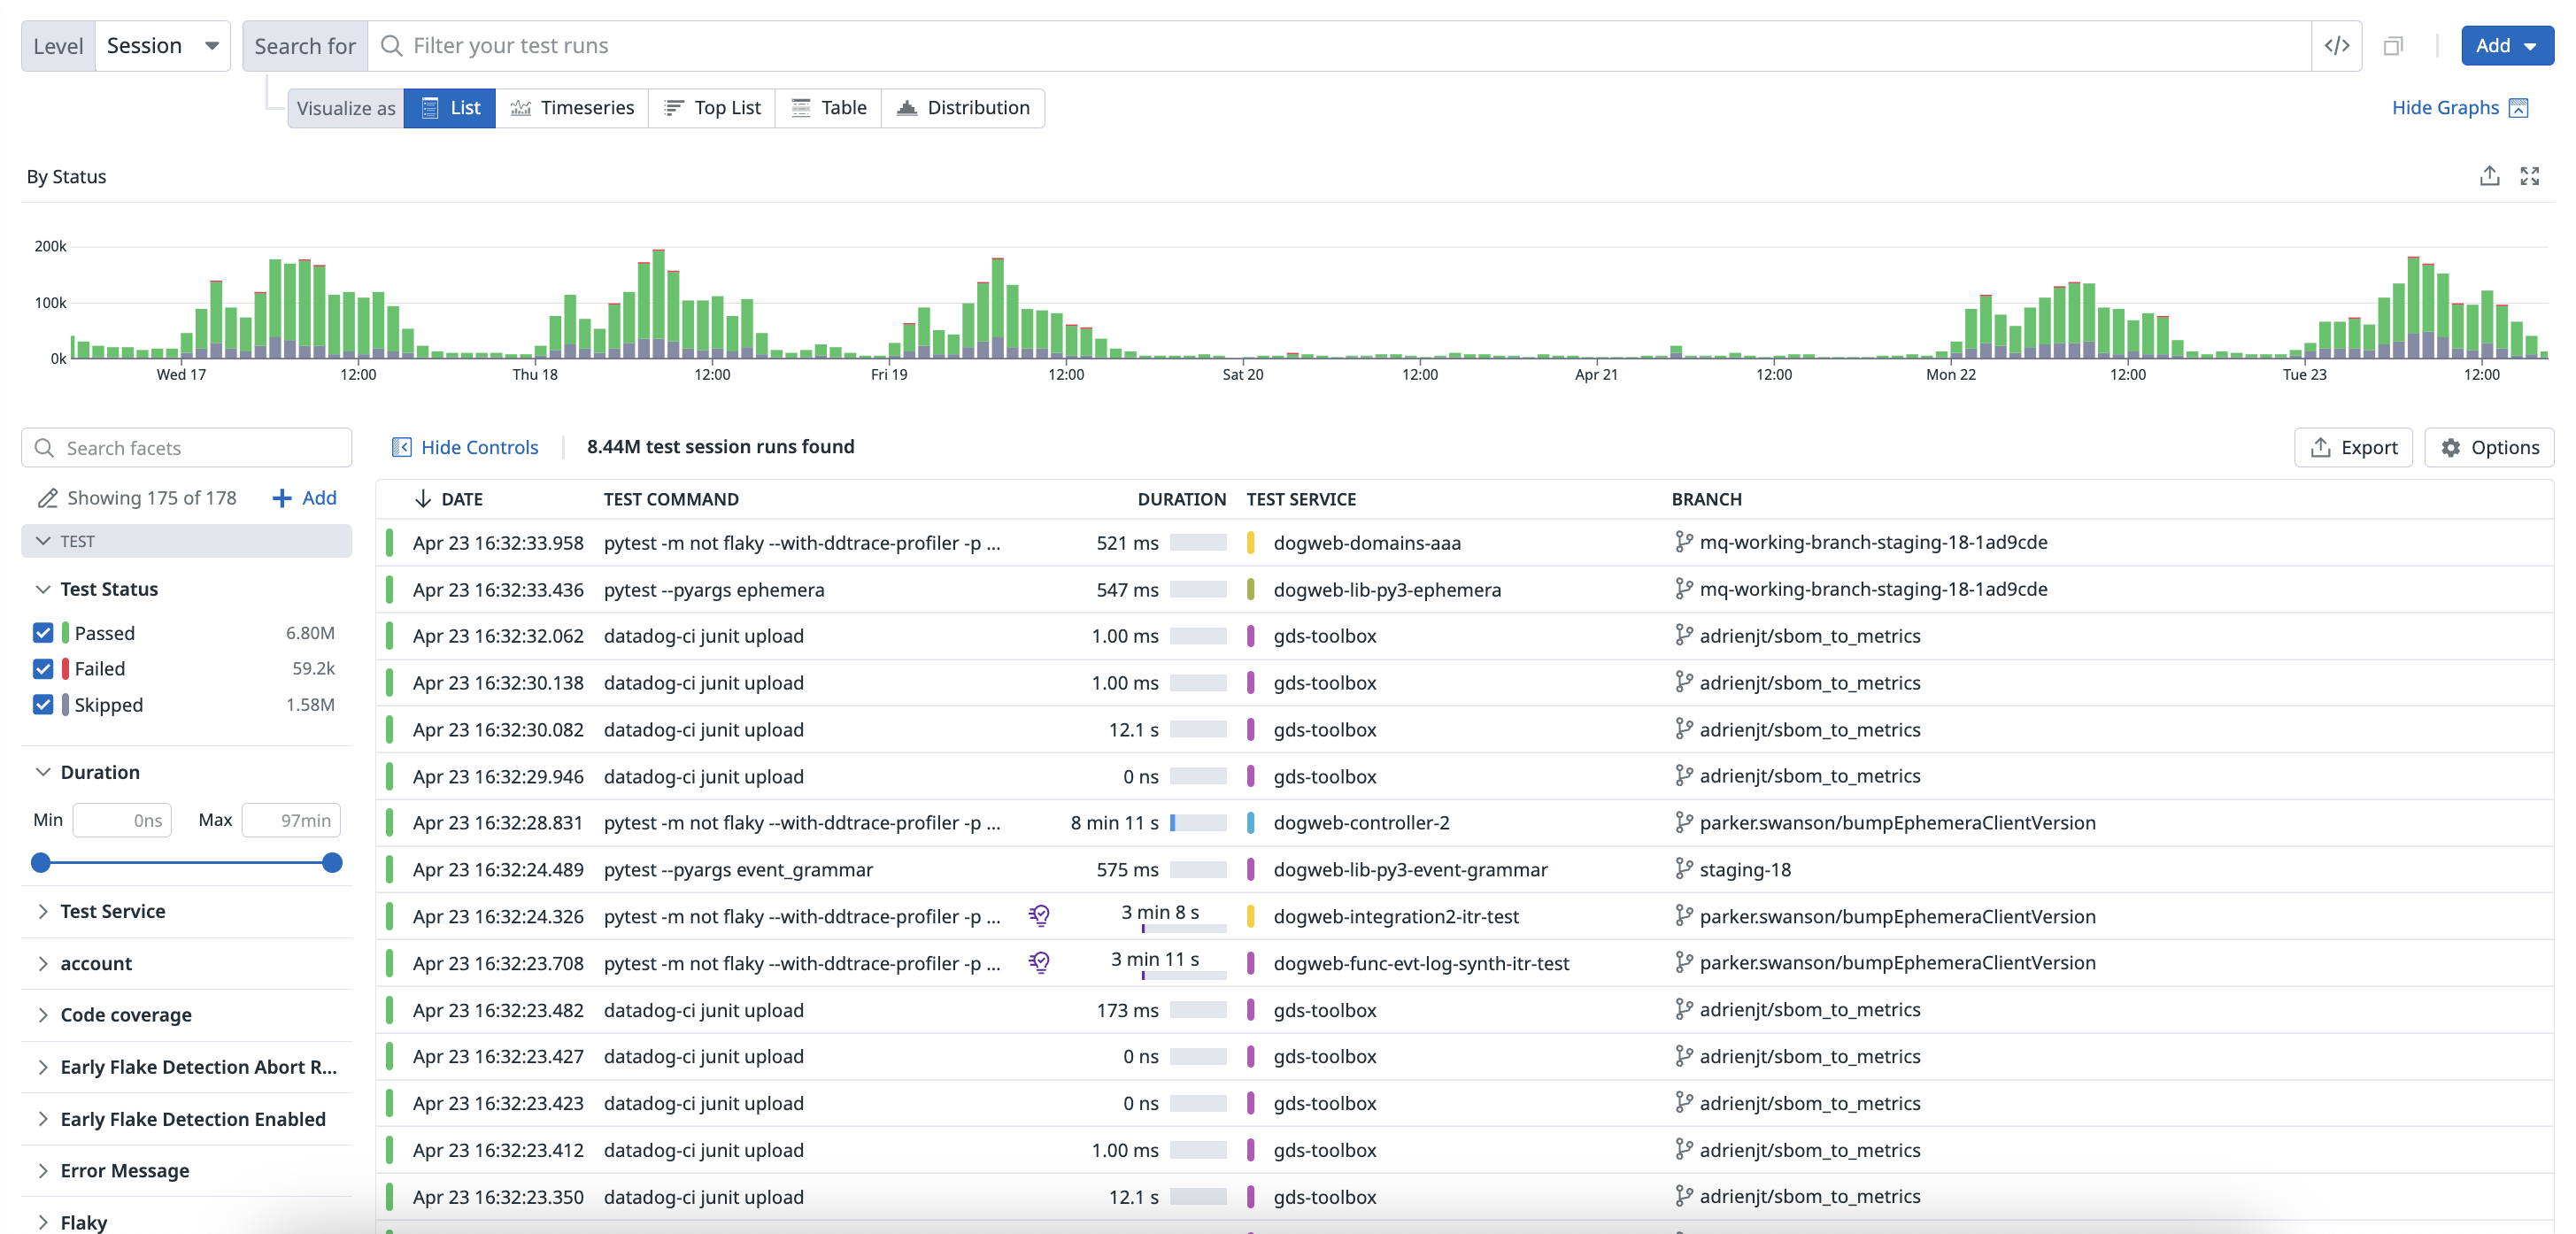
The Test Optimization Explorer allows you to create visualizations and filter test spans using the data collected from your testing. Each test run is reported as a trace, which includes additional spans generated by the test request.
Navigate to Software Delivery > Test Optimization > Test Runs and select Session to start filtering your test session span results.
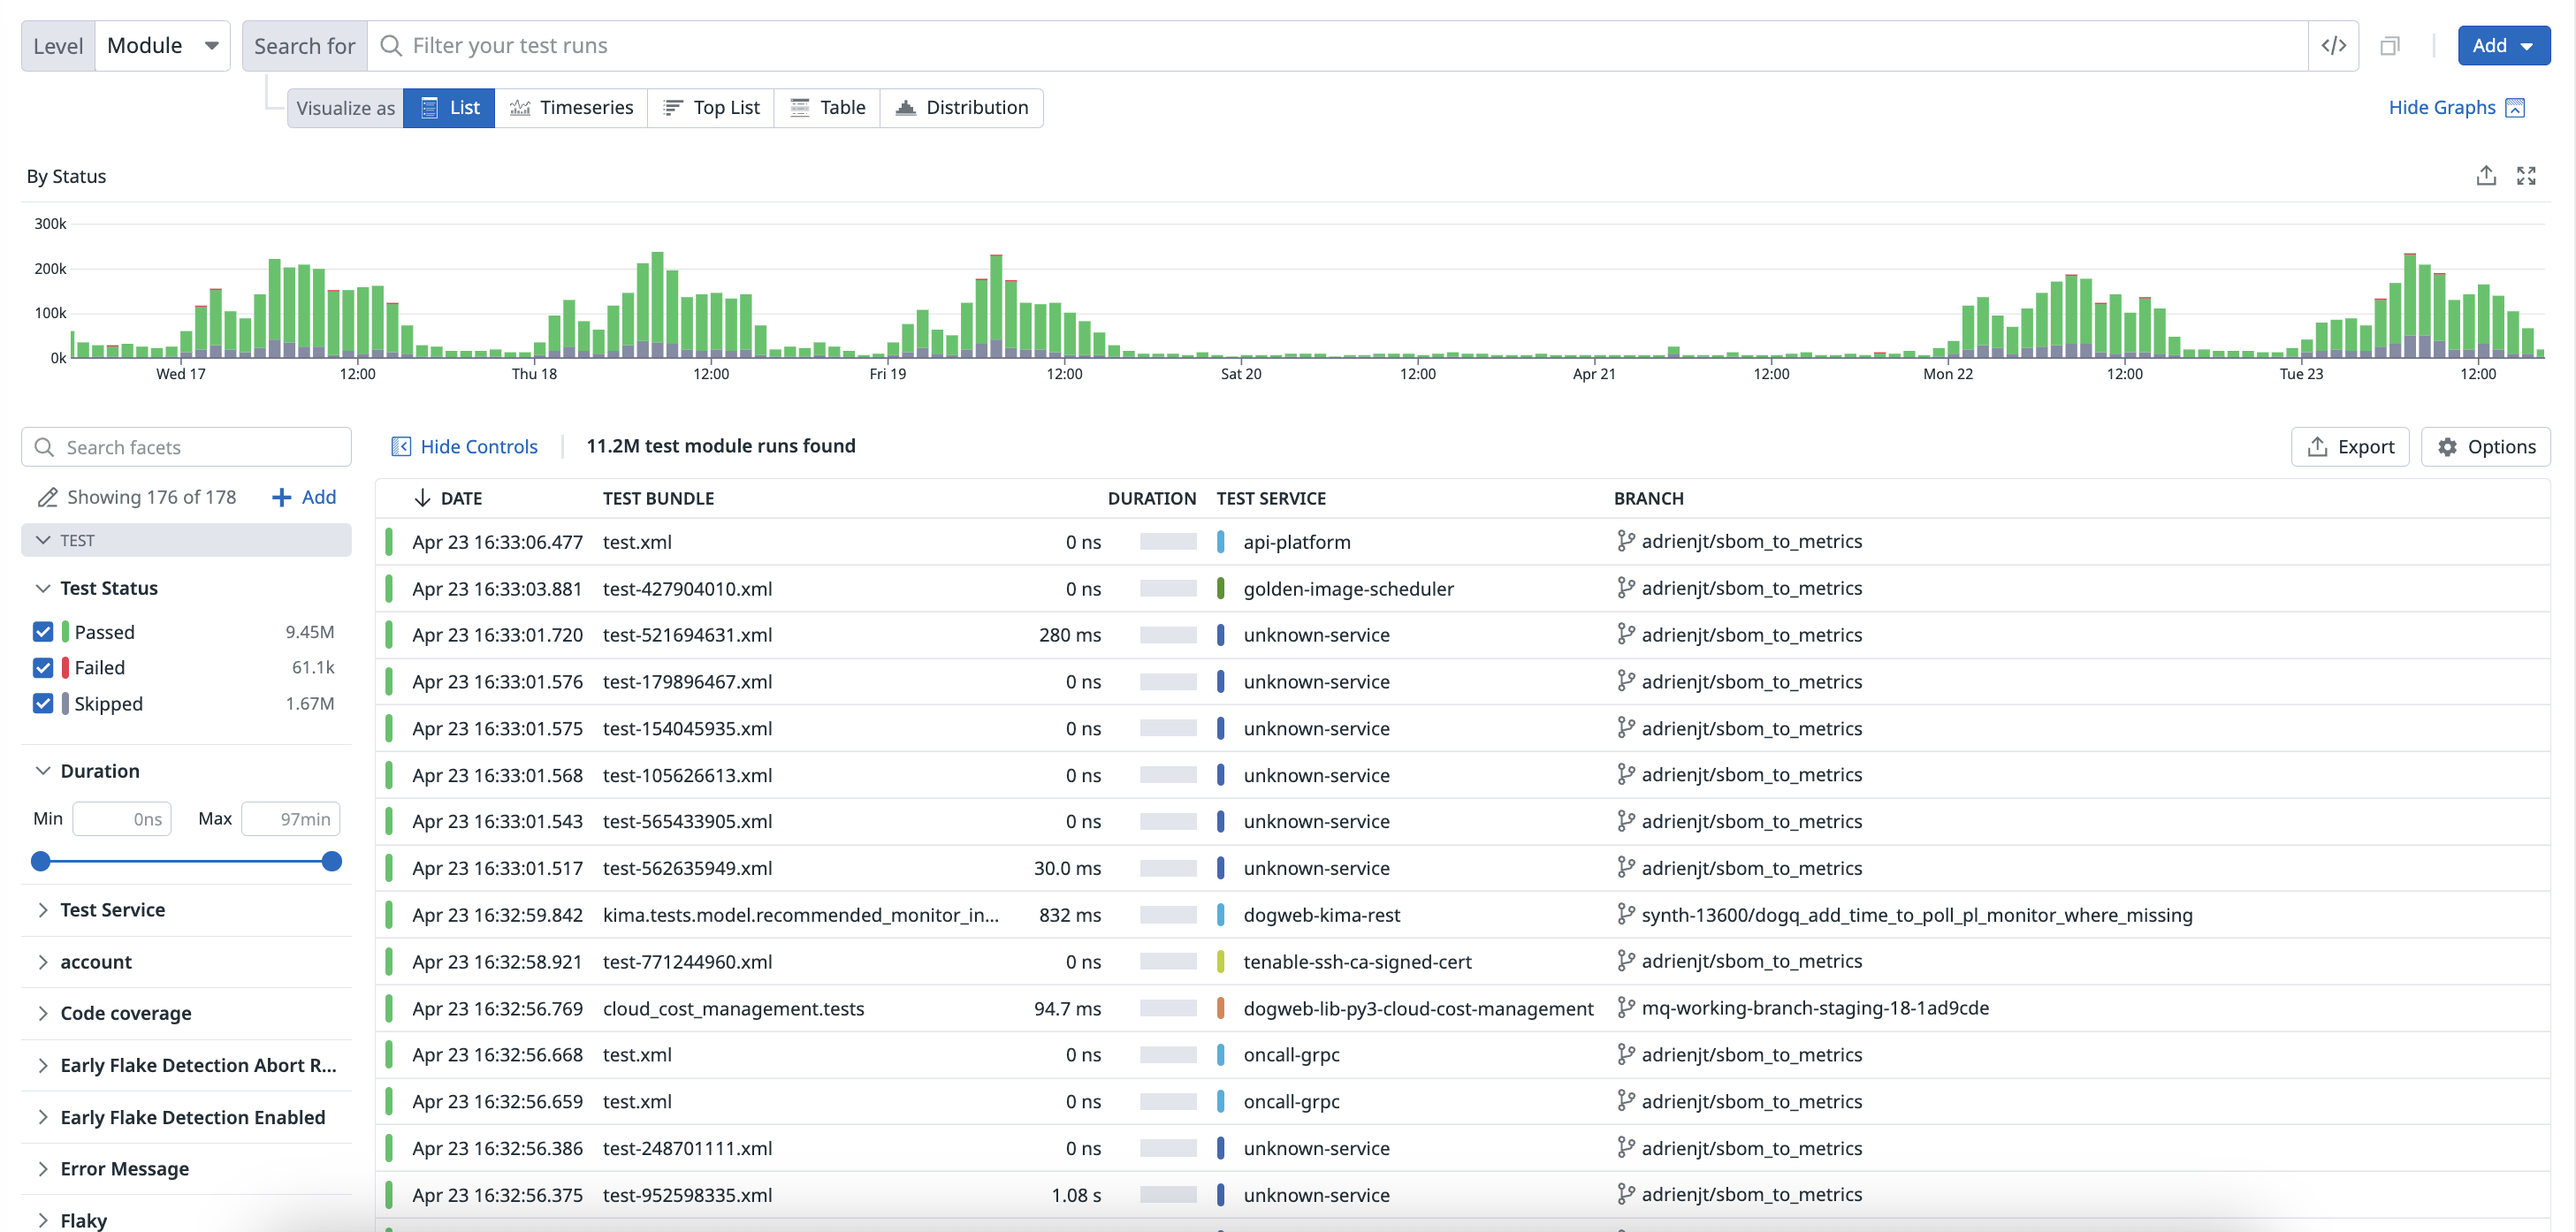
Navigate to Software Delivery > Test Optimization > Test Runs and select Module to start filtering your test module span results.
Navigate to Software Delivery > Test Optimization > Test Runs and select Suite to start filtering your test suite span results.
Navigate to Software Delivery > Test Optimization > Test Runs and select Test to start filtering your test span results.
Use facets to customize the search query and identify changes in time spent on each level of your test run.
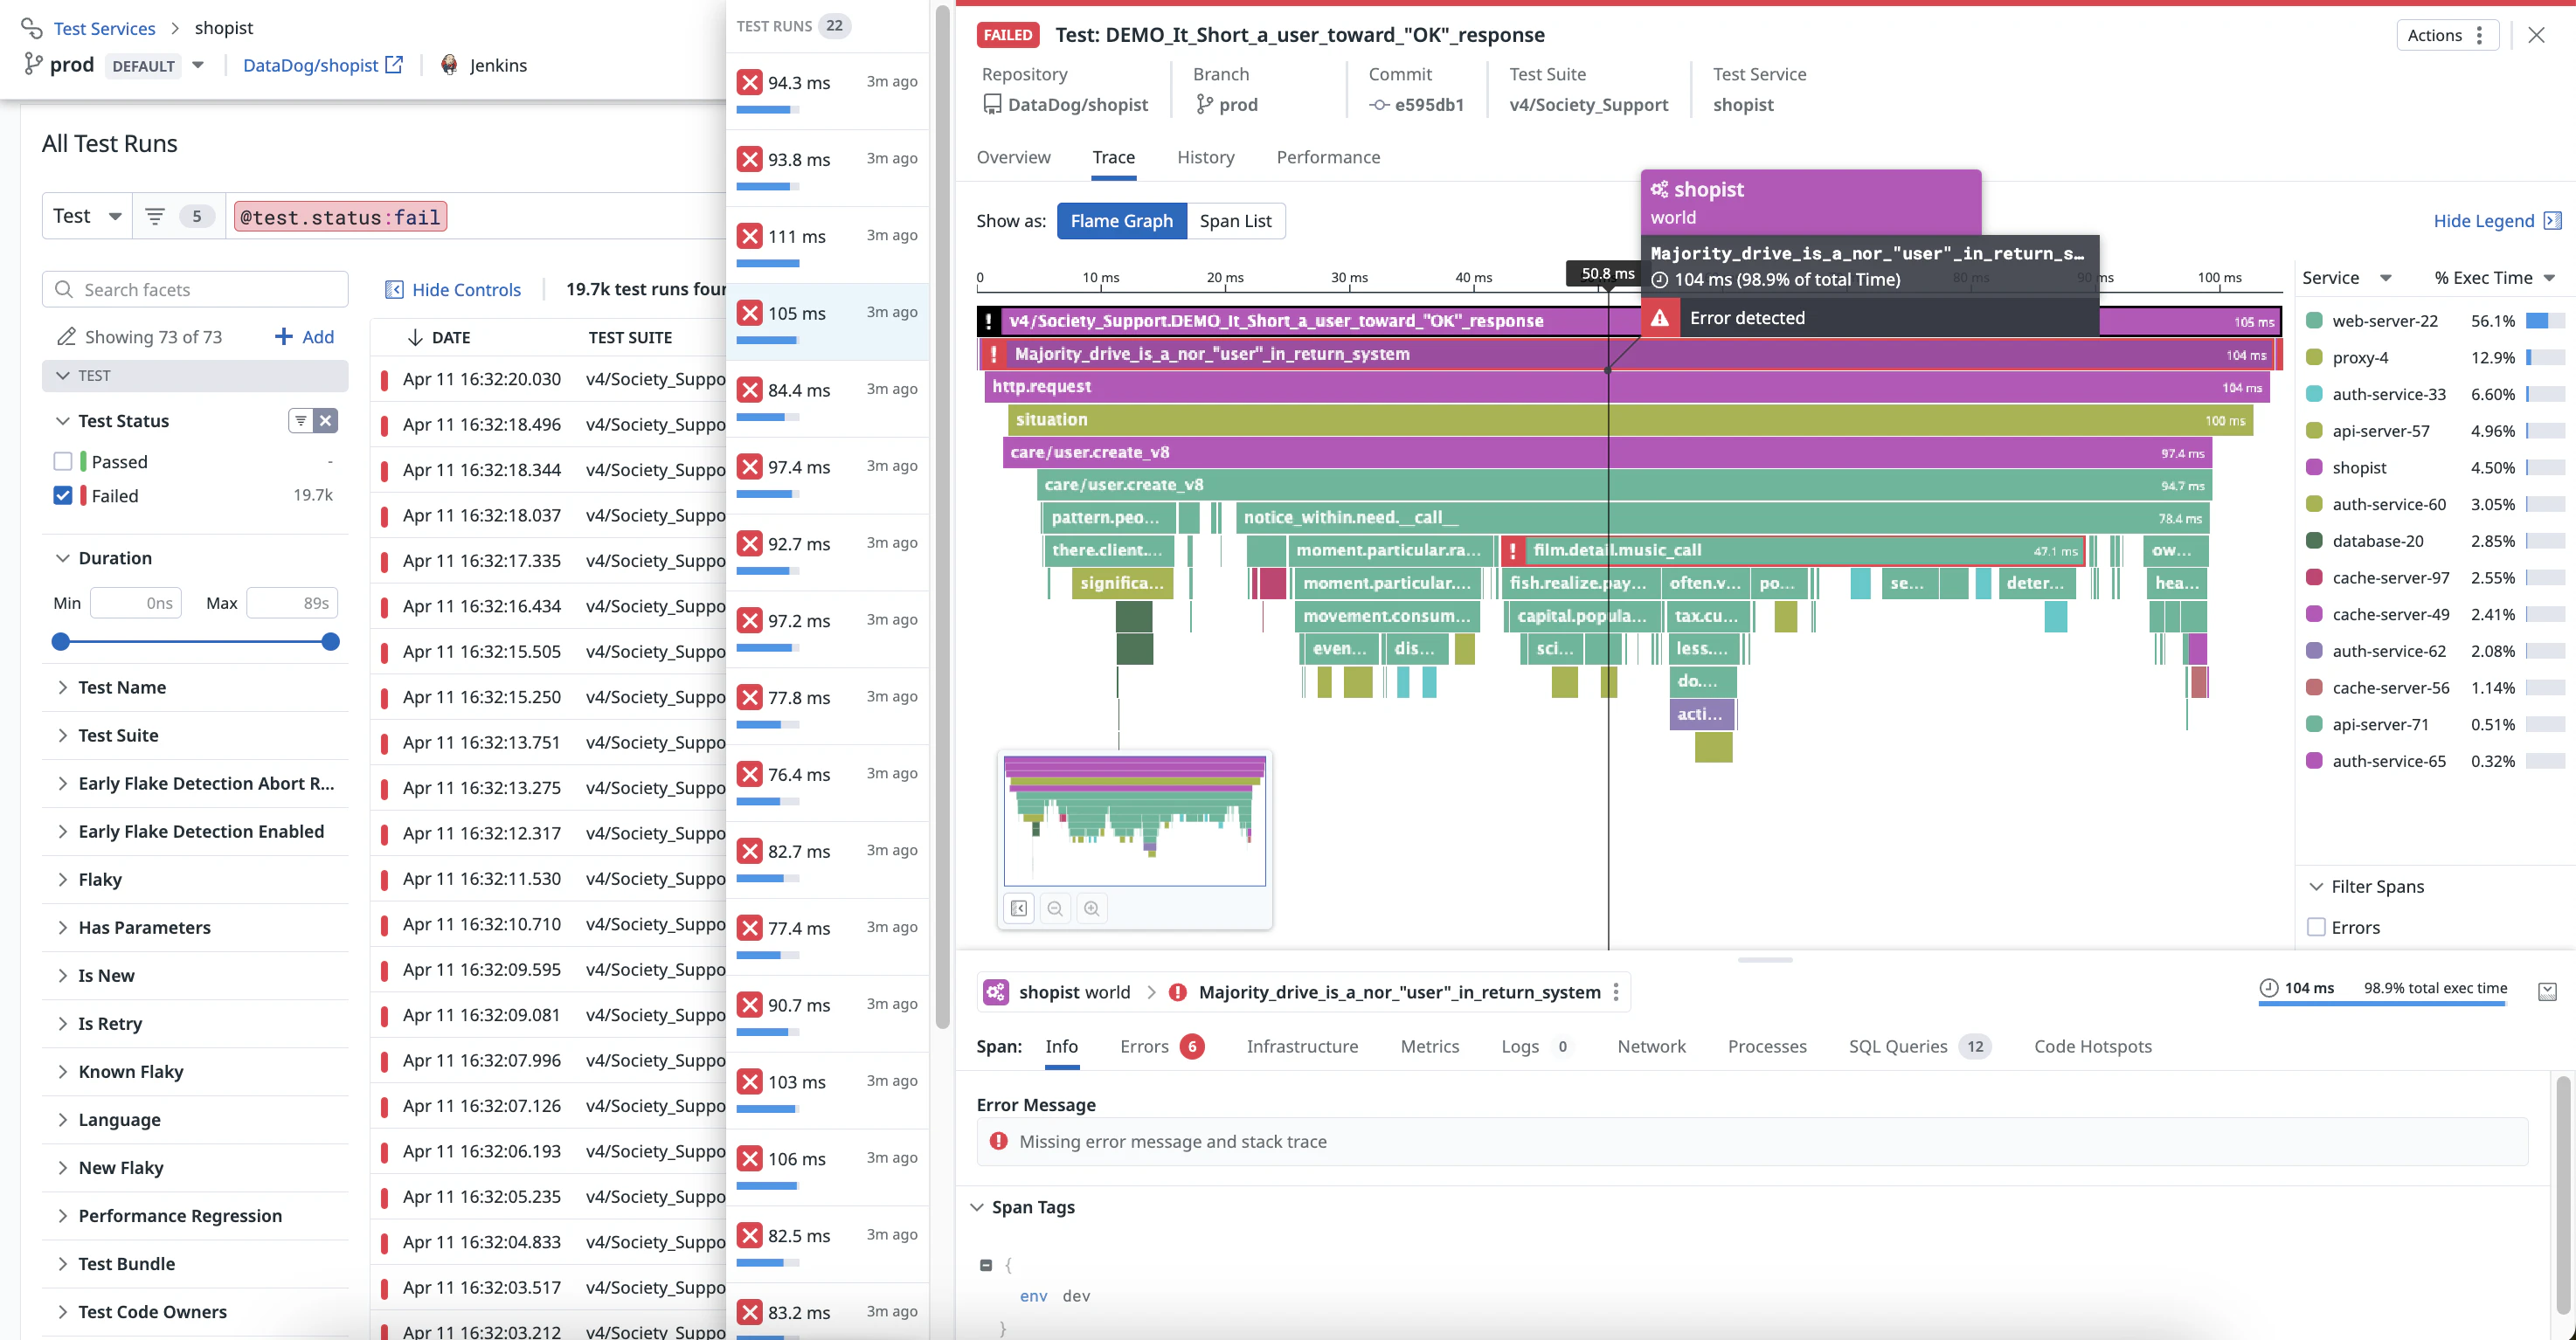
Once you click on a test on the Test List page, you can see a flame graph or a list of spans on the Trace tab.
You can identify bottlenecks in your test runs and examine individual levels ranked from the largest to smallest percentage of execution time.
Add custom measures to tests
You can programmatically search and manage test events using the CI Visibility Tests API endpoint. For more information, see the API documentation.
To enhance the data collected from your CI tests, you can programmatically add tags or measures (like memory usage) directly to the spans created during test execution. For more information, see Add Custom Measures To Your Tests.
Create a CI monitor
Alert relevant teams in your organization about test performance regressions when failures occur or new flaky tests occur.
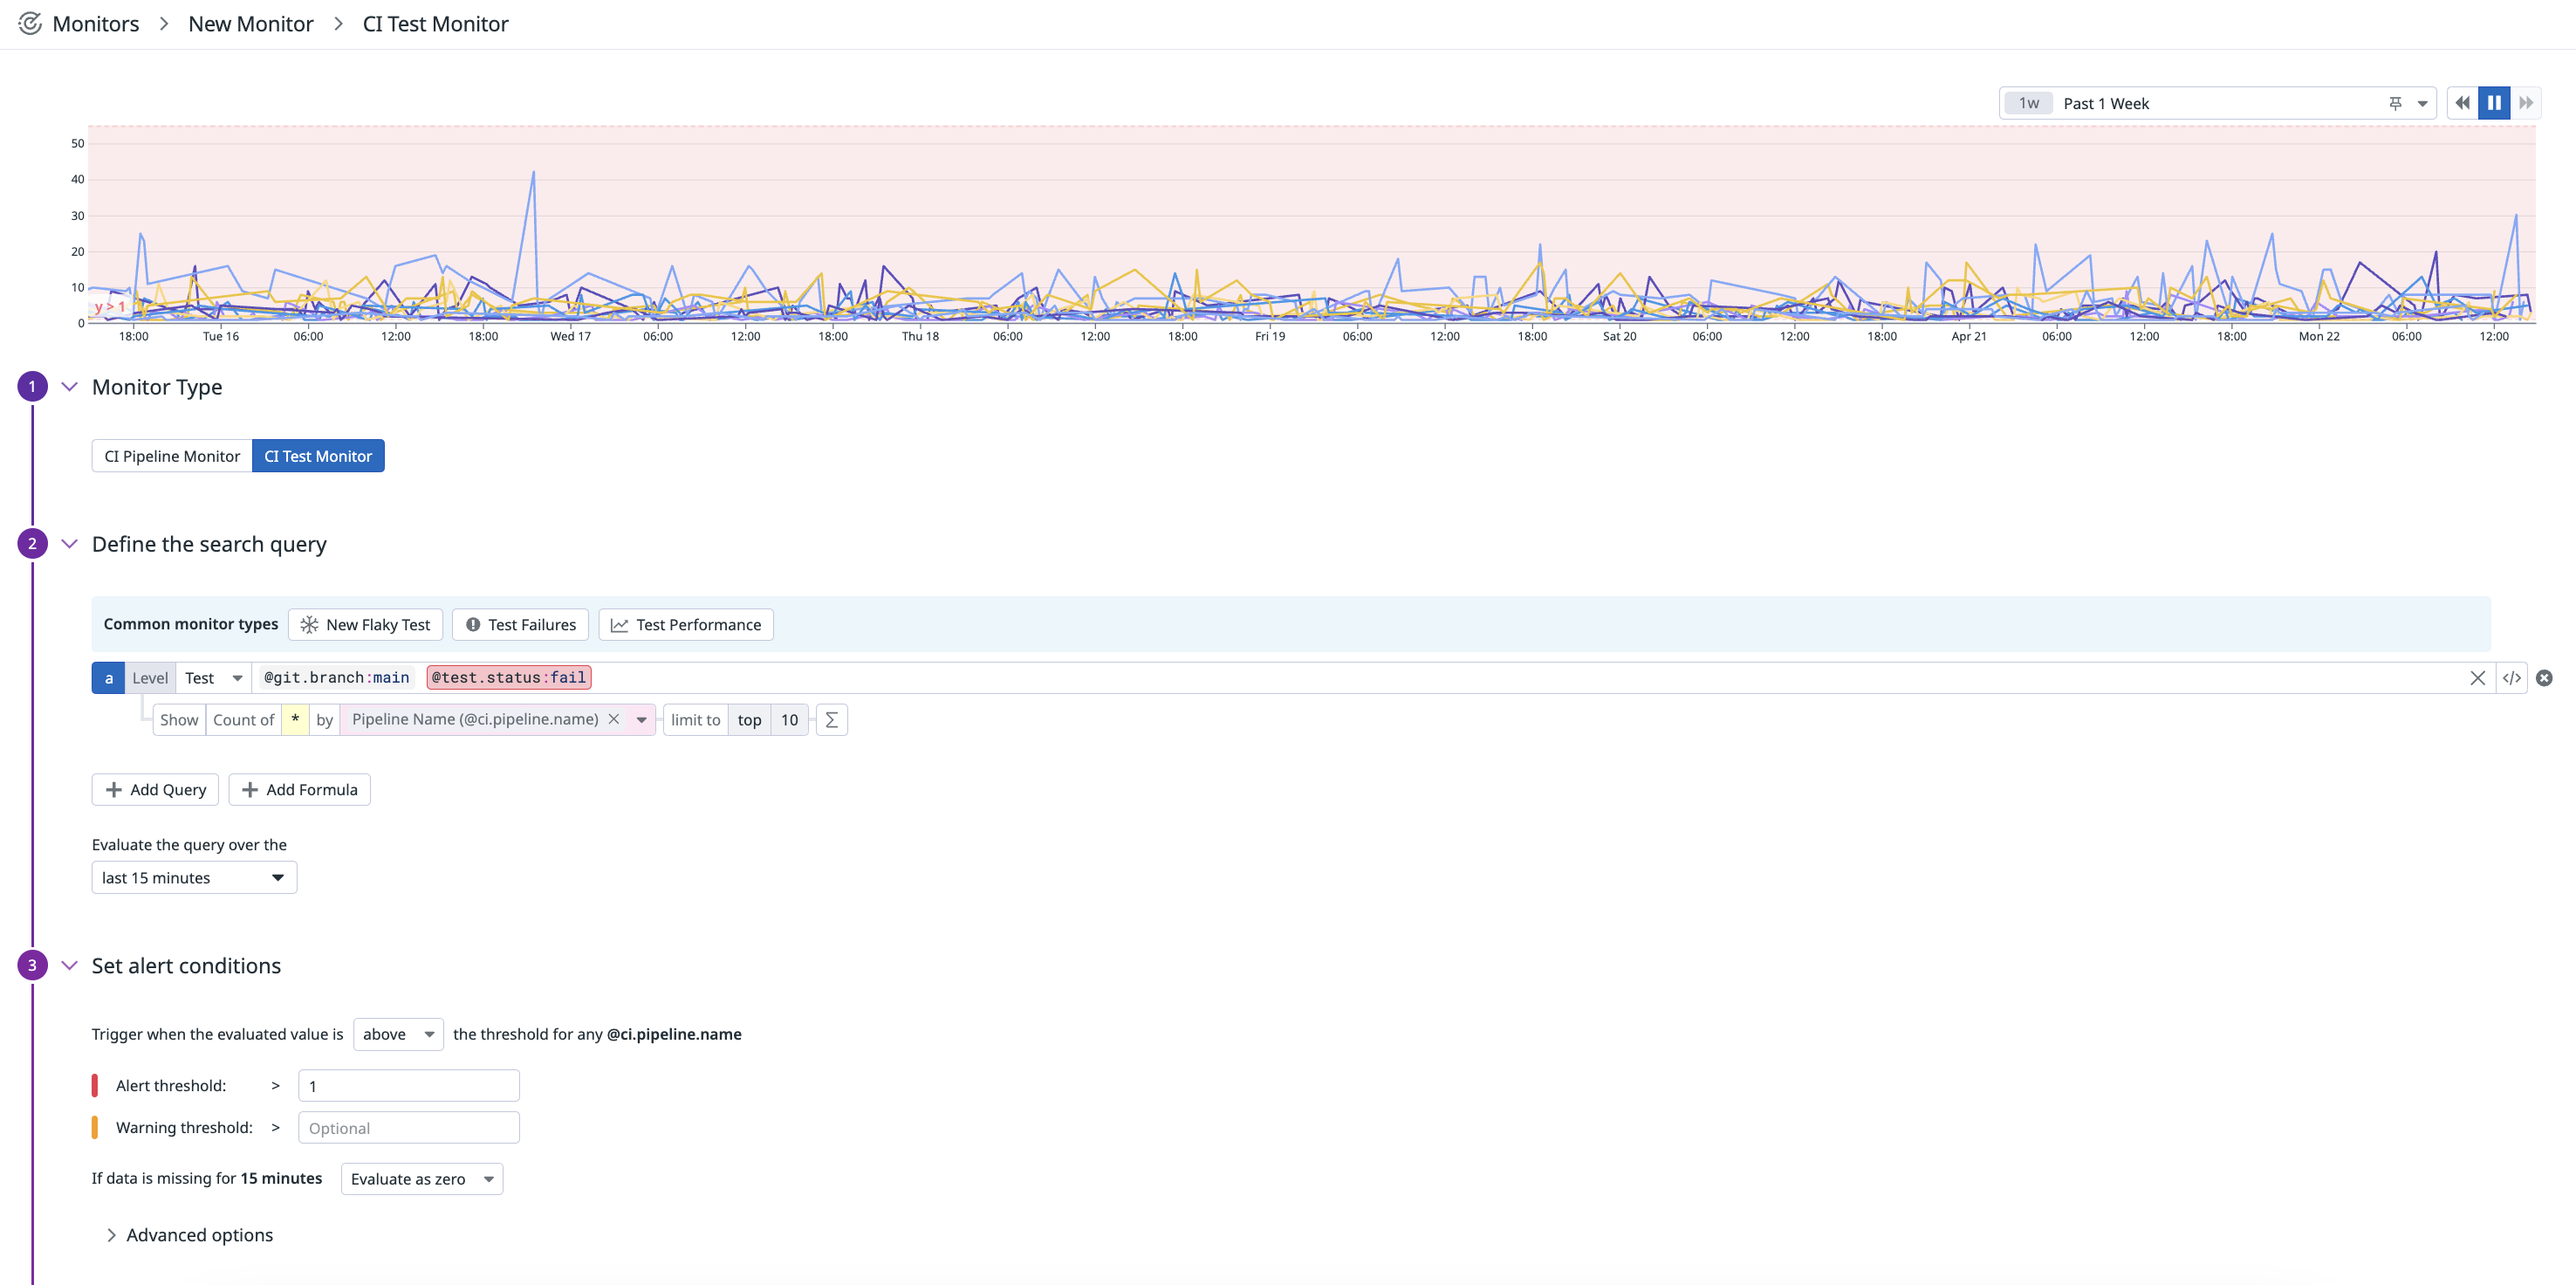
To set up a monitor that alerts when the amount of test failures exceeds a threshold of 1 failure:
- Navigate to Monitors > New Monitor and select CI.
- Select a common monitor type for CI tests to get started, for example:
New Flaky Testto trigger alerts when new flaky tests are added to your code base,Test Failuresto trigger alerts for test failures, orTest Performanceto trigger alerts for test performance regressions, or customize your own search query. In this example, select theBranch (@git.branch)facet to filter your test runs on themainbranch. - In the
Evaluate the query over thesection, select last 15 minutes. - Set the alert conditions to trigger when the evaluated value is above the threshold, and specify values for the alert or warning thresholds, such as
Alert threshold > 1. - Define the monitor notification.
- Set permissions for the monitor.
- Click Create.
For more information, see the CI Monitor documentation.
Further Reading
Additional helpful documentation, links, and articles:
