Use Datadog Log Management, also called logs, to collect logs across multiple logging sources, such as your server, container, cloud environment, application, or existing log processors and forwarders. With conventional logging, you have to choose which logs to analyze and retain to maintain cost-efficiency. With Datadog Logging without Limits*, you can collect, process, archive, explore, and monitor your logs without logging limits.
This page shows you how to get started with Log Management in Datadog. If you haven’t already, create a Datadog account.
Configure a logging source
With Log Management, you can analyze and explore data in the Log Explorer, connect Tracing and Metrics to correlate valuable data across Datadog, and use ingested logs for Datadog Cloud SIEM. The lifecycle of a log within Datadog begins at ingestion from a logging source.
Server
There are several integrations available to forward logs from your server to Datadog. Integrations use a log configuration block in their conf.yaml file, which is available in the conf.d/ folder at the root of your Agent’s configuration directory, to forward logs to Datadog from your server.
If you haven’t already, install the Datadog Agent based on your platform.
Note: Log collection requires Datadog Agent v6+.
Collecting logs is not enabled by default in the Datadog Agent. To enable log collection, set logs_enabled to true in your datadog.yaml file.
datadog.yaml
## @param logs_enabled - boolean - optional - default: false## @env DD_LOGS_ENABLED - boolean - optional - default: false## Enable Datadog Agent log collection by setting logs_enabled to true.logs_enabled:false## @param logs_config - custom object - optional## Enter specific configurations for your Log collection.## Uncomment this parameter and the one below to enable them.## See https://docs.datadoghq.com/agent/logs/logs_config:@param container_collect_all - boolean - optional - default:false@env DD_LOGS_CONFIG_CONTAINER_COLLECT_ALL - boolean - optional - default:falseEnable container log collection for all the containers (see ac_exclude to filter out containers)container_collect_all:false@param logs_dd_url - string - optional@env DD_LOGS_CONFIG_LOGS_DD_URL - string - optionalDefine the endpoint and port to hit when using a proxy for logs.As of agent version 7.70.0, proxy paths are supported. To forward logs to aspecific proxy path, the URL scheme must be specified:https://proxy.example.com:443/logslogs_dd_url:<ENDPOINT>:<PORT>@param logs_no_ssl - boolean - optional - default:false@env DD_LOGS_CONFIG_LOGS_NO_SSL - optional - default:falseDisable the SSL encryption. This parameter should only be used when logs areforwarded locally to a proxy. It is highly recommended to then handle the SSL encryptiononthe proxy side.logs_no_ssl:false@param processing_rules - list of custom objects - optional@env DD_LOGS_CONFIG_PROCESSING_RULES - list of custom objects - optionalGlobal processing rules that are applied to all logs. The available rules are"exclude_at_match","include_at_match"and "mask_sequences". More information in Datadog documentation:https://docs.datadoghq.com/agent/logs/advanced_log_collection/#global-processing-rulesprocessing_rules:- type:<RULE_TYPE>name:<RULE_NAME>pattern:<RULE_PATTERN>@param auto_multi_line_detection - boolean - optional - default:false@env DD_LOGS_CONFIG_AUTO_MULTI_LINE_DETECTION - boolean - optional - default:falseEnable automatic aggregation of multi-line logs for common log patterns.More information can be found in Datadog documentation:https://docs.datadoghq.com/agent/logs/auto_multiline_detection/?tab=configurationfileauto_multi_line_detection:true@param force_use_http - boolean - optional - default:false@env DD_LOGS_CONFIG_FORCE_USE_HTTP - boolean - optional - default:falseSet this parameter to `true` to always send logs via HTTP(S) protocol and never fall back toraw TCP forwarding (recommended).#By default, the Agent sends logs in HTTPS batches if HTTPS connectivity canbe established at Agent startup, and falls back to TCP otherwise. This parametercan be used to override this fallback behavior. It is recommended, but not the default, tomaintain compatibility with previous Agent versions.#Note, the logs are forwarded via HTTPS (encrypted) by default. Please use `logs_no_ssl` if youneed unencrypted HTTP instead.force_use_http:true@param http_protocol - string - optional - default:auto@env DD_LOGS_CONFIG_HTTP_PROTOCOL - string - optional - default:autoThe transport type to use for sending logs. Possible values are "auto" or "http1".http_protocol:auto@param http_timeout - integer - optional - default:10@env DD_LOGS_CONFIG_HTTP_TIMEOUT - integer - optional - default:10The HTTP timeout to use for sending logs, in seconds.http_timeout:10@param force_use_tcp - boolean - optional - default:false@env DD_LOGS_CONFIG_FORCE_USE_TCP - boolean - optional - default:falseBy default, logs are sent via HTTP protocol if possible, set this parameterto `true` to always send logs via TCP. If `force_use_http` is set to `true`, this parameteris ignored.force_use_tcp:true@param use_compression - boolean - optional - default:true@env DD_LOGS_CONFIG_USE_COMPRESSION - boolean - optional - default:trueThis parameter is available when sending logs via HTTP protocol. If enabled, the Agentcompresses logs before sending them.use_compression:true@param compression_level - integer - optional - default:6@env DD_LOGS_CONFIG_COMPRESSION_LEVEL - boolean - optional - default:falseThe compression_level parameter accepts values from 0 (no compression)to 9 (maximum compression but higher resource usage). Only takes effect if`use_compression` is set to `true`.compression_level:6@param batch_wait - integer - optional - default:5@env DD_LOGS_CONFIG_BATCH_WAIT - integer - optional - default:5The maximum time (in seconds) the Datadog Agent waits to fill each batch of logs before sending.batch_wait:5@param close_timeout - integer - optional - default:60@env DD_LOGS_CONFIG_CLOSE_TIMEOUT - integer - optional - default:60The maximum number of seconds the Agent spends reading from a file after it has been rotated.close_timeout:60@param open_files_limit - integer - optional - default:500@env DD_LOGS_CONFIG_OPEN_FILES_LIMIT - integer - optional - default:500The maximum number of files that can be tailed in parallel.Note:the default for Mac OS is 200. The default forall other systems is 500.open_files_limit:500@param file_wildcard_selection_mode - string - optional - default:`by_name`@env DD_LOGS_CONFIG_FILE_WILDCARD_SELECTION_MODE - string - optional - default:`by_name`The strategy used to prioritize wildcard matches if they exceed the open file limit.#Choices are `by_name` and `by_modification_time`.#`by_name` means that each log source is considered and the matching files are orderedin reverse name order. While there are less than `logs_config.open_files_limit` filesbeing tailed, this process repeats, collecting from each configured source.#`by_modification_time` takes all log sources and first adds any log sources thatpoint to a specific file. Next, it finds matches for all wildcard sources.This resulting list is ordered by which files have been most recently modifiedand the top `logs_config.open_files_limit` most recently modified files arechosen for tailing.#WARNING:`by_modification_time` is less performant than `by_name` and will triggermore disk I/O at the configured wildcard log paths.file_wildcard_selection_mode:by_name@param max_message_size_bytes - integer - optional - default:900000@env DD_LOGS_CONFIG_MAX_MESSAGE_SIZE_BYTES - integer - optional - default :900000The maximum size of single log message in bytes. Lines that are longerthan this limit are split into multiple line where each long line that issplit has `...TRUNCATED...` added as a suffix and each line that was createdfrom a split of a previous line has `...TRUNCATED...` added as a prefix.#Note:Datadog's ingest API truncates any logs greater than 1 MB by discarding theremainder. See https://docs.datadoghq.com/api/latest/logs/ for details.max_message_size_bytes:900000@param integrations_logs_files_max_size - integer - optional - default:10@env DD_LOGS_CONFIG_INTEGRATIONS_LOGS_FILES_MAX_SIZE - integer - optional - default:10The max size in MB that an integration logs file is allowed to useintegrations_logs_files_max_size:10@param integrations_logs_total_usage - integer - optional - default:100@env DD_LOGS_CONFIG_INTEGRATIONS_LOGS_TOTAL_USAGE - integer - optional - default:100The total combined usage all integrations logs files can useintegrations_logs_total_usage:100@param k8s_container_use_kubelet_api - boolean - optional - default:false@env DD_LOGS_CONFIG_K8S_CONTAINER_USE_KUBELET_API - boolean - optional - default:falseEnable container log collection via the kubelet API, typically used for EKS Fargatek8s_container_use_kubelet_api:false@param streaming - custom object - optionalThis section allows you to configure streaming logs via remote config.streaming:@param streamlogs_log_file - string - optional@env DD_LOGS_CONFIG_STREAMING_STREAMLOGS_LOG_FILE - string - optionalPath to the file containing the streamlogs log file.Default paths:* Windows:c:\\programdata\\datadog\\logs\\streamlogs_info\\streamlogs.log* Unix:/opt/log/datadog/streamlogs_info/streamlogs.log* Linux:/var/log/datadog/streamlogs_info/streamlogs.logstreamlogs_log_file:<path_to_streamlogs_log_file>
Follow the integration activation steps or the custom files log collection steps on the Datadog site.
Note: If you’re collecting logs from custom files and need examples for tail files, TCP/UDP, journald, or Windows Events, see Custom log collection.
Container
As of Datadog Agent v6, the Agent can collect logs from containers. Each containerization service has specific configuration instructions based where the Agent is deployed or run, or how logs are routed.
For example, Docker has two different types of Agent installation available: on your host, where the Agent is external to the Docker environment, or deploying a containerized version of the Agent in your Docker environment.
Kubernetes requires that the Datadog Agent run in your Kubernetes cluster, and log collection can be configured using a DaemonSet spec, Helm chart, or with the Datadog Operator.
To begin collecting logs from a container service, follow the in-app instructions.
Cloud
You can forward logs from multiple cloud providers, such as AWS, Azure, and Google Cloud, to Datadog. Each cloud provider has its own set of configuration instructions.
For example, AWS service logs are usually stored in S3 buckets or CloudWatch Log groups. You can subscribe to these logs and forward them to an Amazon Kinesis stream to then forward them to one or multiple destinations. Datadog is one of the default destinations for Amazon Kinesis Delivery streams.
To begin collecting logs from a cloud service, follow the in-app instructions.
Client
Datadog permits log collection from clients through SDKs or libraries. For example, use the datadog-logs SDK to send logs to Datadog from JavaScript clients.
If you’re using existing logging services or utilities such as rsyslog, Fluentd, or Logstash, Datadog offers plugins and log forwarding options.
If you don’t see your integration, you can type it in the other integrations box and get notifications for when the integration is available.
To begin collecting logs from a cloud service, follow the in-app instructions.
Explore your logs
Once a logging source is configured, your logs are available in the Log Explorer. This is where you can filter, aggregate, and visualize your logs.
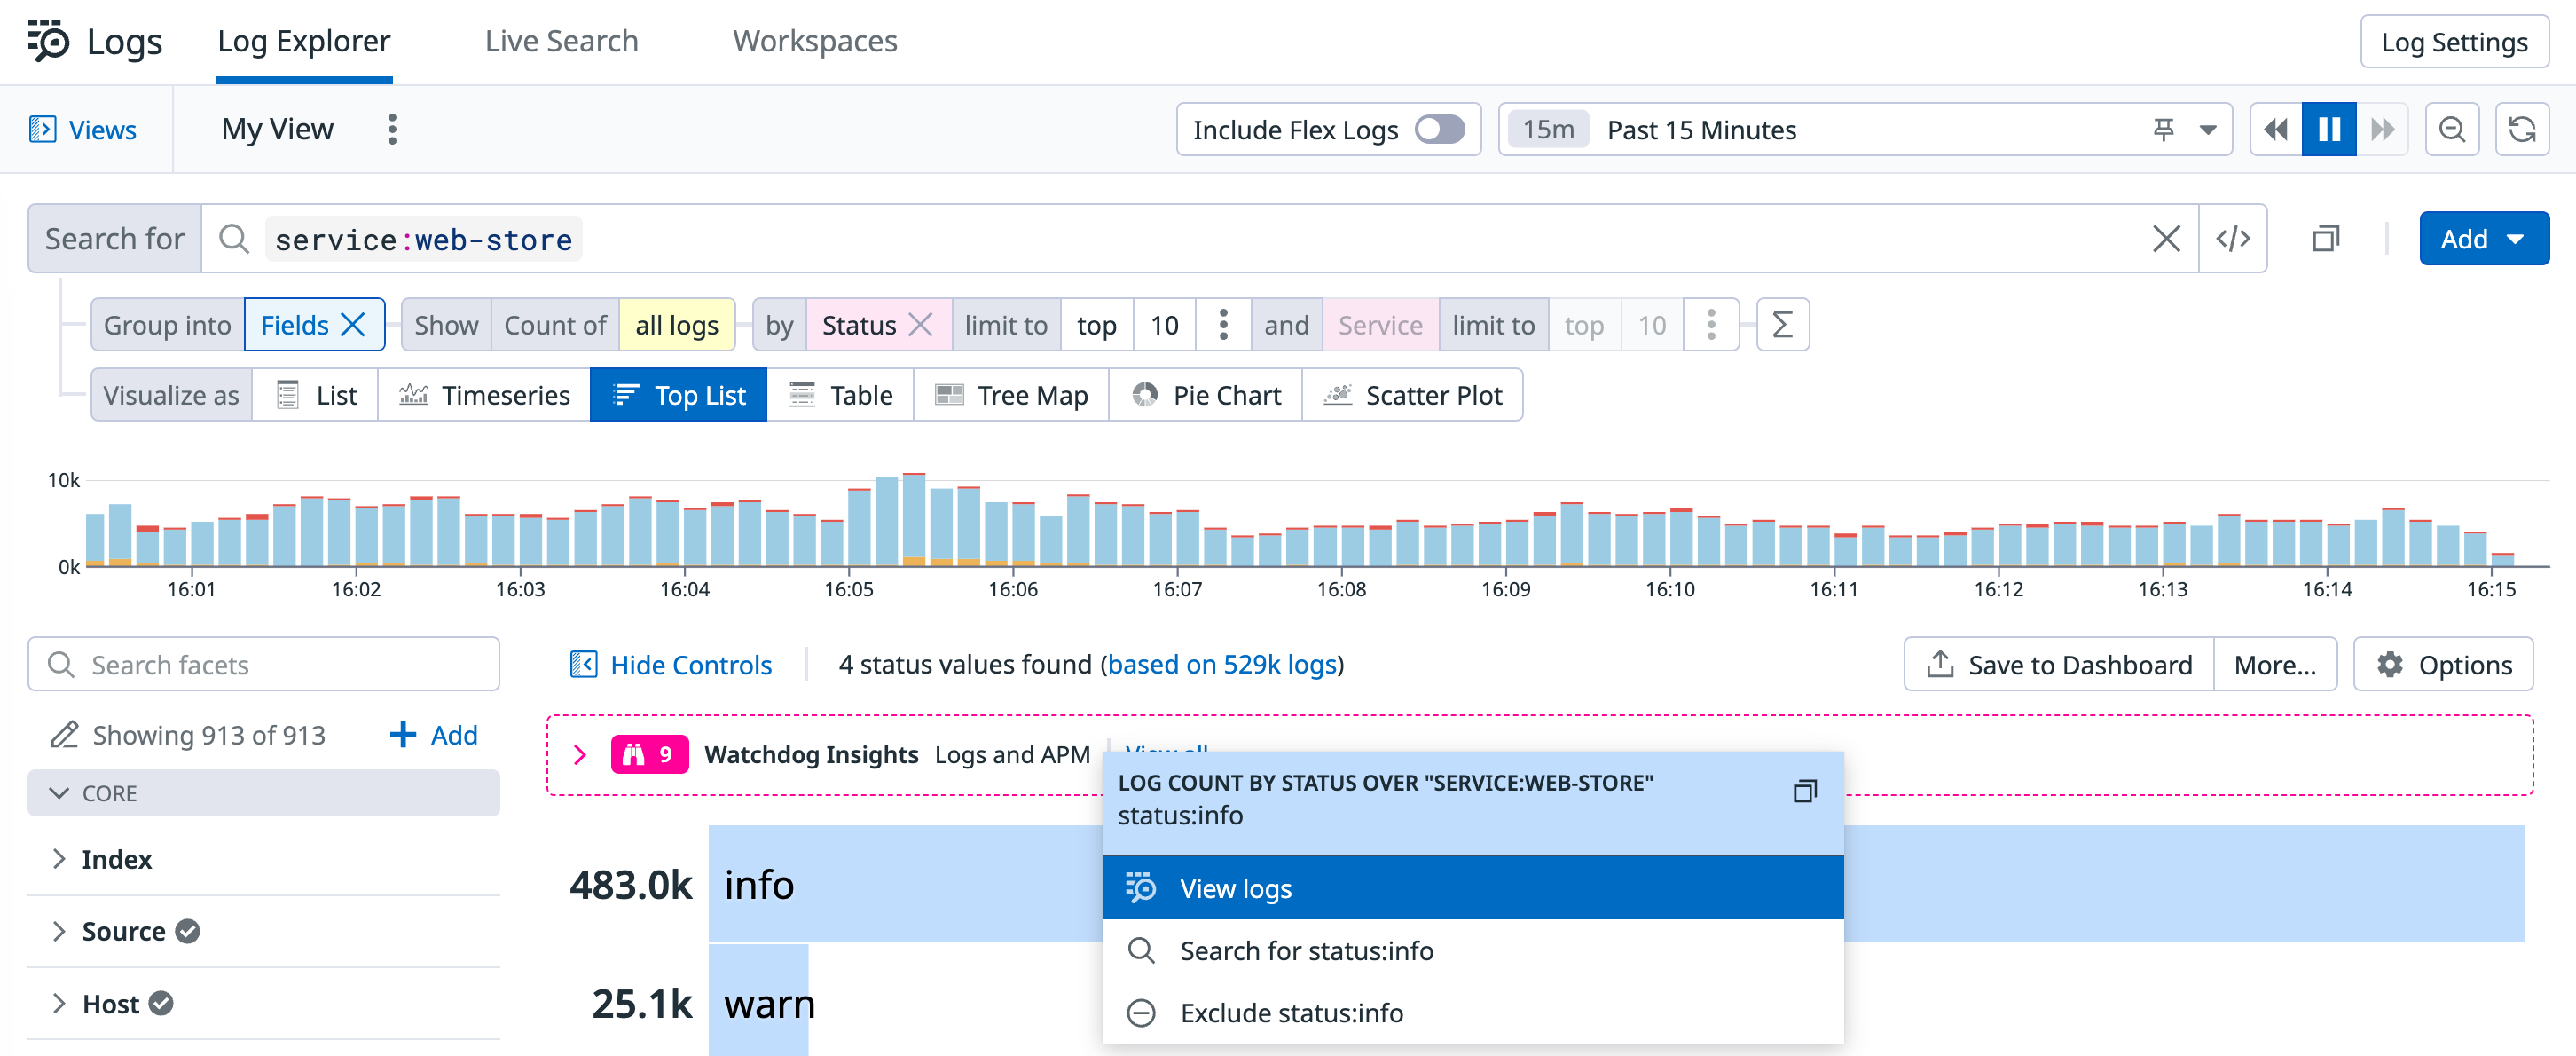
For example, if you have logs flowing in from a service that you wish to examine further, filter by service. You can further filter by status, such as ERROR, and select Group into Patterns to see which part of your service is logging the most errors.
Aggregate your logs into Fields and visualize as Top List to see your top logging services. Select a source, such as info or warn, and select View Logs from the dropdown menu. The side panel populates logs based on error, so you quickly see which host and services require attention.
The Log Explorer offers the following features for log troubleshooting and exploration: