- Essentials
- Getting Started
- Agent
- API
- APM Tracing
- Containers
- Dashboards
- Database Monitoring
- Datadog
- Datadog Site
- DevSecOps
- Incident Management
- Integrations
- Internal Developer Portal
- Logs
- Monitors
- OpenTelemetry
- Profiler
- Session Replay
- Security
- Serverless for AWS Lambda
- Software Delivery
- Synthetic Monitoring and Testing
- Tags
- Workflow Automation
- Learning Center
- Support
- Glossary
- Standard Attributes
- Guides
- Agent
- Integrations
- Developers
- Authorization
- DogStatsD
- Custom Checks
- Integrations
- Create an Agent-based Integration
- Create an API Integration
- Create a Log Pipeline
- Integration Assets Reference
- Build a Marketplace Offering
- Create a Tile
- Create an Integration Dashboard
- Create a Monitor Template
- Create a Cloud SIEM Detection Rule
- OAuth for Integrations
- Install Agent Integration Developer Tool
- Service Checks
- IDE Plugins
- Community
- Guides
- OpenTelemetry
- Administrator's Guide
- API
- Partners
- Datadog Mobile App
- DDSQL Reference
- CoScreen
- CoTerm
- Cloudcraft (Standalone)
- In The App
- Dashboards
- Notebooks
- DDSQL Editor
- Reference Tables
- Sheets
- Monitors and Alerting
- Metrics
- Watchdog
- Bits AI
- Internal Developer Portal
- Error Tracking
- Change Tracking
- Service Management
- Actions & Remediations
- Infrastructure
- Cloudcraft
- Resource Catalog
- Universal Service Monitoring
- Hosts
- Containers
- Processes
- Serverless
- Network Monitoring
- Cloud Cost
- Application Performance
- APM
- APM Terms and Concepts
- Application Instrumentation
- APM Metrics Collection
- Trace Pipeline Configuration
- Correlate Traces with Other Telemetry
- Trace Explorer
- Recommendations
- Code Origins for Spans
- Service Observability
- Endpoint Observability
- Dynamic Instrumentation
- Live Debugger
- Error Tracking
- Data Security
- Guides
- Troubleshooting
- Continuous Profiler
- Database Monitoring
- Agent Integration Overhead
- Setup Architectures
- Setting Up Postgres
- Setting Up MySQL
- Setting Up SQL Server
- Setting Up Oracle
- Setting Up Amazon DocumentDB
- Setting Up MongoDB
- Connecting DBM and Traces
- Data Collected
- Exploring Database Hosts
- Exploring Query Metrics
- Exploring Query Samples
- Exploring Database Schemas
- Exploring Recommendations
- Troubleshooting
- Guides
- Data Streams Monitoring
- Data Jobs Monitoring
- Data Observability
- Digital Experience
- Real User Monitoring
- Synthetic Testing and Monitoring
- Continuous Testing
- Product Analytics
- Software Delivery
- CI Visibility
- CD Visibility
- Deployment Gates
- Test Optimization
- Quality Gates
- DORA Metrics
- Security
- Security Overview
- Cloud SIEM
- Code Security
- Cloud Security
- App and API Protection
- Workload Protection
- Sensitive Data Scanner
- AI Observability
- Log Management
- Observability Pipelines
- Log Management
- Administration
Getting Started with CI Visibility
This product is not supported for your selected Datadog site. ().
Overview
CI Visibility, or CI Pipeline Visibility, allows you to monitor the health of your CI pipelines and visualize the performance of your pipeline executions as traces, where spans represent the different levels of the pipeline.
You can forward CI job logs and automatically correlate them with your pipelines in CI Visibility. Depending on the providers you are using, you can either enable job log collection on the Settings page in CI Visibility or in your provider’s settings to integrate with Datadog.
You can also use the datadog-ci CLI to trace commands in your pipelines, as well as the custom tags and measures commands to add user-defined text and numerical tags in your pipeline traces.
CI Visibility provides DevOps and platform engineering organizations with comprehensive monitoring, analytics, and the ability to pinpoint and resolve bottlenecks, optimize resource allocation, and decrease CI costs.
By integrating performance metrics, logs, and alerts, organizations can improve development speed, increase the reliability of their pipelines, and make data-informed decisions across cloud and self-hosted environments.
Set up your CI provider
CI Visibility tracks the performance and results of your CI pipelines, and displays results after the pipeline finishes.
To start sending pipeline metrics, see the documentation for one of the following CI providers that Datadog supports below.
If your CI provider is not supported, you can programmatically send your pipeline events to Datadog. See the Send pipeline events to Datadog section.
Depending on the CI provider(s) of choice, CI Visibility may not support all of the levels in your pipeline (stage, job, step, or command). For more information about how CI Visibility defines a CI pipeline, see the Terminology section.
Use CI pipeline data
Access your pipelines’ metrics (such as queue times, durations, percentiles, and statuses) to start identifying important trends and patterns using the data collected across your CI providers.
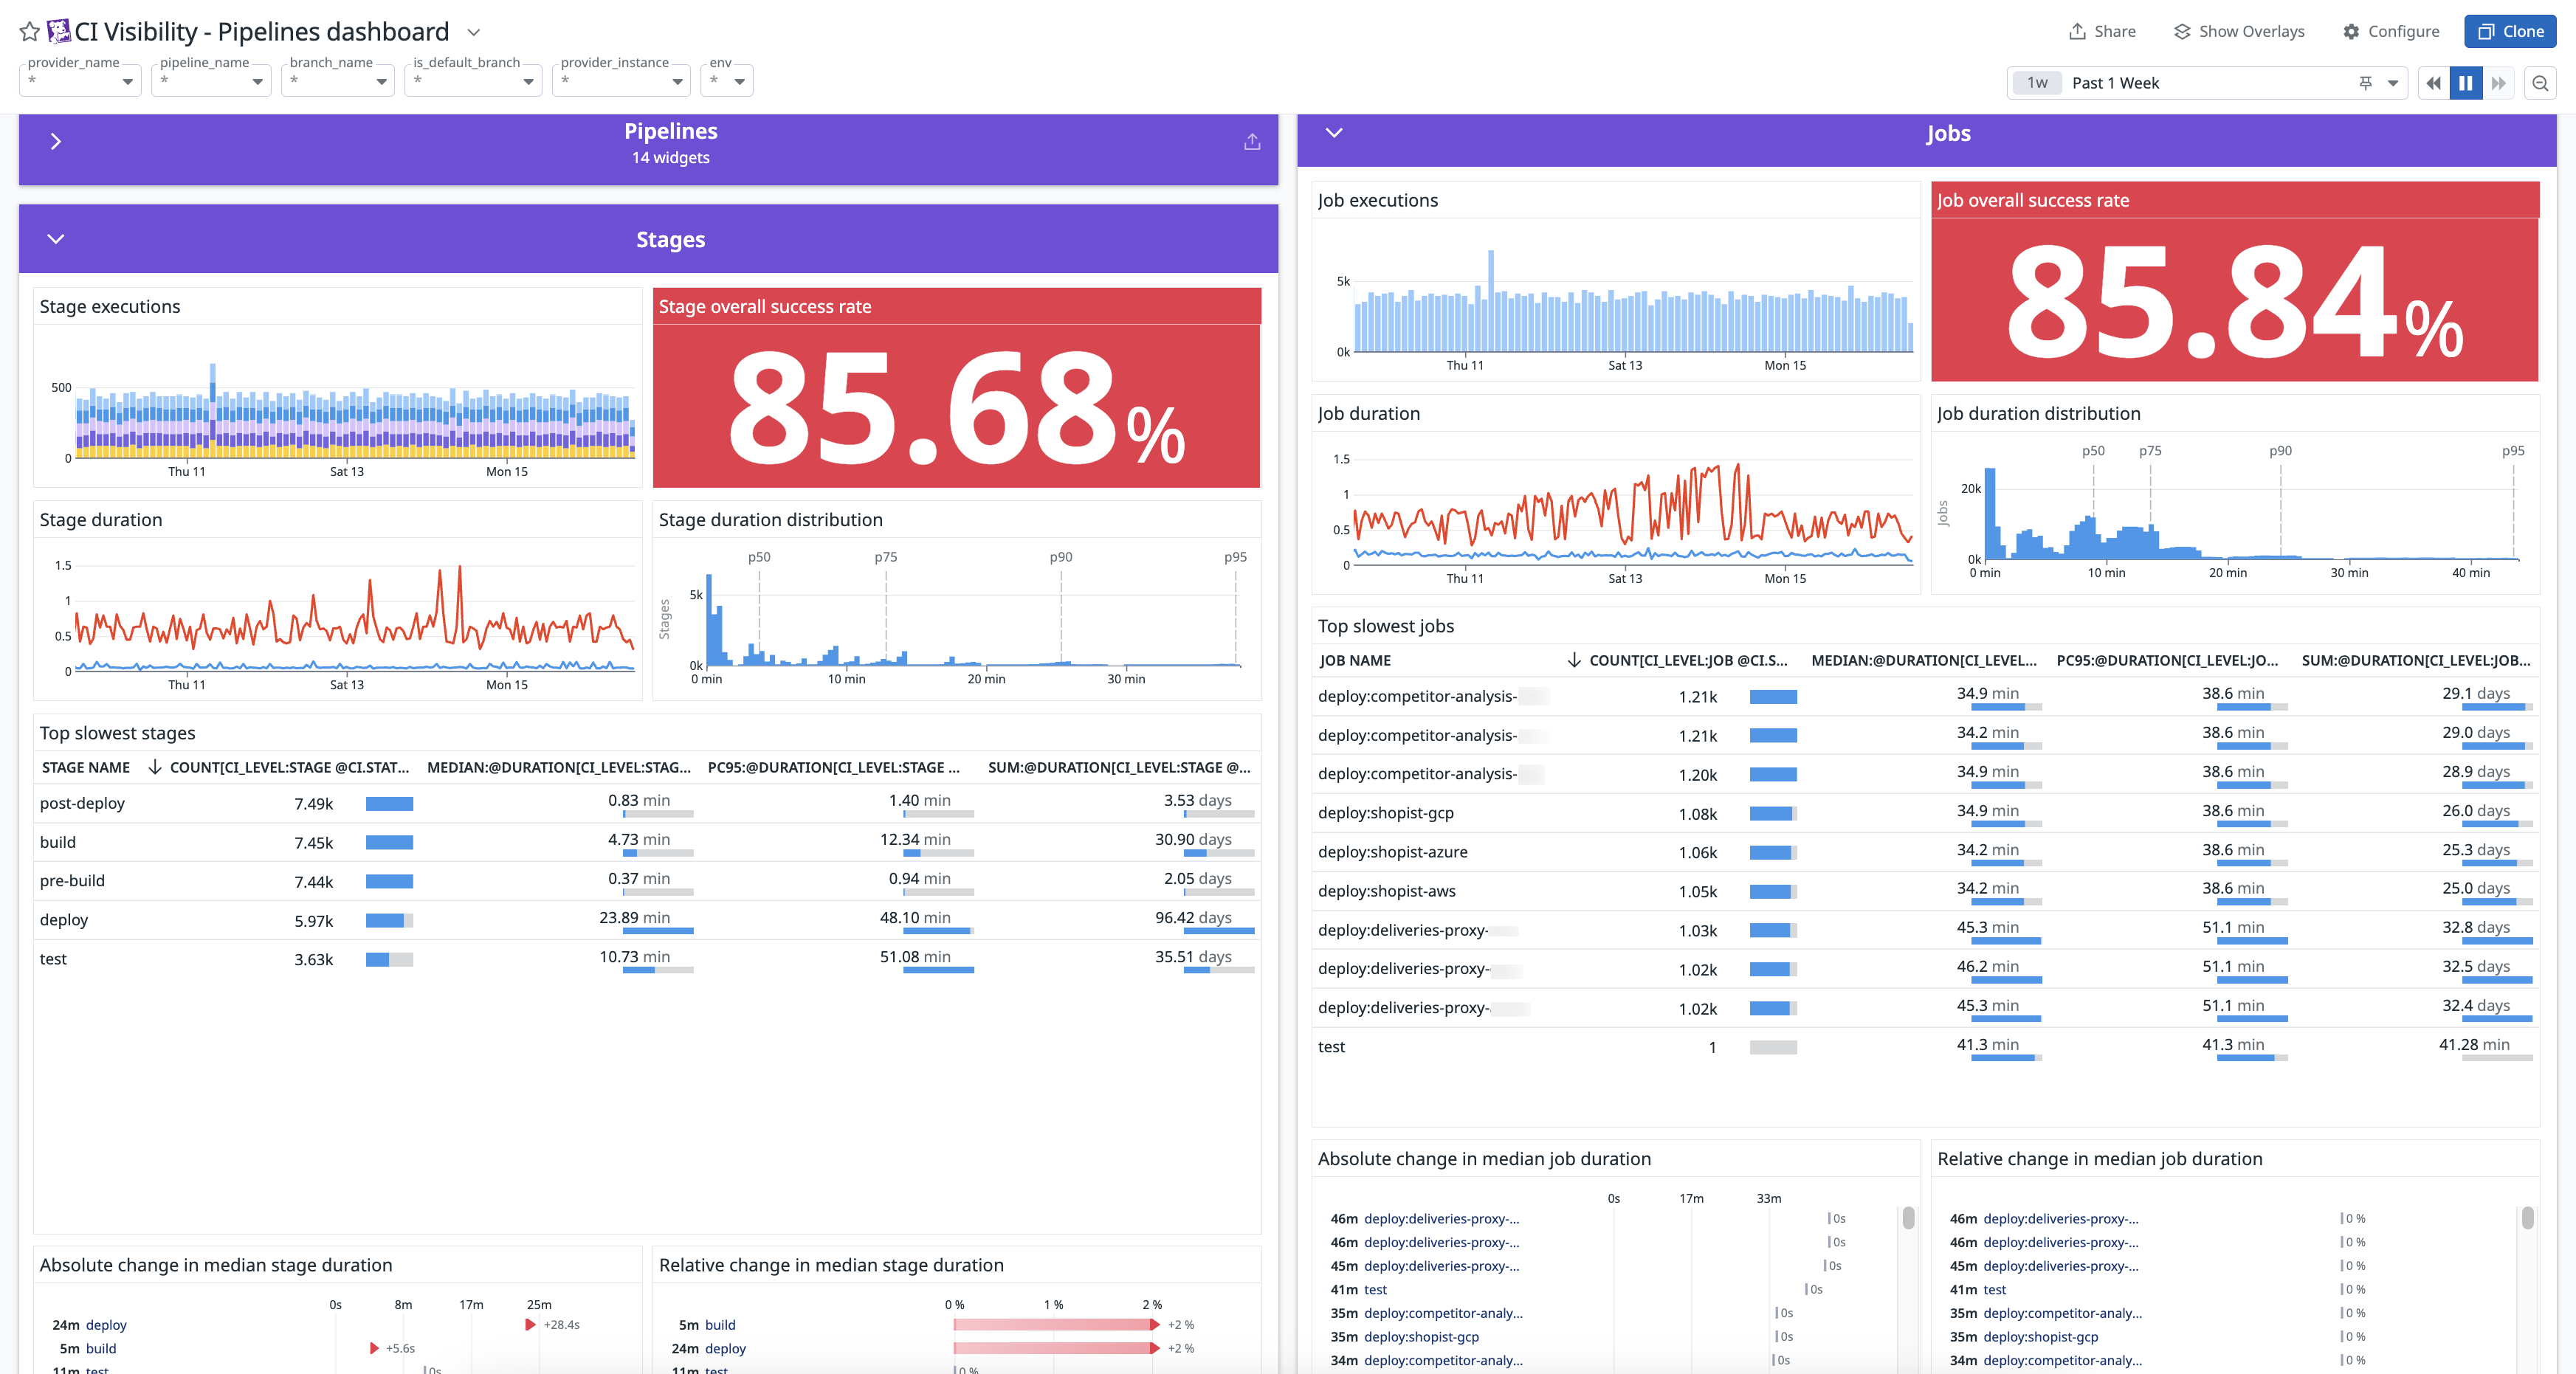
You can create dashboards to visualize at which points failures are happening in your pipelines, or use an out-of-the-box dashboard containing widgets populated with data collected in CI Visibility to visualize the health and performance of your CI pipelines, stages, and jobs.
Search and manage your CI pipelines
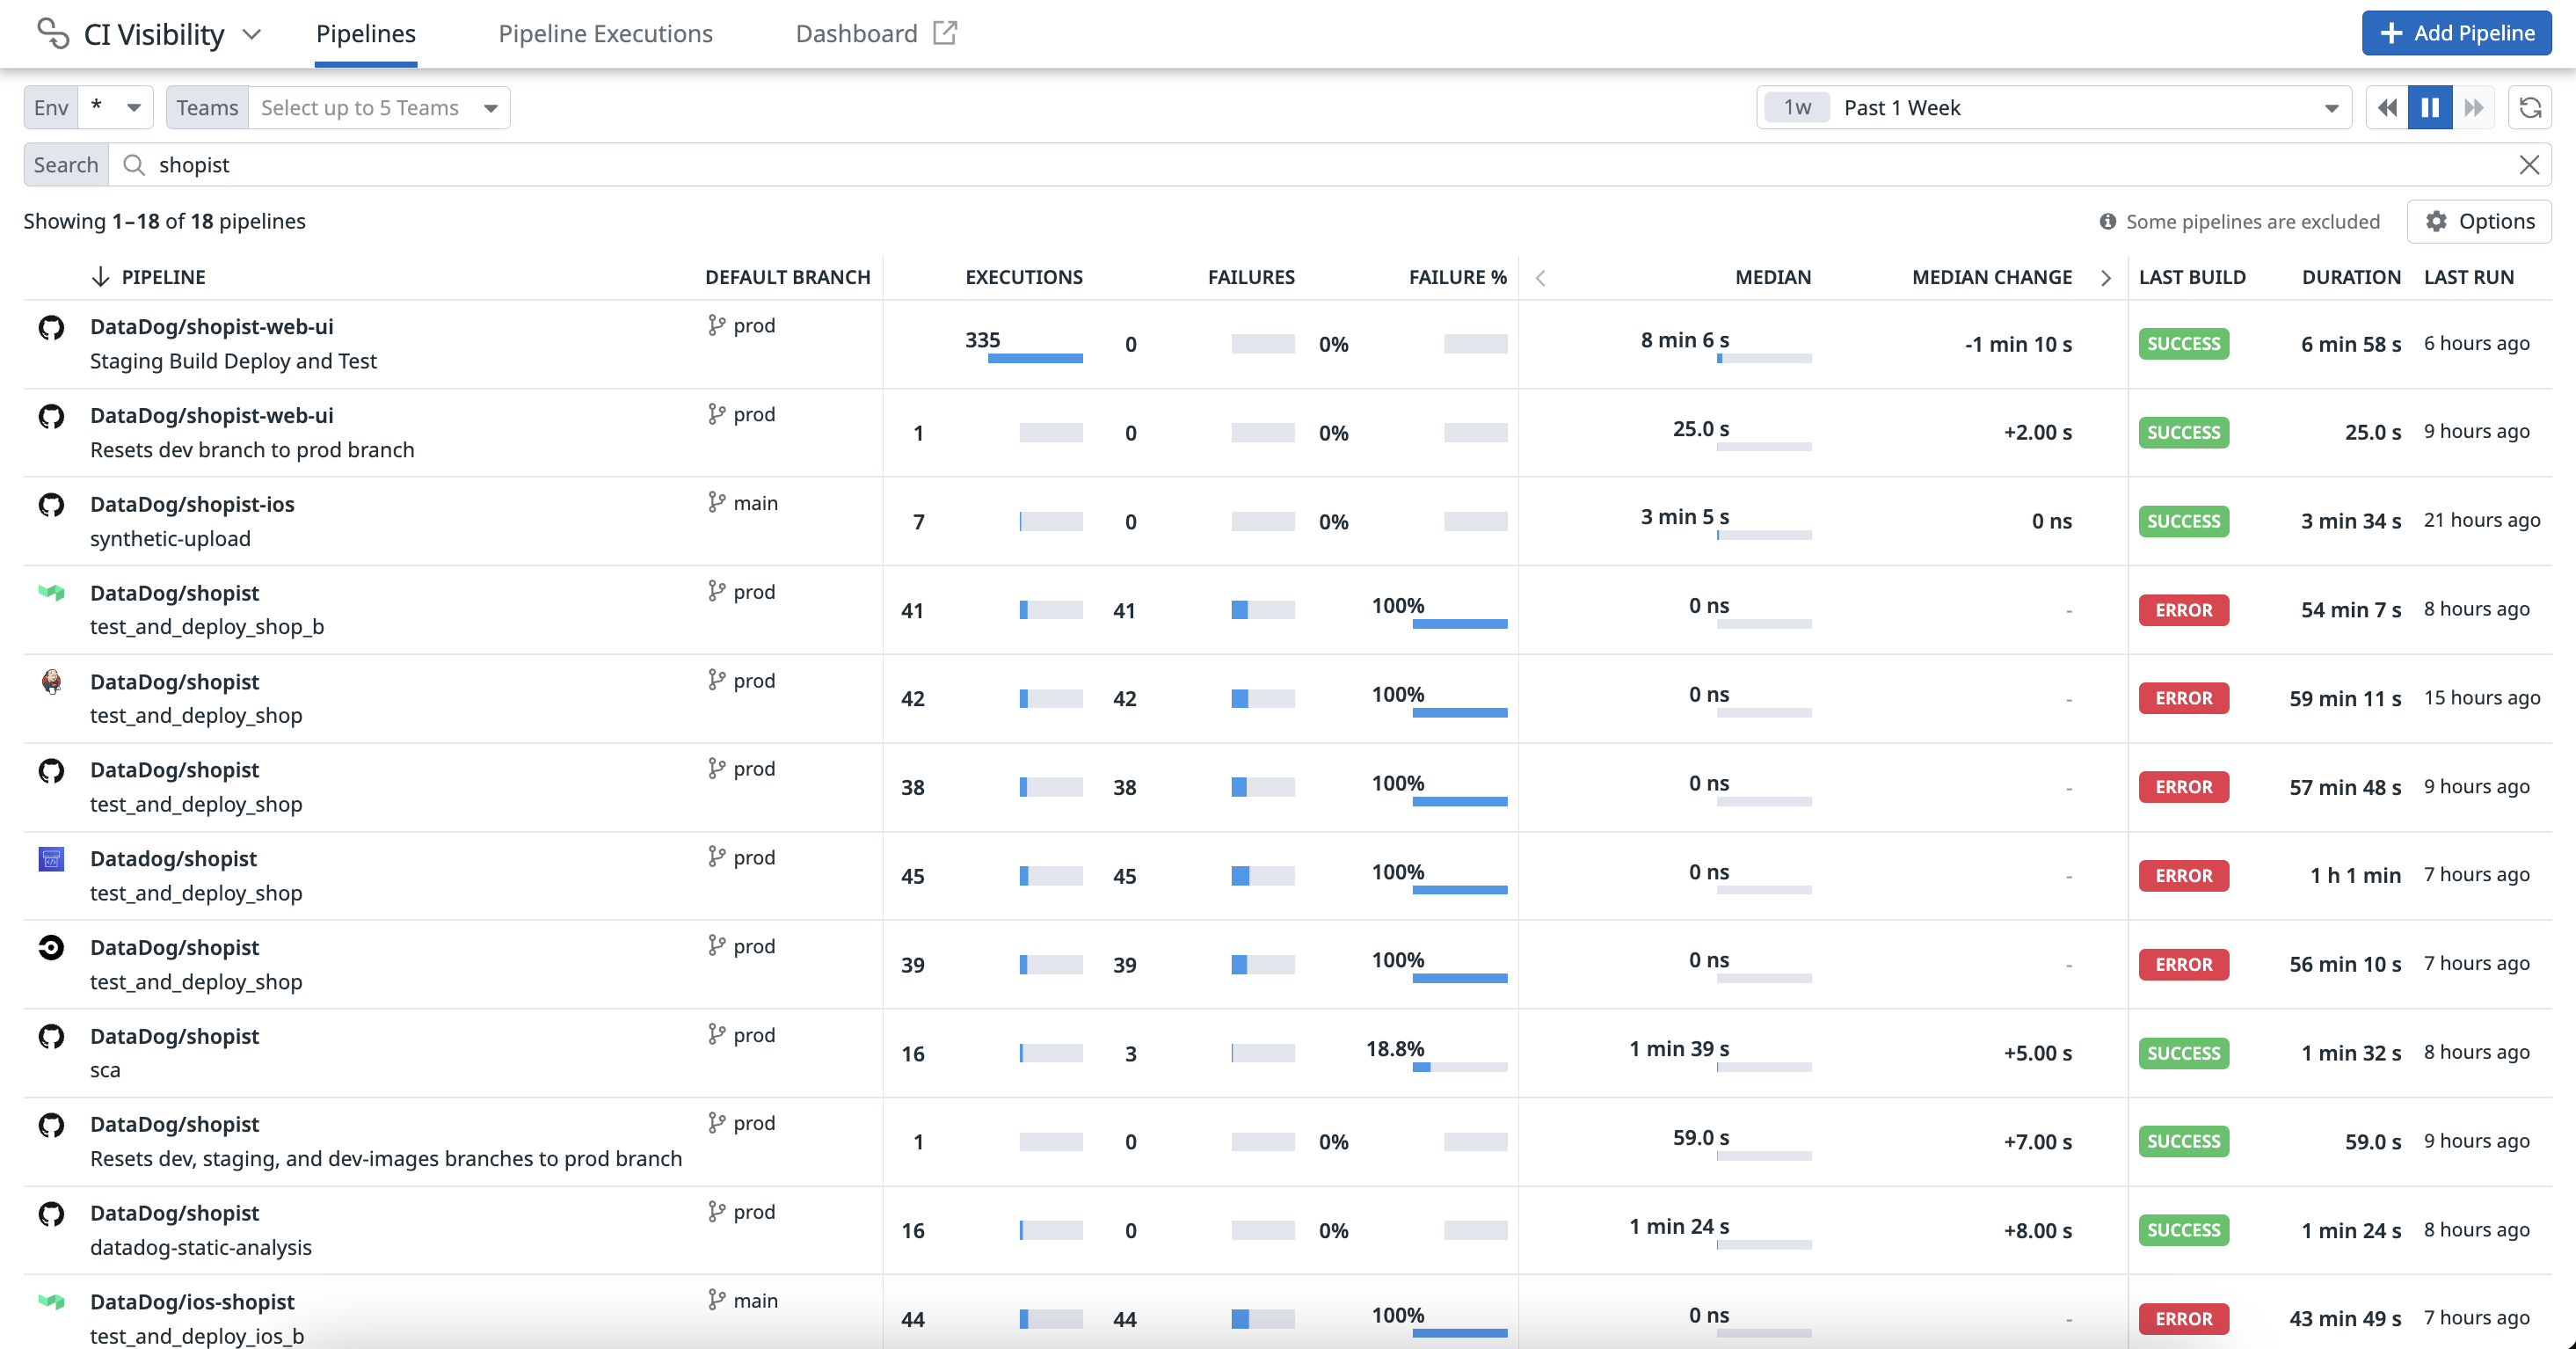
The CI Pipeline List page provides a comprehensive view of the performance and reliability of your CI pipelines, for the default branch. Access aggregated statistics, trends, and information about your pipelines to identify and resolve issues like failures and regressions.
To enhance troubleshooting and streamline your pipeline management processes, click on a pipeline to access insights, review execution histories, and pivot to logs and related telemetry data. For more information, see Search and Manage CI Pipelines.
Examine results in the CI Visibility Explorer
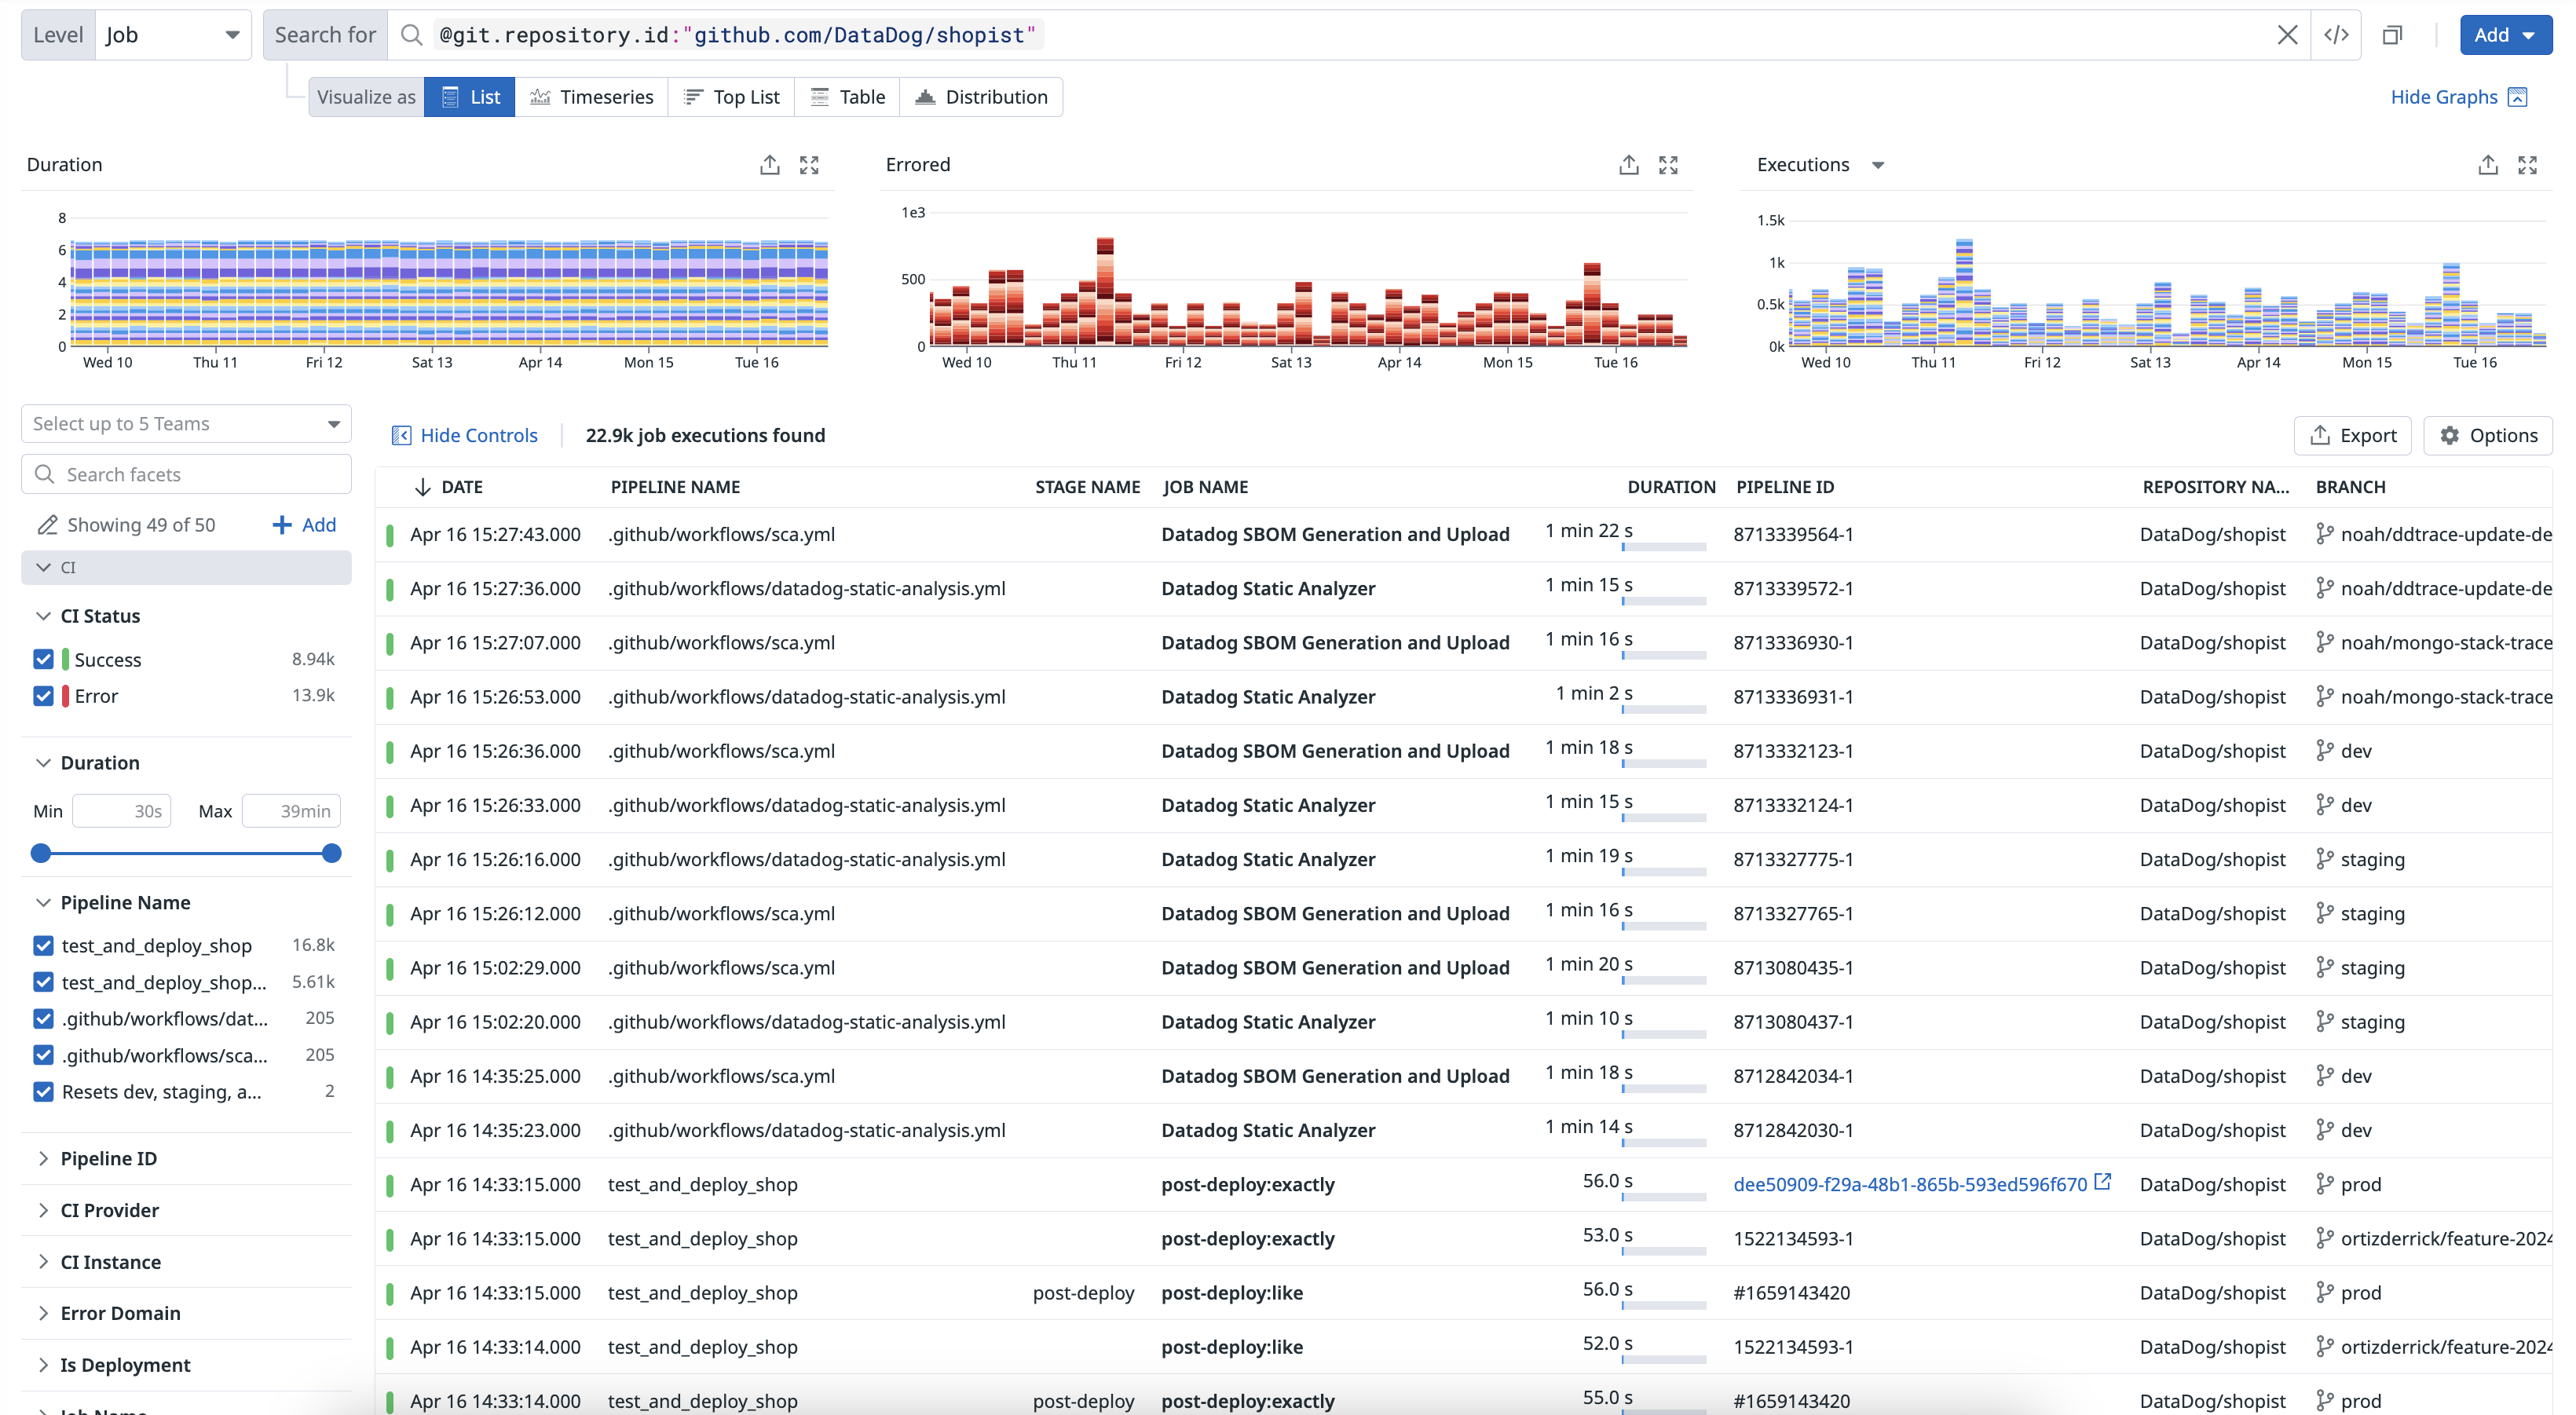
The CI Visibility Explorer allows you to create visualizations and filter pipeline spans using the data collected from your CI providers. Each pipeline execution is reported as a trace, which includes stage and job information.
Navigate to Software Delivery > CI Visibility > Executions and select Pipeline to start filtering your pipeline span results.
Navigate to Software Delivery > CI Visibility > Executions and select Stage to start filtering your stage span results.
Navigate to Software Delivery > CI Visibility > Executions and select Job to start filtering your job span results.
Navigate to Software Delivery > CI Visibility > Executions and select Step to start filtering your step span results.
Use facets to customize the search query and identify changes in time spent on each level of your pipeline.
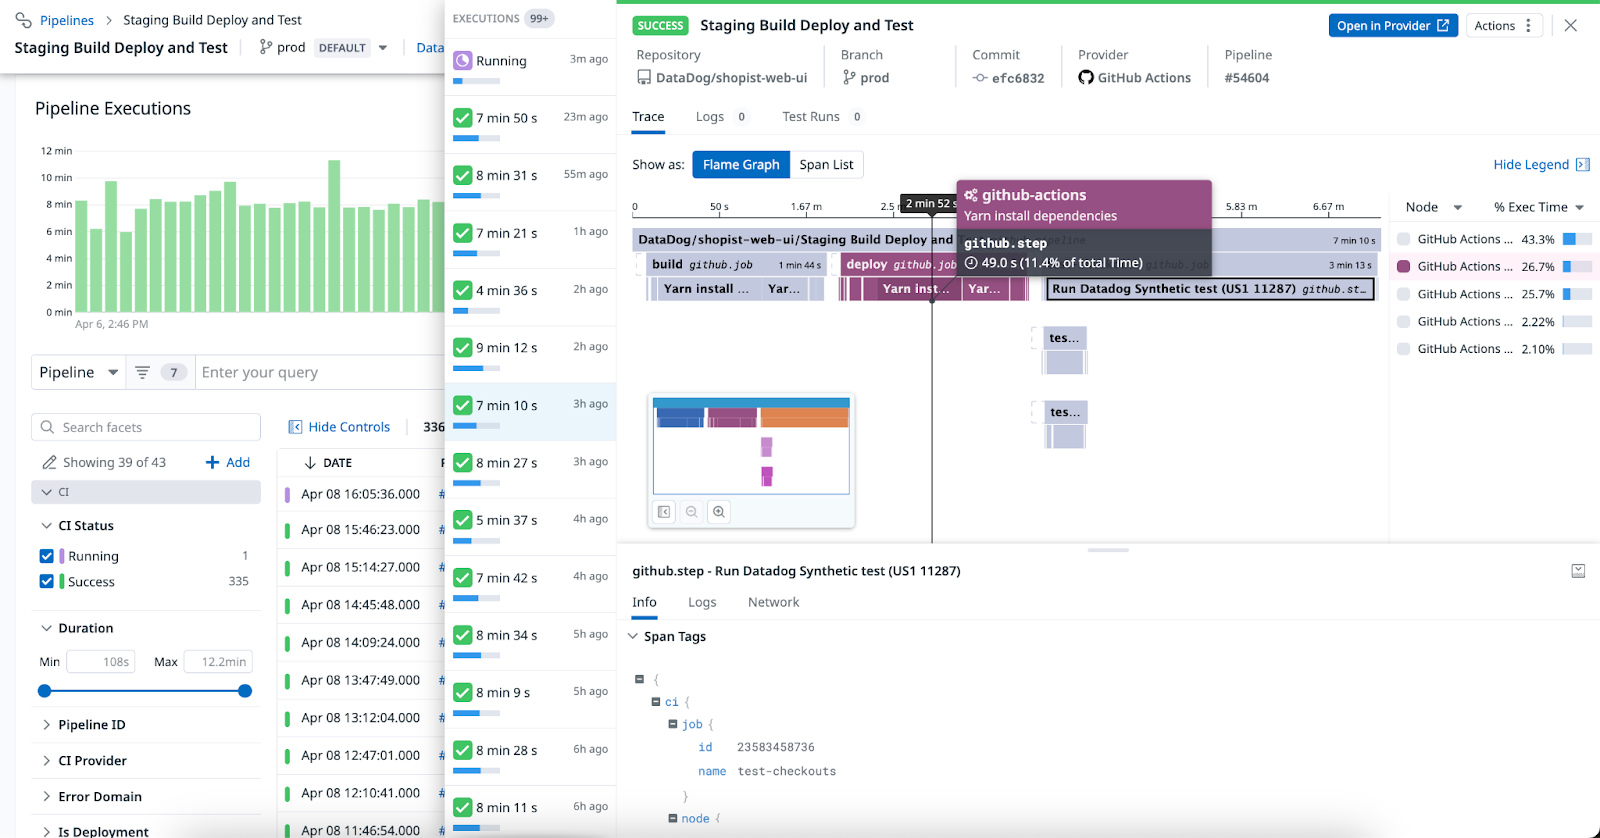
Once you click into a pipeline, you can access individual pipeline executions listed in the Pipeline Executions section. When you click on a pipeline execution, you can see a flame graph or a list of spans in the Trace tab.
You can identify bottlenecks in your pipeline and examine individual nodes ranked from the largest to smallest percentage of execution time.
After you have set up Test Optimization, you can access information about tests that were run in your CI pipelines, including the test status (Failed, New Flaky, Passed, or Skipped), on the Test Runs tab in a pipeline execution’s side panel. For more information, see the Flaky Test Management documentation.
You can access pipeline or job logs across cloud and self-hosted runners and see information about your runners on the Logs tab in a pipeline execution’s side panel.
If you are using supported providers, you can correlate infrastructure metrics with your GitLab jobs and access the GitLab job’s host, system, host tags, and host metrics information. For more information, see Correlate Infrastructure Metrics with GitLab Jobs in Datadog.
Send pipeline events to Datadog
For other pipeline providers and custom pipelines, you can programmatically send pipeline events to Datadog using the CI Visibility Pipelines API. For more information, see Pipeline Data Model and Execution Types.
Provide the following Git information (the repository URL, commit SHA, and the author email) of the commit that triggered the pipeline execution in the request.
Create a CI pipeline monitor
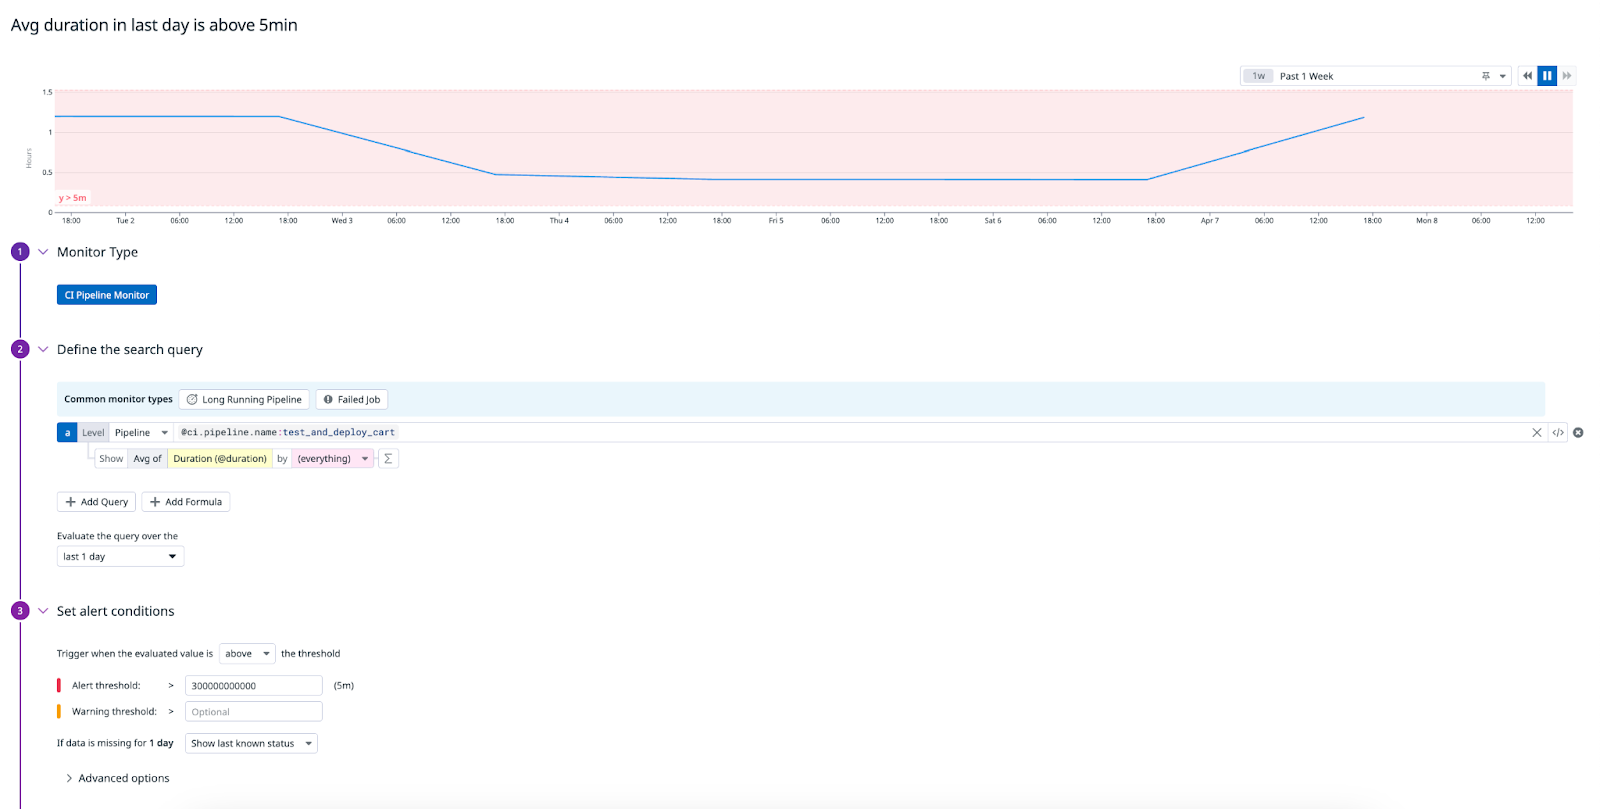
Alert relevant teams in your organization about pipeline health and performance regressions when failures occur or duration thresholds are exceeded in your CI pipelines with CI monitors.
To set up a monitor that alerts on your CI pipeline when the average duration in the past day exceeds a five minute threshold:
- Navigate to Monitors > New Monitor and select CI.
- Select a common monitor type for CI pipelines to get started, for example:
Long Running Pipelineto trigger alerts when a pipeline has been running for too long orFailed Jobto trigger alerts for job failures, or customize your own search query. In this example, enter@ci.pipeline.name:test_and_deploy_cartand select the Avg ofDuration (@duration). - In the
Evaluate the query over thesection, select last 1 day. - Set the alert conditions to trigger when the evaluated value is above the threshold, and specify values for the alert or warning thresholds, such as
Alert threshold > 300000000000. - In the
Configure notifications and automationssection, configure your monitor’s notification settings. - Set permissions for the monitor.
- Click Create.
Further Reading
Additional helpful documentation, links, and articles:
